
CINV Treatment Market Size and Share
Market Overview
| Study Period | 2020 - 2031 |
|---|---|
| Market Size (2026) | USD 5.68 Billion |
| Market Size (2031) | USD 7.46 Billion |
| Growth Rate (2026 - 2031) | 5.62 % |
| Fastest Growing Market | Asia Pacific |
| Largest Market | North America |
| Market Concentration | Medium |
Major Players *Disclaimer: Major Players sorted in no particular order Image © Mordor Intelligence. Reuse requires attribution under CC BY 4.0. | |
CINV Treatment Market Analysis by Mordor Intelligence
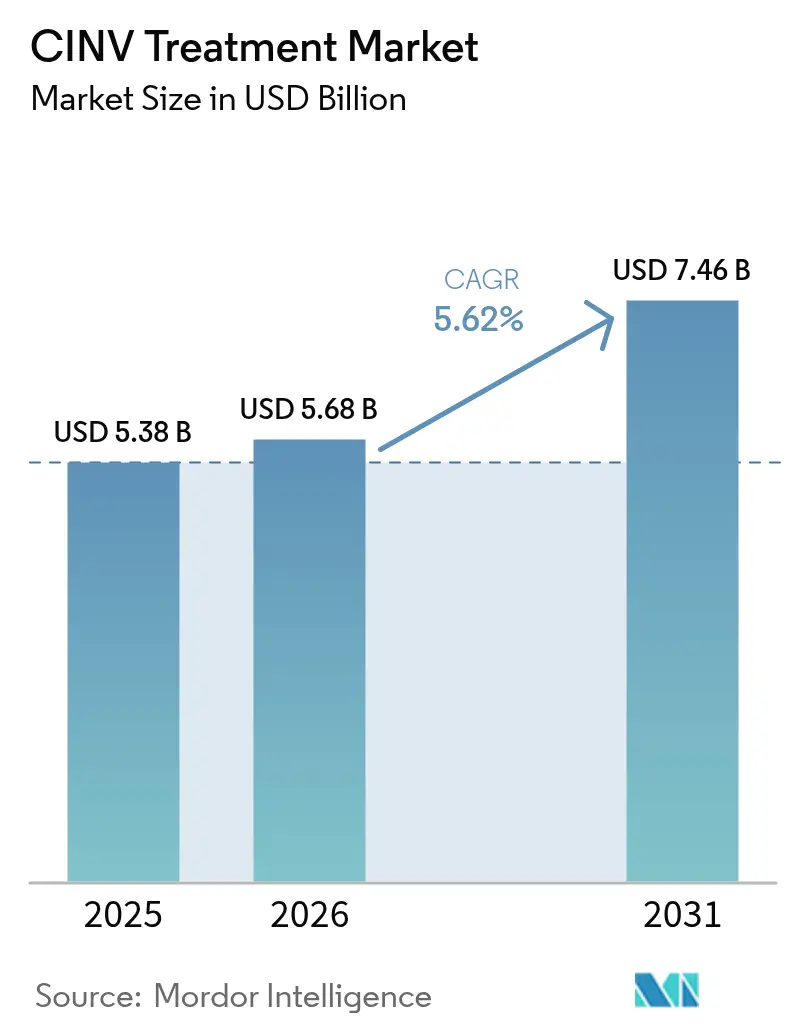
The CINV Treatment Market size is expected to grow from USD 5.38 billion in 2025 to USD 5.68 billion in 2026 and is forecast to reach USD 7.46 billion by 2031 at 5.62% CAGR over 2026-2031.
Sustained demand arises from expanding cancer prevalence, wider use of highly-emetogenic chemotherapy, and the steady migration of care toward outpatient and home-based settings. Oral and extended-release formulations gain traction because they fit decentralized care pathways and improve adherence, a shift that tempers the historical dominance of injectables. Patent expiries for key brands place near-term pressure on prices, yet they also open space for differentiated products that emphasize convenience, fixed-dose combinations, and personalized dosing. Asia-Pacific’s regulatory harmonization and rising oncology caseload drive the fastest regional growth, while North America leverages reimbursement depth and clinical trial infrastructure to remain the largest contributor to CINV treatment market revenue.
Key Report Takeaways
- By drug class, 5-HT3 receptor antagonists led with 44.12% of CINV treatment market share in 2025; NK1 receptor antagonists are projected to expand at a 6.42% CAGR through 2031.
- By formulation, injectables commanded 55.32% share of the CINV treatment market size in 2025, whereas oral formulations are growing at 7.08% CAGR to 2031.
- By end user, hospitals held 44.05% of the CINV treatment market in 2025, and homecare & ambulatory surgery centers are forecast to rise at an 7.84% CAGR through 2031.
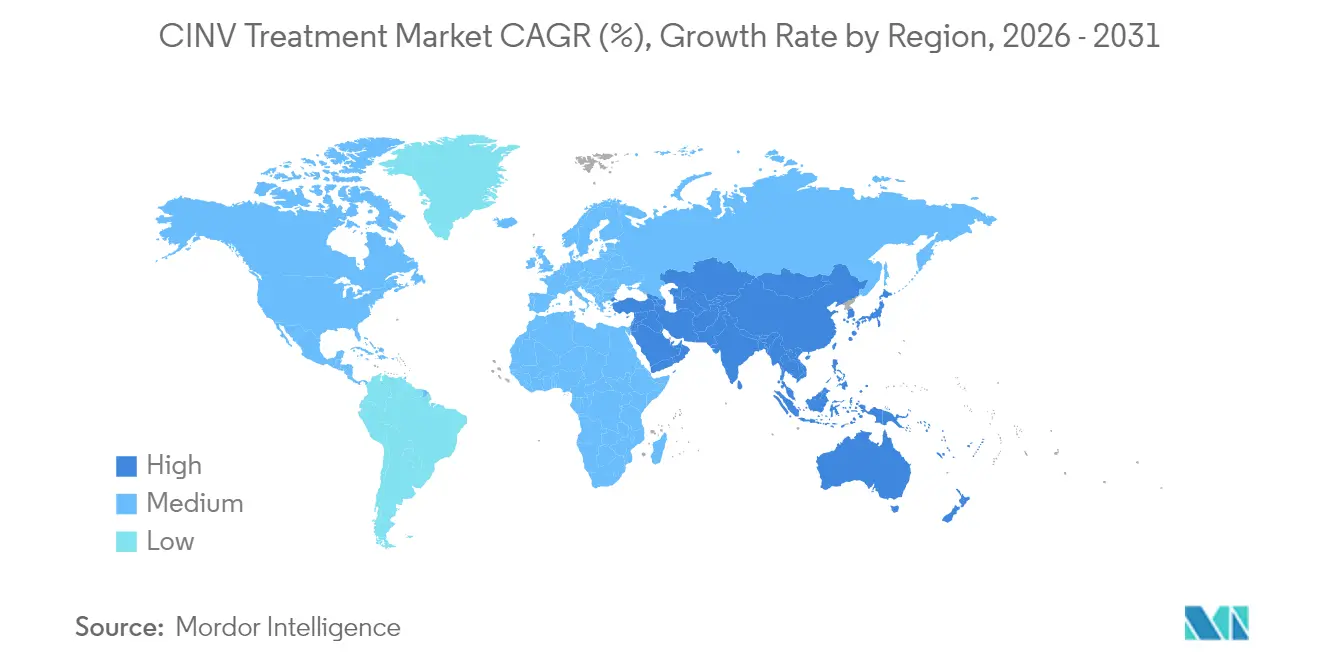
- By geography, North America accounted for 37.20% of CINV treatment market revenue in 2025, while Asia-Pacific records the highest projected CAGR at 6.78% to 2031.
Note: Market size and forecast figures in this report are generated using Mordor Intelligence’s proprietary estimation framework, updated with the latest available data and insights as of 2026.
Market Trends and Insights
Drivers Impact Analysis of CINV Treatment Market*
| Driver | (~) % Impact on CAGR Forecast | Geographic Relevance | Impact Timeline |
|---|---|---|---|
| Increasing prevalence of cancer | +1.2% | Global | Long term (≥ 4 years) |
| Adoption of highly-emetogenic chemotherapy | +0.9% | North America & EU | Medium term (2-4 years) |
| Guideline-driven uptake of triple therapy | +0.8% | Global | Short term (≤ 2 years) |
| Fixed-dose combos & extended-release formats | +0.7% | North America & EU | Medium term (2-4 years) |
| Oral oncolytics boosting oral antiemetics | +0.6% | Asia-Pacific, spill-over to MEA | Long term (≥ 4 years) |
| Pharmacogenomics-based personalization | +0.4% | North America & EU | Long term (≥ 4 years) |
| Source: Mordor Intelligence | |||
Increasing Prevalence of Cancer
Breakthrough oncology drugs cleared by the FDA in 2024 widened the treated patient pool, intensifying demand for supportive care antiemetics. Longer survival times among older populations further lengthen exposure to chemotherapy and related nausea risks, ensuring that antiemetic use scales alongside oncology advances. The demographic shift toward aging populations in developed markets compounds this trend, as older patients typically require more aggressive chemotherapy protocols with higher emetogenic potential. Additionally, improved cancer screening programs detect malignancies at earlier stages, leading to longer treatment durations and cumulative antiemetic exposure per patient.
Adoption of Highly-Emetogenic Chemotherapy Regimens
Clinical protocols incorporating anthracycline-based or platinum-dense regimens hinge on robust antiemetic prophylaxis, steering prescribers toward premium NK1 antagonists. A study showed 94.7% complete response when olanzapine, palonosetron, and fosaprepitant were combined for high-risk patients.[1]The trend accelerates as precision oncology identifies patient subgroups requiring intensified treatment approaches, creating sustained demand for advanced antiemetic solutions. Furthermore, the integration of immunotherapy with traditional chemotherapy creates novel emetogenic profiles that require specialized management strategies.
Guideline-Driven Uptake of Triple Antiemetic Therapy
Updated MASCC-ESMO guidelines standardize triple-agent prophylaxis for moderate-to-high emetogenic therapy, reducing practice variability and cementing routine use of NK1-5-HT3-dexamethasone combinations.[2]The consensus-driven approach builds confidence among healthcare providers, particularly in resource-constrained settings where treatment decisions require strong evidence support. Additionally, guideline adherence becomes increasingly important for reimbursement approval, creating economic incentives for compliance with recommended antiemetic protocols.
Fixed-Dose Combos & Extended-Release Formulations
Products such as Sustol deliver ≥ 5-day coverage, easing delayed-phase nausea control and discouraging off-schedule rescue dosing.[3] Formulation innovation offers life-cycle extension benefits for manufacturers facing generic erosion on immediate-release versions. Fixed-dose combinations like AKYNZEO (netupitant/palonosetron) eliminate dosing complexity and reduce medication errors, particularly important in outpatient settings where nursing supervision is limited. These formulation advances also create differentiation opportunities for pharmaceutical companies facing generic competition on traditional immediate-release products.
Restraints Impact Analysis of CINV Treatment Market*
| Restraint | (~) % Impact on CAGR Forecast | Geographic Relevance | Impact Timeline |
|---|---|---|---|
| Patent expiries driving price erosion | -1.1% | Global | Short term (≤ 2 years) |
| Side-effect profile limiting adherence | -0.6% | Global | Medium term (2-4 years) |
| Oncologist under-estimation of emetogenicity | -0.4% | Global | Medium term (2-4 years) |
| Restricted reimbursement in emerging markets | -0.3% | Asia-Pacific, spill-over to MEA | Long term (≥ 4 years) |
| Source: Mordor Intelligence | |||
Patent Expiries Driving Price Erosion
Loss of exclusivity for brands such as Sancuso intensifies generic entry, compressing average selling prices and challenging R&D reinvestment models for incumbents, particularly in regions where payers prioritize least-cost alternatives. Companies respond through defensive strategies including authorized generics, value-based contracting, and lifecycle management initiatives, but these approaches typically delay rather than prevent revenue erosion. The pricing pressure intensifies in emerging markets where healthcare systems prioritize cost-effectiveness over brand preference, accelerating generic adoption rates.
Side-Effect Profile Limiting Adherence
Sedation, constipation, and rare seizure-like events associated with NK1 agents complicate chronic use, prompting dose adjustments or switches that can compromise prophylactic consistency. The challenge intensifies as treatment durations extend and patients receive multiple chemotherapy cycles, creating cumulative exposure risks that require careful monitoring and potential dose modifications.
*Our forecasts treat driver/restraint impacts as directional, not additive. The impact forecasts reflect baseline growth, mix effects, and variable interactions.
CINV Treatment Market Segment Analysis
By Drug Class:
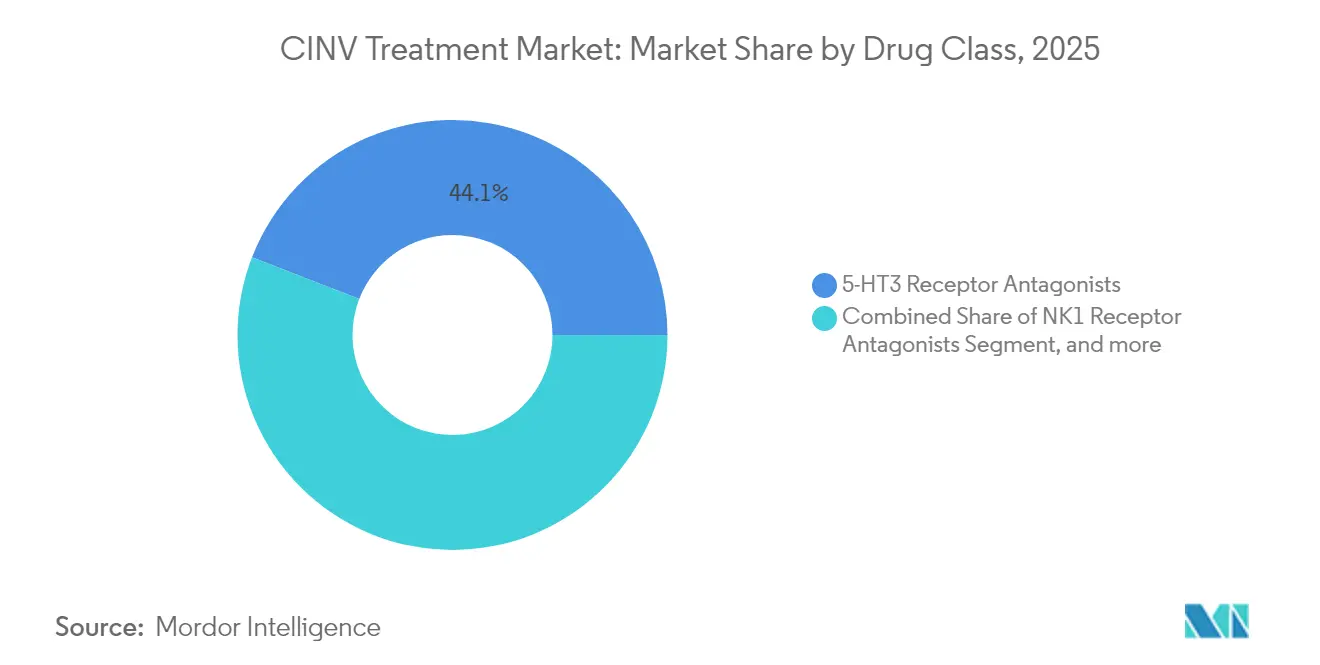
NK1 Antagonists Gain Momentum5-HT3 receptor antagonists retained a 44.12% CINV treatment market share in 2025, a position built on long-standing clinical familiarity. Yet the segment grows modestly as clinicians increasingly adopt NK1 agents for delayed-phase protection. The CINV treatment market size tied to NK1 antagonists is on track to rise at 6.42% CAGR thanks to guideline endorsements and new once-daily formulations. Robust clinical evidence underpins NK1 uptake, and brands such as CINVANTI extend protection through 2035 patents, giving innovators pricing latitude.
Complementary roles for dopamine antagonists and corticosteroids persist, while cannabinoids remain a niche option for refractory cases. Evidence supporting olanzapine’s multi-receptor blockade is altering rescue therapy preferences, especially for breakthrough nausea where single-mechanism drugs show gaps. As combination regimens become standard, manufacturers that integrate NK1 components with 5-HT3 or corticosteroids in a single capsule or infusion capture workflow efficiencies that resonate with oncology clinics.

By Formulation:
Oral Delivery AcceleratesInjectables maintained 55.32% of 2025 revenue, benefiting from controlled inpatient settings and immediate bioavailability requirements during initial chemotherapy cycles. Hospitals and infusion centers continue to rely on IV fosaprepitant and palonosetron for day-one coverage. However, the oral sub-segment is expanding at a 7.08% CAGR, led by once-per-cycle extended-release tablets that align with home-based oncology regimens. Oral formulations also reduce nursing time and syringe disposal costs, creating tangible operational savings that appeal to value-based procurement teams.
Transdermal and sublingual formats address swallowing difficulties or persistent nausea preventing oral intake, yet their uptake remains incremental. Manufacturers are refining polymer matrices to extend transdermal release, a strategy expected to unlock future gains beyond 2030. The rise of single-tablet triple therapies illustrates how formulation innovation can circumvent generic-driven price wars, preserving brand differentiation inside an increasingly crowded CINV treatment market.
By End User:
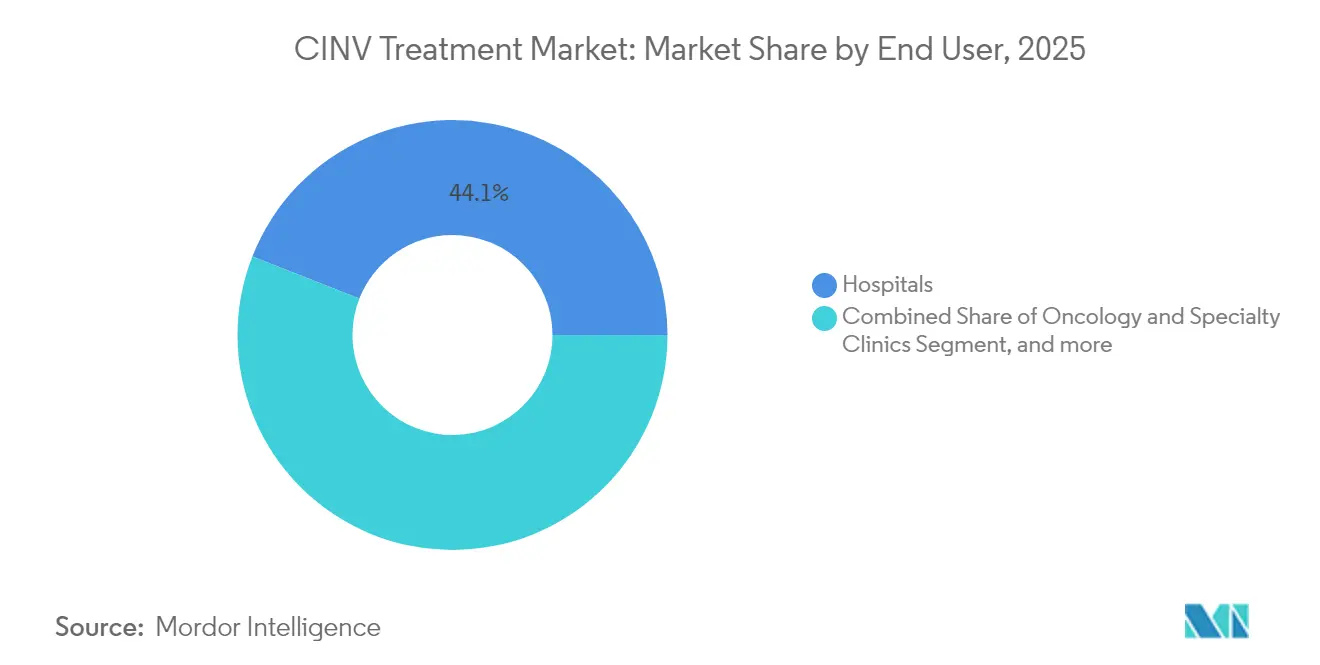
Decentralized Care Gains TractionHospitals held 44.05% of 2025 revenue because most first-cycle chemotherapies and acute toxicity emergencies still unfold in tertiary centers. Multidrug IV protocols and reimbursement bundling favor inpatient settings, ensuring hospitals remain a critical channel for the CINV treatment market. Oncology clinics deliver personalized dosing adjustments and rapid follow-up, reinforcing their relevance even as payers push infusions to lower-cost venues.
Homecare and ambulatory surgery centers are posting an 7.84% CAGR as payers recognize 20-40% cost reductions versus hospital delivery. Growth in wearable infusion pumps and oral targeted therapies reduces the need for chair time, enabling stable patients to shift antiemetic management to home. Manufacturers that design patient-friendly packaging, digital adherence reminders, and easy-to-open blister packs stand to gain loyalty within this rising care segment of the CINV treatment market.
Geography Analysis
North America CINV Treatment Market
North America generated 37.20% of global revenue in 2025 owing to established clinical guideline enforcement, rapid FDA approvals, and extensive insurance coverage for supportive oncology drugs. The region’s clinicians readily adopt extended-release innovations despite higher acquisition costs when data show reduced rescue medication use. Patent expiries are expected to temper annual price growth, but volume expansion from rising cancer incidence and broader use of immuno-chemotherapy combinations sustains overall market value. Value-based care models are nudging hospital systems toward longer-acting antiemetics that cut infusion chair occupancy and readmissions.
APAC CINV Treatment Market
Asia-Pacific is projected to grow at 6.78% CAGR through 2031 as China, India, and Southeast Asian countries expand oncology infrastructure and harmonize regulatory pathways. China’s National Medical Products Administration cleared 228 NDAs in 2024, 37% for antineoplastic agents, catalyzing supportive-care demand. Domestic manufacturers introduce cost-competitive NK1 generics, while multinational firms leverage accelerated pathways to launch fixed-dose combos. Pharmacovigilance capacity is rising, making data-driven formulary inclusion more feasible across public hospitals.
EMEA and South America CINV Treatment Market
Europe maintains consistent demand anchored by harmonized EMA approvals and robust health technology assessments that balance innovation with cost containment. National reimbursement boards emphasize real-world effectiveness data, favoring products that document reduced rescue therapy and hospital re-visits. Emerging regions in MEA and South America remain nascent contributors yet represent strategic expansions for companies willing to localize production and navigate fragmented regulatory landscapes.
Regulatory Landscape
CINV treatment development and use are shaped by regulator-led quality, labeling, and post-market requirements, alongside guideline bodies that operationalize emetogenic-risk stratification into prescribing standards. In the United States, the FDA provides a dedicated development framework for chemotherapy-induced nausea and vomiting (CINV) prevention, and recent approvals continue to emphasize formulation and usability improvements for established mechanisms. For example, the FDA approved Azurity Pharmaceuticals' aprepitant injectable emulsion on June 25, 2026, supporting ready-to-use parenteral access to an NK1 pathway option.
In Europe, centralized authorization via the European Commission and scientific evaluation through the EMA influence availability of differentiated fixed-dose combinations and alternate dosage forms. On February 12, 2026, the European Commission granted marketing authorization for Helsinn's AKYNZEO oral suspension (netupitant/palonosetron), adding formulation flexibility aligned with outpatient and patient-specific administration needs. Across regions, clinical practice guidance from MASCC/ESMO (2023), NCCN (updated regularly), and local provider policies, including Royal Cornwall Hospitals NHS Trust antiemetics guideline v6.0 issued October 2025 incorporating 2023 MASCC/ESMO updates, reinforces multi-agent prophylaxis and supports formulary alignment in hospitals and oncology networks.
Competitive Landscape
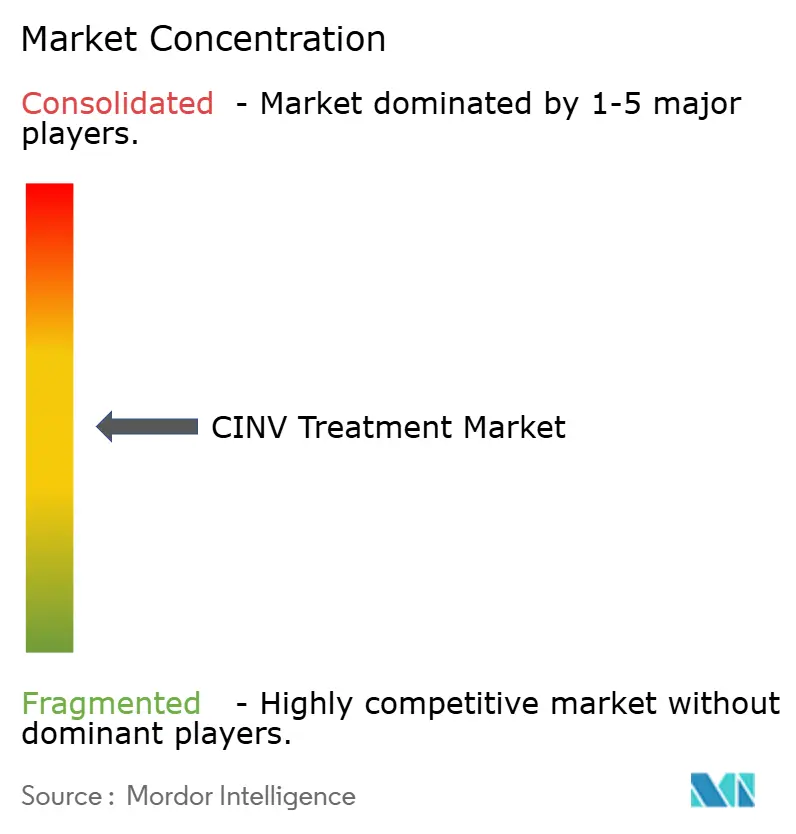
The CINV treatment market is moderately concentrated, with innovators relying on intellectual property to defend premium NK1 and combo products. Heron Therapeutics, for instance, extended CINVANTI exclusivity to 2035, enabling its 2024 revenue to climb to USD 100.1 million despite intensifying generic competition in 5-HT3 and corticosteroid classes. Market players increasingly allocate R&D toward delivery innovation rather than novel targets, reflecting clinical consensus around multi-receptor blockade.
Strategic alliances facilitate penetration in high-growth Asia-Pacific markets where domestic distribution and tender experience accelerate uptake. Daiichi Sankyo’s purchase of ramosetron rights illustrates outbound licensing to strengthen regional portfolios. Midsize firms prioritize lifecycle management, including authorized generics and extended-release line extensions, to offset erosion following patent cliffs. Digital adherence tools bundled with therapy packs are emerging differentiators, linking symptom diaries to tele-oncology platforms and reinforcing brand loyalty.
M&A momentum persists as large pharmas seek to round out oncology supportive-care offerings. GSK’s USD 1.15 billion acquisition of IDRx in January 2025 exemplifies this trend, augmenting pipeline breadth and heightening competitive stakes. While barriers to entry for novel mechanisms remain high, formulation innovators and specialty generics firms continue to challenge incumbents, ensuring ongoing price rationalization within the CINV treatment market.
CINV Treatment Industry Leaders
-
Merck & Co., Inc.
-
GlaxoSmithKline plc
-
Heron Therapeutics, Inc.
-
Helsinn Group
-
Novartis AG
- *Disclaimer: Major Players sorted in no particular order
CINV Treatment Market Companies Covered in this Report
- Merck
- GlaxoSmithKline
- Heron Therapeutics
- Helsinn Group
- Novartis
- Pfizer
- Johnson & Johnson
- Baxter
- Teva Pharmaceutical Industries
- Sun Pharma Industries Ltd.
- Roche
- Dr Reddy’s Laboratories
- Cipla
- Eisai
- Accord Healthcare
- Mundipharma Intl.
- Tesaro (Biotech)
- Fresenius
- Lupin
- Orchid Healthcare
Market Opportunities and Future Outlook
Opportunities concentrate on simplified, adherence-forward prophylaxis that matches the shift toward outpatient and home-based oncology care, where reducing administration complexity and rescue-medication use improves day-to-day workflow. Fixed-dose combinations and alternative presentations, such as oral suspensions and ready-to-use injectables, support differentiation as patent expiries erode pricing power for older single-agent 5-HT3 and corticosteroid regimens. The February 2026 European Commission authorization of AKYNZEO oral suspension is a concrete example of this movement toward broader dosage-form optionality for established NK1/5-HT3 combinations.
A near-term opportunity also centers on regimen optimization around steroid-sparing approaches in highly emetogenic chemotherapy, reflecting efforts to reduce corticosteroid-related toxicity while maintaining control across acute and delayed phases. In June 2026, a randomized phase III non-inferiority study reported that NEPA plus olanzapine with reduced or omitted dexamethasone achieved complete response rates non-inferior to a standard 4-day dexamethasone schedule in HEC, supporting a development and lifecycle-management pathway for manufacturers positioned in NK1-based combinations. Ongoing Phase III activity reported in 2026 for new combination candidates, including fosrolapitant/palonosetron and mixed aprepitant/palonosetron programs, highlights continued emphasis on single-administration options that can be deployed consistently across diverse chemotherapy protocols.
Recent Industry Developments in CINV Treatment Market
- June 2026: The FDA approved Azurity Pharmaceuticals' aprepitant injectable emulsion for CINV-related use, expanding access to an NK1-pathway option in a ready-to-use parenteral format. The approval supports hospital and infusion-center workflows where preparation time, stability, and dosing practicality influence formulary decisions.
- May 2026: Heron Therapeutics reported first-quarter 2026 results and outlined commercialization actions that included continued active promotion of CINVANTI alongside plans to expand its sales force in Q3 2026. The move reinforces competitive intensity in branded NK1 receptor antagonists as companies defend share amid broader pricing pressure from genericized classes.
- October 2024: The FDA issued draft guidance for postoperative nausea and vomiting drug development, clarifying expectations for study design and evidence generation in an adjacent antiemetic indication. This type of guidance can shorten regulatory iteration cycles for sponsors building nausea and vomiting portfolios that span perioperative and chemotherapy settings.
CINV Treatment Market Report Scope and Research Methodology
Market Definition and Coverage
This market covers the revenues generated from drug-based treatments used to prevent and manage chemotherapy-induced nausea and vomiting (CINV) across cancer care settings, where use is tied to chemotherapy cycles and related supportive care protocols.
Scope exclusions: It excludes nausea and vomiting management that is not linked to chemotherapy (such as pregnancy-related or general gastroenteritis-related nausea), and it does not count broader oncology drugs that are not used for CINV control.
Segments Covered in This Report
- By Drug Class
- 5-HT3 Receptor Antagonists
- NK1 Receptor Antagonists
- Dopamine Antagonists
- Cannabinoid Antagonists
- Corticosteroids
- Other Classes (Benzodiazepines, Antihistamines)
- By Formulation
- Oral
- Injectable
- Transdermal
- Sublingual
- By End User
- Hospitals
- Oncology & Specialty Clinics
- Homecare Settings & ASCs
- By Geography
- North America
- United States
- Canada
- Mexico
- Europe
- Germany
- United Kingdom
- France
- Italy
- Spain
- Rest of Europe
- Asia-Pacific
- China
- Japan
- India
- Australia
- South Korea
- Rest of Asia-Pacific
- Middle East & Africa
- GCC
- South Africa
- Rest of Middle East & Africa
- South America
- Brazil
- Argentina
- Rest of South America
- North America
Data Sources, Market Sizing, and Validation
Desk Research
For desk work, we first anchor the demand pool using public cancer and chemotherapy context, then we map it to antiemetic guideline use. Typical inputs include sources such as the World Health Organization (cancer burden indicators), the National Cancer Institute (treatment and epidemiology references), the US FDA drug labels and approvals database, and clinical guideline bodies such as NCCN and ASCO for prophylaxis pathways.
To avoid building the model only on clinical narratives, we also review manufacturer annual reports, investor presentations, and reputable press coverage to understand launch timing, mix shifts across drug classes, and price movement patterns by region. Where needed, paid subscriptions for company financials and intelligence, news and financials, and patent databases are used to cross-check product portfolios and timing signals. These examples are not exhaustive, and many other public sources were referred to for data collection, validation, and research clarification.
Primary Interviews and Surveys
Primary work is used to validate how CINV prophylaxis and rescue therapy are used across chemotherapy regimens, and how prescribing varies by care setting and geography. We spoke with a mix of oncology clinicians, hospital and specialty pharmacy stakeholders, and product and market access roles to check adoption, dosing patterns, and realistic price ranges, then reconciled this with desk findings across major regions.
Distribution of primary research fieldwork respondents
| Company type | Respondent position | Region |
|---|---|---|
| Top tier: 29% | CXOs: 16% | APAC: 48% |
| Mid tier: 54% | Functional/Unit leaders: 41% | EMEA: 34% |
| Smaller Players: 17% | Managers: 43% | Americas: 18% |
Market-Sizing & Forecasting
The sizing starts with a top-down build where chemotherapy activity, cancer incidence context, and guideline-aligned prophylaxis intensity are used to reconstruct the treated CINV demand pool by region, then spending is derived using class-level utilization and blended pricing. In practice, the model is shaped around market fingerprints such as the share of highly emetogenic chemotherapy cycles, the typical use of 5-HT3 antagonists, NK1 antagonists, dopamine antagonists, and supportive steroid regimens, and the split of administration forms (oral versus injectable), which changes site-of-care economics.
Once this structure is in place, selective bottom-up checks are run to keep the totals realistic. This includes sampled volume times average selling price logic for key therapy classes, channel checks across hospital and specialty pharmacy purchasing behavior, and supplier revenue cues where disclosures allow it. When a local data point is missing (for example, limited visibility into outpatient mix in a smaller country), we apply proxy assumptions from comparable markets, then adjust them based on what primary respondents confirm about practice patterns.
For forecasting, scenario analysis is used with a base case that reflects expected oncology treatment volumes, likely class mix shifts, and pricing progression assumptions that match typical reimbursement and generic entry timelines. The final trajectory is stress-tested by varying adoption of newer combinations, persistence of breakthrough and delayed CINV management needs, and regional growth differences between mature oncology markets and faster-growing care access regions.
Data Validation & Update Cycle
Validation is done by triangulating the model output against independent signals that should move in the same direction, such as chemotherapy utilization trends, drug class uptake narratives from clinicians, and public regulatory timelines for key therapies. Large variances are flagged, then the assumptions that caused them are revisited, followed by a second-pass review by another analyst before sign-off.
The report is refreshed annually, and interim updates are triggered when there are material events like meaningful guideline changes, major approvals, or sharp pricing resets in large markets. Before delivery, a final pass is completed so the numbers reflect the most recent data and the latest interview-backed assumptions.
Mordor Intelligence's Cinv Treatment Market Size Measured Against Other Published Estimates
Published market values for CINV treatment can look different across sources because the market boundary is not always defined the same way, and the underlying utilization logic is not always explained. Differences tend to show up when estimates mix prophylaxis and rescue use without clarity, or when they treat routes of administration and care settings as interchangeable.
By tracking chemotherapy-linked demand indicators and refreshing class mix and blended pricing inputs with interview checks, Mordor Intelligence keeps the count tied to CINV drug revenues rather than adding adjacent supportive care items that are not consistently used for this condition.
Benchmark comparison
| Source | Market Size | Gaps in Research Methodology |
|---|---|---|
| Mordor Intelligence | USD 5.38 B (2025) | |
| Global Research Publisher A | USD 6.18 B (2025) | A wider scope is implied because non-pharmacological options and broader treatment-type buckets are included, which can lift totals beyond drug-only CINV revenue accounting. |
| Industry Publisher B | USD 6.25 B (2025) | The sizing approach appears to rely on a longer-horizon growth frame with limited clarity on how chemotherapy intensity, regimen risk mix, and price blending are converted into annual spending by region. |
The spread across sources is mainly explained by what gets counted as part of CINV care and how pricing and mix are carried forward year to year. When scope is kept specific to chemotherapy-driven CINV drug demand and the assumptions are checked against real-world practice patterns, the market value becomes easier to trace and repeat for planning.
Key Questions Answered in the Report
What is the current value of the CINV treatment market?
The CINV treatment market size is USD 5.68 billion in 2026 and is forecast to reach USD 7.46 billion by 2031.
Which drug class is expanding fastest?
NK1 receptor antagonists are the fastest-growing class, advancing at a 6.42% CAGR through 2031.
Why are oral formulations gaining popularity?
Oral extended-release formulations support outpatient and home-based chemotherapy models, achieving a 7.08% CAGR as they improve convenience and adherence.
Which region offers the highest growth potential?
Asia-Pacific records the highest regional CAGR at 6.78% owing to regulatory harmonization and rising cancer incidence.
How are patent expiries impacting the market?
Expiring patents for brands such as Sancuso invite generic competition, eroding prices in the short term but encouraging innovators to differentiate through novel delivery technologies.
What role do clinical guidelines play in market expansion?
MASCC-ESMO guidelines standardize triple therapy for moderate and highly emetogenic chemotherapy, driving consistent global uptake of multi-agent antiemetic regimens.