Market Overview
| Study Period | 2017 - 2030 |
|---|---|
| Base Year For Estimation | 2024 |
| Forecast Data Period | 2025 - 2030 |
| Market Size (2025) | USD 114.2 Billion |
| Market Size (2030) | USD 145.3 Billion |
| Growth Rate (2025 - 2030) | 4.95% CAGR |
| Market Concentration | Medium |
Major Players*Disclaimer: Major Players sorted in no particular order Image © Mordor Intelligence. Reuse requires attribution under CC BY 4.0. |
|

Chocolate Market Analysis by Mordor Intelligence
The Chocolate Market size is estimated at 114.2 billion USD in 2025, and is expected to reach 145.3 billion USD by 2030, growing at a CAGR of 4.95% during the forecast period (2025-2030).
The chocolate industry is experiencing significant transformation in its chocolate distribution channels, with supermarkets and hypermarkets maintaining their dominance while online retail gains momentum. Traditional brick-and-mortar retailers leverage their competitive advantage through seasonal offers, bulk purchase discounts, and dedicated chocolate sections that showcase both local and international brands. The emergence of digital commerce has been particularly impactful, with 68% of European consumers aged 16-74 making online purchases in 2022. This shift in consumer behavior has prompted major retailers to develop omnichannel strategies, with companies like ASDA, Tesco, and Sainsbury's expanding their online presence to capture the growing e-commerce market.
Consumer preferences are increasingly gravitating toward premium and sustainable chocolate products, reflecting a broader shift in purchasing patterns. The industry has witnessed a remarkable commitment to sustainability, with over 60% of consumers in 2022 willing to pay more for sustainably produced chocolates. This trend has prompted manufacturers to implement transparent sourcing practices and sustainable production methods, while also introducing innovative packaging solutions to reduce environmental impact. Major chocolate producers are responding by establishing direct relationships with cocoa farmers and implementing fair-trade practices to ensure ethical sourcing.
The industry is witnessing a notable evolution in consumption patterns, particularly in established markets where sophisticated consumer preferences are driving product innovation. Europe stands as a testament to this trend, processing 35% of the world's cacao and accounting for 45% of global chocolate consumption in 2022. Switzerland leads this consumption pattern with an impressive chocolate consumption per capita of 11 kg in 2022, setting benchmarks for premium chocolate consumption globally. This high consumption rate has encouraged manufacturers to expand their premium product lines and experiment with new flavors and formulations.
The chocolate market is experiencing a significant shift in seasonal and occasion-based consumption patterns, particularly in developed markets. The gifting culture continues to drive chocolate sales during major holidays, with Valentine's Day emerging as a crucial sales period notably, 27% of Americans received chocolate as gifts during Valentine's Day in 2022. Manufacturers are capitalizing on these seasonal opportunities by introducing limited-edition products and special packaging designs. The industry has also witnessed a trend toward portion-controlled packaging, with companies introducing more options in package sizes of 200 calories or less during holiday seasons to cater to health-conscious consumers while maintaining the indulgence factor.
Global Chocolate Market Trends and Insights
The rising per capita consumption of chocolates supported by the gifting culture, coupled with growing indulgence in sweets among consumers, increases the demand for chocolates across the globe
- Europe is the leading chocolate-consuming region, followed by North America and Asia-Pacific. Europe processed 35% of the world’s cacao and accounted for 47.67% of world chocolate consumption in 2023. The UK and Switzerland recorded high per capita chocolate consumption of 10.7 kg and 8.9 kg, respectively, as of 2023
- Flavors, texture, and taste are key attributes that influence consumer buying behavior in the global chocolate market. Chocolates with labels such as organic, Fairtrade-certified, and Rainforest Alliance/UTZ-certified are gaining significant traction across European countries. In Asia-Pacific, consumers have a strong preference for textural chocolates, such as crunchy, fruity, and nutty variants.
- Retail prices of chocolates are influenced by the fluctuations in prices of key raw materials, including milk, cocoa beans, cocoa butter, and sugar. Based on economic status, consumers' chocolate choices are categorized as follows: specialty/premium, middle-end, and low-end chocolates constituting 8-10%, 18-20%, and 75-80%, respectively.
- Globally, the consumption of chocolate is generally viewed from a health perspective with a mix of opinions. Chocolate is widely consumed as a popular indulgence, particularly in the form of candy bars, chocolate desserts, and beverages like hot chocolate.
Understand The Key Trends Shaping This Market
Download PDF
OTHER KEY INDUSTRY TRENDS COVERED IN THE REPORT
- Major manufacturers are avoiding the use of artificial flavors, preservatives, or sweeteners to cater to a larger market
Segment Analysis: Confectionery Variant
Milk and White Chocolate Segment in Global Chocolate Market
The milk and white chocolate segment dominates the global chocolate market, commanding approximately 68% of the total market share in 2024. This significant market position is attributed to consumers' strong preference for the sweeter taste profile and smoother texture offered by milk and white chocolates compared to other variants. The segment's dominance is particularly evident in Europe and North America, where consumers show a strong affinity for milk chocolate products. Around 81% of global consumers prefer chocolate to be both tasty and healthy, driving manufacturers to launch products with innovative inclusions like fruits and nuts. Major companies, including Nestlé, Mars, and Cadbury, are responding to this trend by developing milk and white chocolate products with lower calories, reduced sugar content, and ethically sourced cocoa to meet evolving consumer preferences.
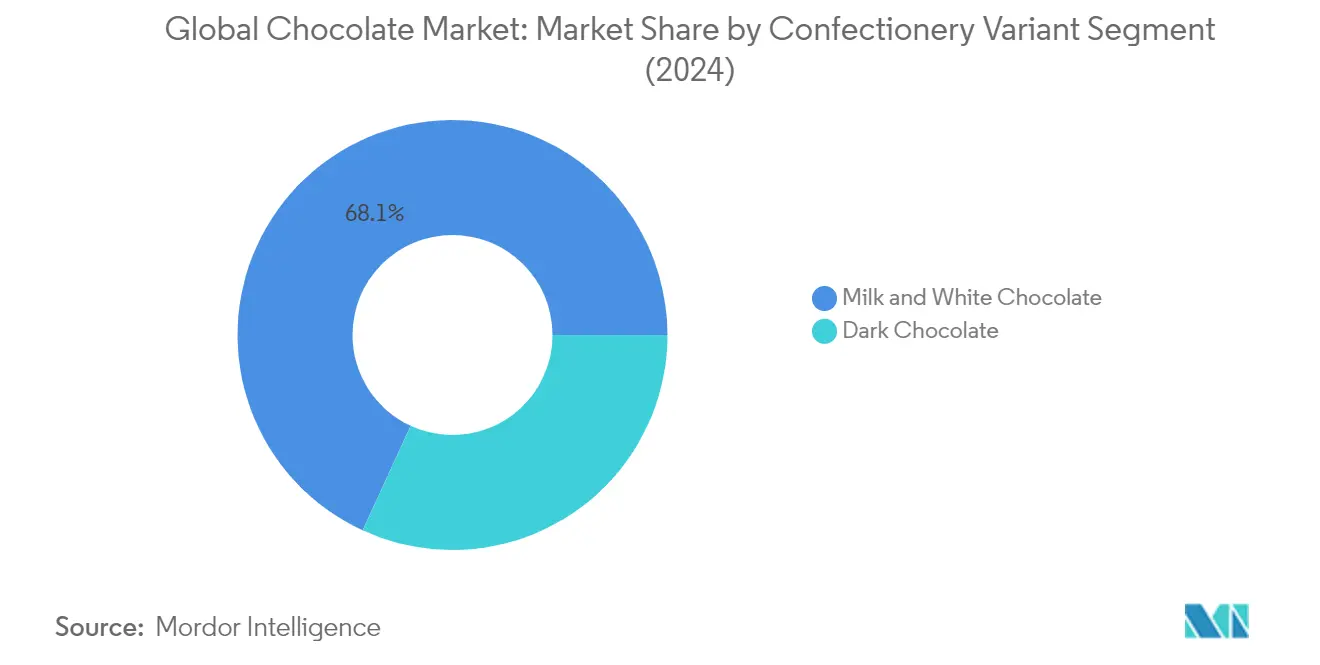
Dark Chocolate Segment in Global Chocolate Market
The dark chocolate segment is experiencing robust growth in the global chocolate market, projected to grow at approximately 5% between 2024 and 2029. This growth is primarily driven by increasing consumer awareness of the health benefits associated with dark chocolate consumption, including improved brain function and reduced risk of heart disease. The segment's expansion is further supported by the rising demand for premium and artisanal dark chocolate products, with manufacturers focusing on product innovations to capture greater market share. Consumer preferences are increasingly shifting toward dark chocolate due to its lower sugar content and higher cocoa concentration, with varieties ranging from 35% to 100% cocoa content. Around 65% of consumers worldwide express interest in healthier chocolate options, particularly those containing macro/micronutrients, driving innovation in functional dark chocolate products that promote proven beneficial nutrients such as vitamins, minerals, fiber, and flavanols.
Segment Analysis: Distribution Channel
Supermarket/Hypermarket Segment in Global Chocolate Market
Supermarkets and hypermarkets continue to dominate the global chocolate retail market, commanding approximately 42% of the market share in 2024. These retail channels maintain their leadership position due to their extensive networks and ability to provide consumers with easy access to a diverse range of chocolate products. The segment's strength is particularly evident in North America and Europe, where supermarkets and hypermarkets have established sophisticated supply chains and dedicated shelf spaces for chocolate products. Strategic product positioning, including the placement of chocolate displays near checkout counters, has proven highly effective in driving impulse purchases. Major supermarket chains like Walmart, Tesco, and Carrefour have significantly contributed to the segment's dominance by offering both international and local chocolate brands, while their bulk purchase discounts and seasonal promotional activities continue to attract price-conscious consumers.
Online Retail Store Segment in Global Chocolate Market
The online retail channel is experiencing remarkable growth in the chocolate distribution market, projected to expand at approximately 6% during 2024-2029. This accelerated growth is primarily driven by the increasing digitalization of retail and changing consumer shopping preferences. E-commerce platforms are revolutionizing chocolate distribution by offering extensive product varieties, competitive pricing, and convenient delivery options. The segment's growth is further supported by the rising number of internet users globally, with about 64.5% of the world's population now having internet access. Online retailers are leveraging advanced digital marketing strategies, personalized recommendations, and subscription-based models to enhance customer engagement. The convenience of comparing prices, reading reviews, and accessing premium international chocolate brands from home has made online retail particularly attractive to younger consumers and urban populations.
Remaining Segments in Distribution Channel
The convenience store and other distribution channels continue to play vital roles in the global chocolate market's ecosystem. Convenience stores serve as crucial points of purchase for impulse buyers and offer accessibility during non-traditional shopping hours, particularly benefiting from their strategic locations in high-traffic areas and transportation hubs. The 'Others' category, which encompasses specialty stores, duty-free shops, vending machines, and direct selling channels, provides unique shopping experiences and caters to specific consumer segments. These channels often focus on premium and artisanal chocolate products, creating distinct value propositions through personalized service and exclusive product offerings. Both segments contribute to the market's diversity by serving different consumer needs and shopping occasions, complementing the broader distribution network.
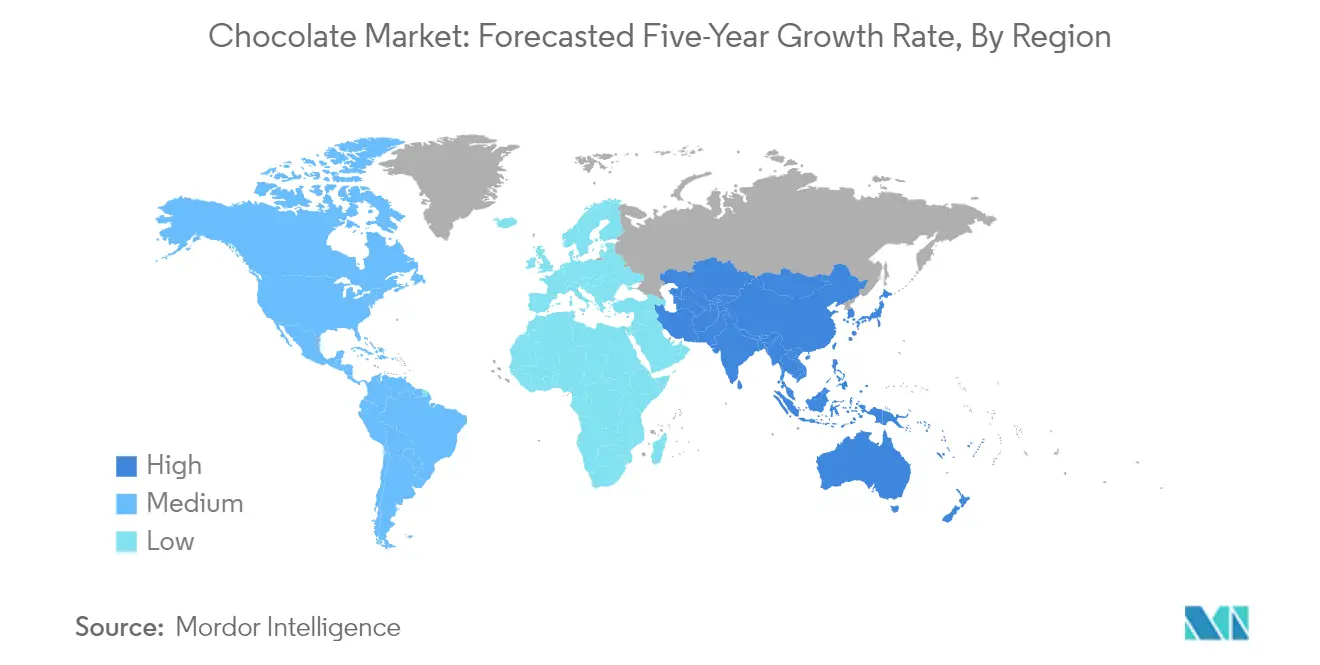
Chocolate Market Geography Segment Analysis
Chocolate Market in Africa
The African chocolate market size by country demonstrates significant growth potential driven by evolving consumer preferences and increasing awareness about premium chocolate products. Egypt, Nigeria, and South Africa represent the key markets in the region, each with distinct consumption patterns and market dynamics. The region shows particular strength in cocoa production, with several countries being major global suppliers of cocoa beans, though domestic chocolate consumption patterns vary significantly across different markets.
Chocolate Market in Egypt
Egypt stands as the largest chocolate market in Africa, commanding approximately 45% of the region's chocolate market share in 2024. The country's chocolate industry benefits from a well-established distribution network and a growing consumer appetite for cocoa-based products. The market is characterized by a strong presence of both international and local brands, with retailers offering various chocolate products across different price points. Consumer preferences in Egypt show a distinct pattern, with milk chocolate being particularly popular as 52% of Egyptians prefer milk chocolate while 13% prefer white chocolate.
Chocolate Market Growth in Egypt
Egypt is also experiencing the fastest growth in the African region, with an expected growth rate of approximately 7% between 2024-2029. This growth is driven by increasing urbanization and rising disposable incomes, particularly among the younger population. The country's chocolate market is witnessing a significant shift toward premium and healthier options, with dark chocolate emerging as a particularly strong segment. The expansion is further supported by the country's robust tourism industry, which contributes significantly to chocolate consumption, especially during peak tourist seasons.
Chocolate Market in Australia
The chocolate market in Australia is characterized by a diverse range of products catering to various consumer preferences. With a strong emphasis on quality and innovation, Australian chocolate brands are gaining traction both domestically and internationally. The market is supported by a robust supply chain and a growing trend towards sustainable and ethically sourced cocoa.
Chocolate Market in Pakistan
The chocolate market in Pakistan is witnessing a steady growth trajectory, driven by increasing consumer awareness and demand for premium chocolate products. The market is characterized by a mix of local and international brands, with a focus on expanding distribution networks and enhancing product offerings to cater to diverse consumer tastes.
Thailand Chocolate Market
The Thailand chocolate market is evolving rapidly, with a growing consumer base that is increasingly inclined towards premium and innovative chocolate products. The market dynamics are influenced by changing consumer lifestyles and a rising preference for healthier chocolate options, which are driving the demand for dark and organic chocolates.
Kuwait Chocolate Brands
Kuwait chocolate brands are gaining prominence in the Middle East, with a focus on quality and unique flavor profiles. The market is supported by a strong retail infrastructure and a growing consumer interest in premium chocolate offerings. Kuwaiti brands are increasingly exploring export opportunities to expand their reach beyond the domestic market.
Global Chocolate Market
The global chocolate market is poised for substantial growth, driven by increasing demand for premium and innovative chocolate products across various regions. The market is characterized by a diverse range of offerings, from traditional milk chocolates to artisanal and specialty products. Key trends influencing the market include the rise of ethical and sustainable sourcing practices, as well as the growing popularity of healthier chocolate options.
Chocolate Market Statistics
Comprehensive chocolate market statistics reveal a dynamic and rapidly evolving industry, with significant variations in consumption patterns and preferences across different regions. The data highlights key trends such as the increasing demand for premium products, the shift towards healthier options, and the impact of economic factors on consumer behavior.
Get Analysis on Important Geographic Markets
Download PDF
Competitive Landscape
Top Companies in Chocolate Market
The global chocolate market is characterized by intense competition and continuous innovation among chocolate companies such as Mars Incorporated, Mondelez International, Ferrero Group, Nestlé, and Hershey Company. These largest chocolate companies are heavily investing in product innovations, particularly in premium, organic, and health-conscious offerings, with a growing focus on plant-based and sugar-free alternatives. Operational agility is demonstrated through the modernization of manufacturing facilities and the adoption of sustainable practices, especially in cocoa sourcing and packaging. Strategic partnerships with technology companies, cocoa farmers, and sustainability organizations have become increasingly common to ensure supply chain transparency and product quality. Geographic expansion remains a key focus, with chocolate industry companies establishing new production facilities in emerging markets and acquiring local brands to strengthen their regional presence. The industry has witnessed significant investment in direct-to-consumer channels and digital platforms to enhance customer engagement and distribution efficiency.
Consolidated Market with Strong Regional Players
The chocolate market exhibits a high level of consolidation at the global level, dominated by multinational conglomerates with diverse product portfolios and extensive distribution networks. These major players leverage their established brand equity, research capabilities, and economies of scale to maintain their market positions. Regional specialists, particularly in Europe and Asia, maintain a strong local presence through premium and artisanal offerings that cater to specific consumer preferences. The market structure is characterized by a mix of global giants and specialized local manufacturers, with the latter often focusing on premium segments and unique flavor profiles.
The industry has witnessed significant merger and acquisition activity, primarily driven by large companies acquiring smaller, innovative brands to expand their product portfolios and geographical reach. Vertical integration strategies are increasingly common, with companies acquiring cocoa processing facilities and distribution networks to strengthen their supply chain control. Local chocolate manufacturers, especially in emerging markets, are becoming attractive acquisition targets for global players seeking to penetrate new markets and acquire local expertise. The trend of consolidation is expected to continue as companies seek to achieve operational efficiencies and expand their market presence.
Innovation and Sustainability Drive Future Growth
For incumbent players to maintain and increase their market share, a focus on product innovation, particularly in health-conscious and premium segments, remains crucial. Companies need to invest in sustainable sourcing practices, transparent supply chains, and eco-friendly packaging to meet growing consumer demands for responsible production. Digital transformation, including e-commerce capabilities and direct-to-consumer channels, will be essential for maintaining a competitive advantage. Building strong relationships with cocoa farmers and investing in local communities will become increasingly important for securing high-quality raw materials and maintaining brand reputation.
New entrants and smaller players can gain ground by focusing on niche markets, such as organic, single-origin, or functional chocolates. Success factors include developing unique flavor profiles, leveraging local ingredients, and creating compelling brand stories that resonate with conscious consumers. The risk of substitution from alternative snacks and confectionery products remains moderate, though chocolate's unique characteristics and cultural significance provide some protection. Regulatory changes, particularly regarding sugar content, labeling requirements, and sustainability standards, will continue to shape the competitive landscape, potentially creating opportunities for innovative companies while challenging others to adapt their formulations and practices. The market share of chocolate manufacturers is influenced by these factors, with chocolate competitors needing to adapt swiftly to maintain their positions.
Chocolate Industry Leaders
-
Ferrero International SA
-
Mars Incorporated
-
Mondelēz International Inc.
-
Nestlé SA
-
The Hershey Company
- *Disclaimer: Major Players sorted in no particular order

Need More Details on Market Players and Competitors?
Download PDF
Recent Industry Developments
- August 2023: Lotte Corporation partnered with DLT Labs to promote sustainability and ethical practices in the cacao bean supply chain. Lotte is commencing its pilot project on the traceability of cacao beans from Ghana and child labor monitoring using blockchain technology.
- July 2023: Ferrero's sister company, Ferrara Candy Co., announced the acquisition of Brazilian snacks company Dori Alimentos, which sells a variety of chocolate and sugar confectionery brands, including Dori, Pettiz, and Jubes.
- February 2023: The Hershey Company launched limited-edition chocolate bars to honor the celebration of International Women’s Day.
Global Chocolate Market Report Scope
Dark Chocolate, Milk and White Chocolate are covered as segments by Confectionery Variant. Convenience Store, Online Retail Store, Supermarket/Hypermarket, Others are covered as segments by Distribution Channel. Africa, Asia-Pacific, Europe, Middle East, North America, South America are covered as segments by Region.
Confectionery Variant
| Dark Chocolate |
| Milk and White Chocolate |
Distribution Channel
| Convenience Store |
| Online Retail Store |
| Supermarket/Hypermarket |
| Others |
Region
| Africa | By Country | Egypt |
| Nigeria | ||
| South Africa | ||
| Rest of Africa | ||
| Asia-Pacific | By Country | Australia |
| China | ||
| India | ||
| Indonesia | ||
| Japan | ||
| Malaysia | ||
| New Zealand | ||
| South Korea | ||
| Rest of Asia-Pacific | ||
| Europe | By Country | Belgium |
| France | ||
| Germany | ||
| Italy | ||
| Netherlands | ||
| Russia | ||
| Spain | ||
| Switzerland | ||
| Turkey | ||
| United Kingdom | ||
| Rest of Europe | ||
| Middle East | By Country | Bahrain |
| Kuwait | ||
| Oman | ||
| Qatar | ||
| Saudi Arabia | ||
| United Arab Emirates | ||
| Rest of Middle East | ||
| North America | By Country | Canada |
| Mexico | ||
| United States | ||
| Rest of North America | ||
| South America | By Country | Argentina |
| Brazil | ||
| Rest of South America |
| Confectionery Variant | Dark Chocolate | ||
| Milk and White Chocolate | |||
| Distribution Channel | Convenience Store | ||
| Online Retail Store | |||
| Supermarket/Hypermarket | |||
| Others | |||
| Region | Africa | By Country | Egypt |
| Nigeria | |||
| South Africa | |||
| Rest of Africa | |||
| Asia-Pacific | By Country | Australia | |
| China | |||
| India | |||
| Indonesia | |||
| Japan | |||
| Malaysia | |||
| New Zealand | |||
| South Korea | |||
| Rest of Asia-Pacific | |||
| Europe | By Country | Belgium | |
| France | |||
| Germany | |||
| Italy | |||
| Netherlands | |||
| Russia | |||
| Spain | |||
| Switzerland | |||
| Turkey | |||
| United Kingdom | |||
| Rest of Europe | |||
| Middle East | By Country | Bahrain | |
| Kuwait | |||
| Oman | |||
| Qatar | |||
| Saudi Arabia | |||
| United Arab Emirates | |||
| Rest of Middle East | |||
| North America | By Country | Canada | |
| Mexico | |||
| United States | |||
| Rest of North America | |||
| South America | By Country | Argentina | |
| Brazil | |||
| Rest of South America | |||
Need A Different Region or Segment?
Customize Now
Market Definition
- Milk and White Chocolate - Milk chocolates is a solid chocolate made with milk (in the form of either milk powder, liquid milk, or condensed milk) and cocoa solids. White chocolate is made from cocoa butter and milk and contains no cocoa solids whatsoever. The scope includes regular chocolates, low-sugar, and sugar-free variants
- Toffees & Nougats - Toffees include hard, chewy, and small or one-bite candies marketed with labels as toffee or toffee-like confectionery. Nougat is a chewy confection with almond, sugar, and egg white as a basic ingredient; and it originated in Europe and Middle East countries.
- Cereals Bars - A snack composed of breakfast cereal that has been compressed into a bar shape and is held together with a form of edible adhesive. The scope includes snack bars made with cereals such as rice, oats, corn, etc. mixed with a binding syrup. These also include products labeled as cereal bars, cereal treat bars, or grain bars.
- Chewing Gum - This is a preparation for chewing, usually made of flavored and sweetened chicle or such substitutes as polyvinyl acetate. The types of chewing gums included in the scope are sugar-chewing gums and sugar-free chewing gums
| Keyword | Definition |
|---|---|
| Dark Chocolate | Dark chocolate is a form of chocolate containing cocoa solids and cocoa butter without the milk. |
| White Chocolate | White chocolate is the type of chocolate containing the highest percentage of milk solids, typically around or over 30 percent. |
| Milk Chocolate | Milk chocolate is made from dark chocolate that has a low cocoa solid content and higher sugar content, plus a milk product. |
| Hard Candy | A candy made of sugar and corn syrup boiled without crystallizing. |
| Toffees | A hard, chewy, often brown sweet that is made from sugar boiled with butter. |
| Nougats | A chewy or brittle candy containing almonds or other nuts and sometimes fruit. |
| Cereal bar | A cereal bar is a bar-shaped food product, made by pressing cereals and usually dried fruit or berries, which are in most cases held together by glucose syrup. |
| Protein bar | Protein bars are nutrition bars that contain a high proportion of protein to carbohydrates/fats. |
| Fruit & Nut bar | These are often based on dates with other dried fruit and nut additions and, in some cases, flavorings. |
| NCA | The National Confectioners Association is an American trade organization that promotes chocolate, candy, gum and mints, and the companies that make these treats. |
| CGMP | Current good manufacturing practices are those conforming to the guidelines recommended by relevant agencies. |
| Unstandardized foods | Unstandardized foods are those that do not have a standard of identity or that deviate from a prescribed standard in any manner. |
| GI | The glycemic index (GI) is a way of ranking carbohydrate-containing foods based on how slowly or quickly they are digested and increase blood glucose levels over a period of time |
| Skimmed milk powder | Skimmed milk powder is obtained by removing water from pasteurized skim milk by spray-drying. |
| Flavanols | Flavanols are a group of compounds found in cocoa, tea, apples, and many other plant-based foods and beverages. |
| WPC | Whey protein concentrate- the substance obtained by the removal of sufficient nonprotein constituents from pasteurized whey so that the finished dry product contains greater than 25% protein. |
| LDL | Low density Lipoprotein- the bad cholesterol |
| HDL | High density Lipoprotein- the good cholesterol |
| BHT | butylated Hydroxytoluene is a lab-made chemical that is added to foods as a preservative. |
| Carrageenan | Carrageenan is an additive used to thicken, emulsify, and preserve foods and drinks. |
| Free form | Not containing certain ingredients, such as gluten, dairy, or sugar. |
| Cocoa butter | It is a fatty substance obtained from cocoa beans, used in the manufacture of confectionery. |
| Pastellies | A type of of Brazilian candy made from sugar, eggs, and milk. |
| Draggees | Small, round candies that are coated with a hard sugar shell |
| CHOPRABISCO | Royal Belgian Association of the chocolate, pralines, biscuit, and confectionery industry- A trade association that represents the Belgian chocolate industry. |
| European Directive 2000/13 | A European Union directive that regulates the labeling of food products |
| Kakao-Verordnung | The German chocolate ordinance, a set of regulations that define what can be labeled as "chocolate" in Germany. |
| FASFC | Federal Agency for the Safety of the Food Chain |
| Pectin | A natural substance that is derived from fruits and vegetables. It is used in confectionery to create a gel-like texture. |
| Invert sugars | A type of sugar that is made up of glucose and fructose. |
| Emulsifier | A substance that helps to mix to liquids that does not mix together. |
| Anthocyanins | A type of flavonoid that is responsible for the red, purple, and blue colors of confectionery. |
| Functional Foods | Foods that have been modified to provide additional health benefits beyond basic nutrition. |
| Kosher certificate | This certification verifies that the ingredients, production process including all machinery, and/or food-service process complies with the standards of Jewish dietary law |
| Chicory root extract | A natural extract from the chicory root that is a good source of fiber, calcium, phosphorous, and folate |
| RDD | Recommended daily dose |
| Gummies | A chewy gelatin-based candy that is often flavored with fruit. |
| Nutraceuticals | Food or dietary supplements that are claimed to have health benefits. |
| Energy bars | Snack bars that are high in carbohydrates and calories are designed to provide energy on the go. |
| BFSO | Belgian Food Safety Organization for the food chain. |
Need More Details on Market Definition?
Ask a Question
Research Methodology
Mordor Intelligence follows a four-step methodology in all our reports.
- Step-1: Identify Key Variables: In order to build a robust forecasting methodology, the variables and factors identified in Step 1 are tested against available historical market numbers. Through an iterative process, the variables required for market forecast are set, and the model is built on the basis of these variables.
- Step-2: Build a Market Model: Market-size estimations for the forecast years are in nominal terms. Inflation is not a part of the pricing, and the average selling price (ASP) is kept constant throughout the forecast period for each country.
- Step-3: Validate and Finalize: In this important step, all market numbers, variables, and analyst calls are validated through an extensive network of primary research experts from the market studied. The respondents are selected across levels and functions to generate a holistic picture of the market studied.
- Step-4: Research Outputs: Syndicated Reports, Custom Consulting Assignments, Databases & Subscription Platforms

Get More Details On Research Methodology
Download PDF


