
Chlor-alkali Market Size and Share
Market Overview
| Study Period | 2021 - 2031 |
|---|---|
| Market Volume (2026) | 295.70 Million tons |
| Market Volume (2031) | 344.63 Million tons |
| Growth Rate (2026 - 2031) | 3.11 % |
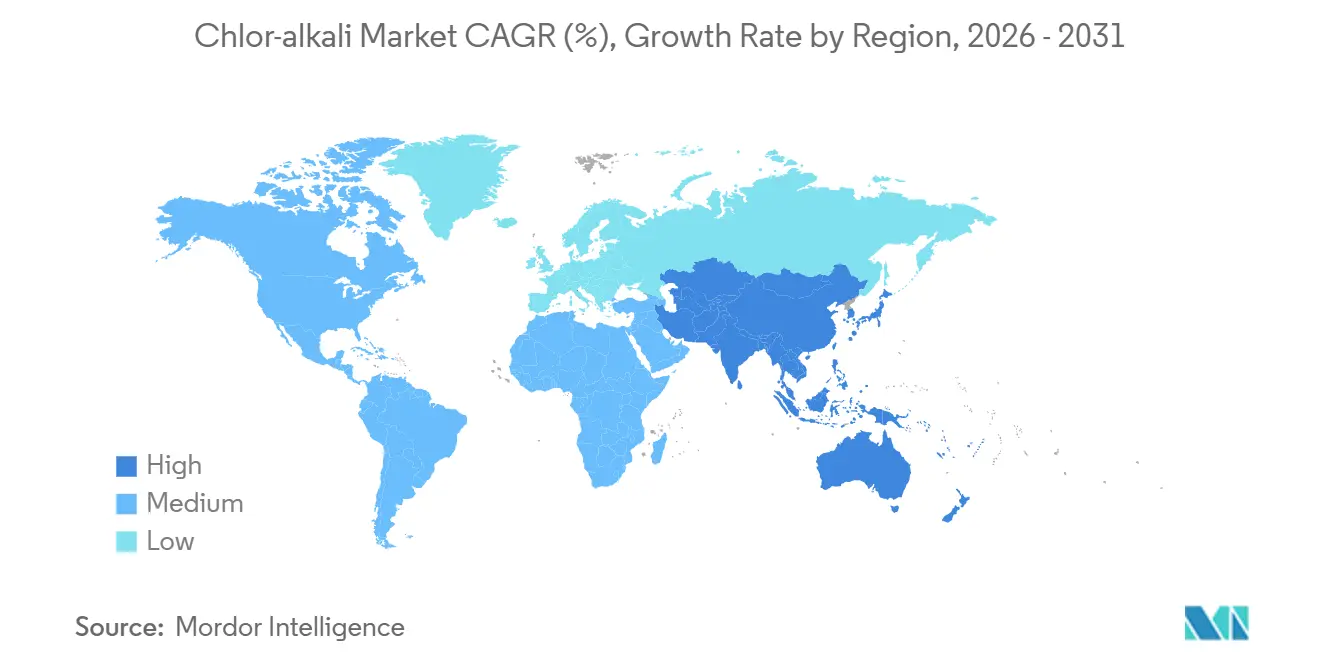
| Fastest Growing Market | Asia Pacific |
| Largest Market | Asia Pacific |
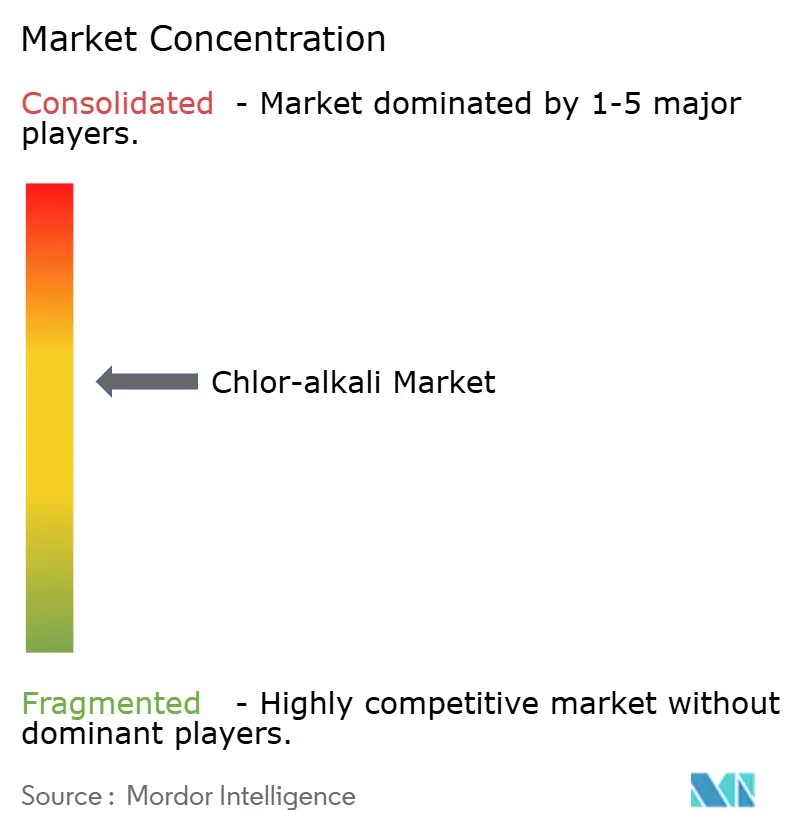
| Market Concentration | Medium |
Major Players *Disclaimer: Major Players sorted in no particular order Image © Mordor Intelligence. Reuse requires attribution under CC BY 4.0. | |
Chlor-alkali Market Analysis by Mordor Intelligence
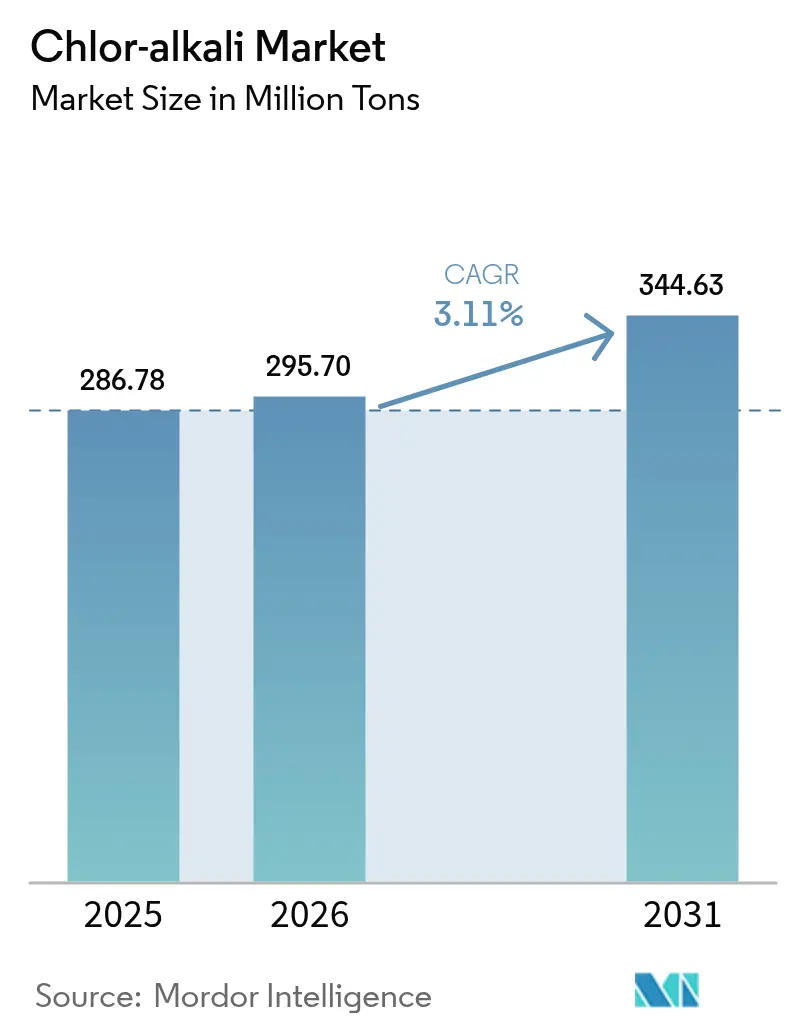
The Chlor-alkali Market size is expected to increase from 286.78 Million tons in 2025 to 295.70 Million tons in 2026 and reach 344.63 Million tons by 2031, growing at a CAGR of 3.11% over 2026-2031. End-use pull from vinyls, alumina, and water infrastructure is altering trade flows, tightening regional balances, and lifting average operating rates above 82%. Membrane-cell conversions in North America and Europe are lowering power intensity to below 2,000 kWh per ton of caustic, trimming Scope 2 emissions and unlocking hydrogen by-product revenue. Asia’s capacity additions have shifted 2 million tons of net chlorine demand eastward since 2024, while alumina refineries in Australia and China are front-loading long-term caustic offtake contracts to hedge against energy-price volatility. Zero-liquid-discharge rules and carbon pricing in the European Union are driving early retirement of small diaphragm and mercury units, accelerating capacity migration toward the Middle East where feedstock gas costs sit under USD 2 per MMBtu.
Key Report Takeaways
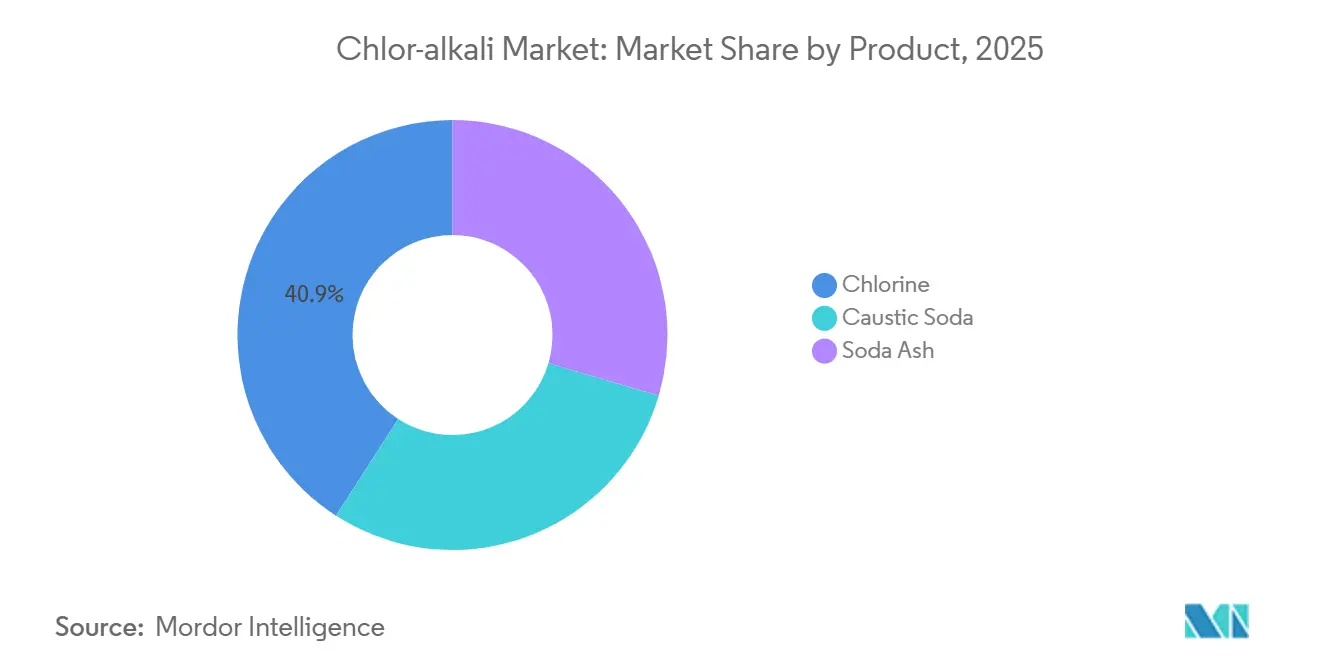
- By product, chlorine held 40.89% of the chlor-alkali market share in 2025 and is expanding at a 3.37% CAGR through 2031.
- By production process, membrane cell technology commanded 62.78% of the chlor-alkali market size in 2025 and is projected to grow at a 3.31% CAGR by 2031.
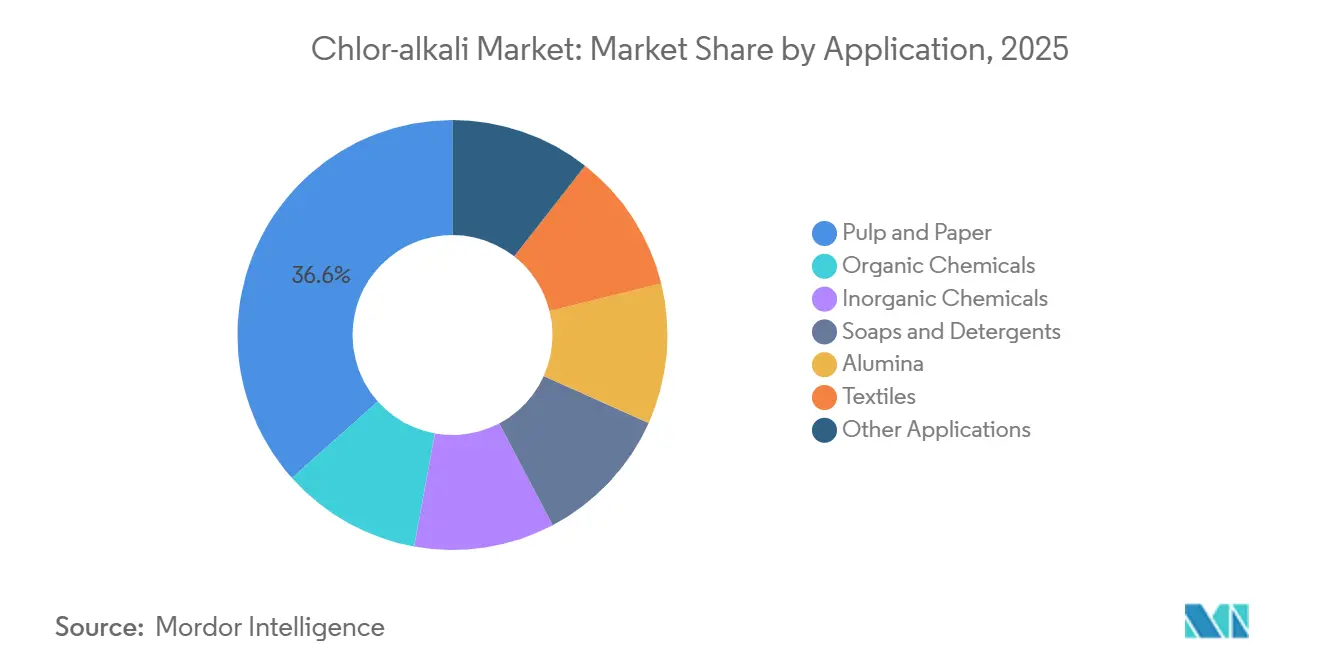
- By application, pulp and paper accounted for 36.58% of the chlor-alkali market size in 2025 and is advancing at a 3.22% CAGR to 2031.
- By geography, Asia-Pacific captured 62.22% chlor-alkali market share in 2025 and is pacing ahead with a 3.23% CAGR through 2031.
Note: Market size and forecast figures in this report are generated using Mordor Intelligence’s proprietary estimation framework, updated with the latest available data and insights as of 2026.
Market Trends and Insights
Drivers Impact Analysis of Chlor-alkali Market*
| Driver | (~) % Impact on CAGR Forecast | Geographic Relevance | Impact Timeline |
|---|---|---|---|
| Surging PVC capacity additions in Asia | +0.9% | China, India, Southeast Asia | Medium term (2-4 years) |
| Rising alumina output for EV-grade aluminium | +0.6% | China, Australia, India | Long term (≥ 4 years) |
| Booming water and wastewater projects | +0.5% | North America, Europe, India | Medium term (2-4 years) |
| Capacity-linked renewable-power incentives | +0.4% | Australia, European Union, select U.S. states | Long term (≥ 4 years) |
| Local hydrogen valorisation at membrane sites | +0.3% | Europe, Australia, Japan, South Korea | Long term (≥ 4 years) |
| Source: Mordor Intelligence | |||
Surging PVC Capacity Additions in Asia
China commissioned 1.9 million tons of PVC in 2025, lifting Q4 output to 6.54 million tons and absorbing roughly 3.8 million tons of chlorine, while India’s 2.8 million-ton structural PVC deficit is prompting 1.5 million tons of new capacity at Dahej and Cuddalore. Each ton of PVC fixes 0.58 tons of chlorine, anchoring plant load factors even when caustic prices soften. Coastal clustering in China and Gujarat lowers inbound salt and outbound caustic logistics, letting producers arbitrage surplus caustic into Australia during monsoon-season outages. Southeast Asian joint ventures are adding another 1 million tons of PVC by 2027, sustaining regional chlorine tightness. The investment wave is also triggering rapid membrane retrofits to achieve the high-purity caustic grades alumina refiners require[1].
Rising Alumina Output for EV-Grade Aluminium
The Bayer process needs 0.08-0.12 tons of caustic per ton of alumina. IRENA projects 4-6 million tons of incremental alumina demand for EV casings by 2030, equal to 400,000-600,000 tons of extra caustic[2]. Rio Tinto’s 8.3 million-ton refining network is negotiating embedded-carbon clauses with membrane-cell suppliers to cut logistics miles by 30%. The European Commission’s decarbonisation pathway for aluminium privileges low-carbon caustic, enabling premium supply contracts for producers using renewable PPAs. Sodium-ion battery cathodes, an emerging storage option, also rely on caustic in precursor synthesis, cushioning demand against cyclicality.
Booming Water and Wastewater Treatment Projects
The US EPA ordered Jackson, Mississippi, to switch from bulk chlorine to on-site hypochlorite by August 2027, creating a USD 45 million equipment opportunity despite trimming 12,000 tons of merchant chlorine demand. India’s Jal Jeevan Mission has lifted rural piped-water coverage to 85%, underpinning steady chlorine consumption for residual disinfection. Desalination capacity in the Middle East reached 95 million m³ per day in 2025 and is rising 8% annually, with each plant dosing chlorine for biofouling protection. Electro-chlorination improves safety and trims insurance costs by 35%, but chlorine remains dominant where residual protection is mandated.
Capacity-Linked Renewable-Energy Incentives
Australia’s Hydrogen Production Tax Incentive pays AUD 2 per kg of qualifying hydrogen; a chlor-alkali plant co-producing 0.028 tons of hydrogen per ton of caustic captures USD 36-40 per ton of extra revenue. The U.S. chlor-alkali fleet already vents 0.7 million tons of hydrogen, 10% of national consumption, so valorisation can shave 8-12% off caustic cash costs. EU RED III lets chlor-alkali hydrogen count toward RFNBO quotas when powered by low-carbon electricity, spurring Nordic producers to sign wind PPAs at sub-EUR 40 per MWh.
Restraints Impact Analysis of Chlor-alkali Market*
| Restraint | (~) % Impact on CAGR Forecast | Geographic Relevance | Impact Timeline |
|---|---|---|---|
| Stringent carbon-footprint regulations | -0.5% | Europe, North America, China | Medium term (2-4 years) |
| Brine-disposal compliance costs | -0.3% | United States, Europe, India (coastal) | Short term (≤ 2 years) |
| Uptake of electro-chlorination & ClO₂ | -0.4% | North America, Europe | Medium term (2-4 years) |
| Source: Mordor Intelligence | |||
Stringent Carbon-Footprint Regulations on the Value Chain
EU ETS allowances averaged EUR 72 per ton in 2025; a membrane plant using coal-based power emits 0.9 tons CO₂ per ton of caustic, implying a EUR 65 cost penalty. The Carbon Border Adjustment Mechanism, in its reporting phase since 2026, adds compliance overhead for importers of chlor-alkali derivatives. China folded chemicals into its national ETS in 2024, benchmarking 2,200 kWh t⁻¹ for membrane cells, which is forcing high-energy Xinjiang units offline. The US facilities must now file process-emission inventories under EPA’s Greenhouse Gas Reporting Program.
Brine-Disposal Compliance Costs
Zero-liquid-discharge rules in California, Florida, and Gujarat mandate evaporators and RO units that cost USD 15-25 million per site and add USD 10/t to opex. Olin budgeted USD 42 million in 2024 for brine systems at Charleston and McIntosh. Diaphragm plants generate 1.4 m³ effluent per ton of caustic versus 0.4 m³ for membrane units, magnifying retrofit paybacks even before factoring in the EPA asbestos ban.
*Our forecasts treat driver/restraint impacts as directional, not additive. The impact forecasts reflect baseline growth, mix effects, and variable interactions.
Chlor-alkali Market Segment Analysis
By Product:
Chlorine Sustains Margin LeadershipChlorine captured 40.89% of 2025 volume, anchoring 60% of integrated revenue as average realized prices stayed 15% above caustic. The chlor-alkali market size for chlorine is forecast to advance at a 3.37% CAGR as PVC, propylene oxide, and chlorinated solvents scale in Asia. Soda ash remains the smallest pool, exposed to synthetic competition in detergents but protected in flat glass where trona economics hold. Thyssenkrupp membranes deliver a 0.88:1 chlorine-to-caustic ratio, letting producers tailor output to regional pricing. HPPO technology could displace 0.3 tons of chlorine per ton of PO if installed capacity tops 3 million tons, a scenario industry planners view as post-2030. Integrated complexes at Point Comfort and Mailiao internalize full chlorine streams, insulating earnings from merchant-market swings.
Caustic soda underpins alumina refining, textiles, and pulp bleaching. Rio Tinto alone consumed 800,000 tons in 2024, and battery-grade aluminium growth signals a durable pull. However, detergent formulators continue shifting to enzyme-rich, low-alkali concentrates, trimming per-wash caustic intensity by 25%. Natural soda-ash mines in Wyoming and Turkey keep costs below synthetic routes, capping soda-ash substitution risk for glass customers.

By Production Process:
Membrane Technology Dominates Post-Asbestos BanMembrane cells represented 62.78% of 2025 output and expand at a 3.31% CAGR as the the US EPA bans asbestos diaphragms by August 2026. Membrane upgrades cut power draw to 1,950 kWh/t and boost caustic purity to 50%, unlocking semiconductor and pharma niches priced at USD 600-800/t. The chlor-alkali market share for diaphragm technology is poised to fall below 5% by 2031. Mercury cells exit entirely under the Minamata Convention’s 2025 deadline. Retrofit economics are compelling: Westlake’s 2024 Calvert City project recycles 95% of brine, slashes freshwater intake, and meets tightened chloride limits, all while raising capacity 12%. High-current-density designs shrink cell footprints by 30%, letting greenfield plants in the Middle East break even below USD 300/t FOB.
Hydrogen valorisation is another upside. Pure-stream hydrogen at 99.9% enables sales into ammonia or mobility markets at sub-USD 2/kg when renewable power runs below USD 40/MWh, improving internal rates of return by 3-4 percentage points.
By Application:
Pulp & Paper Anchors Demand ProfilePulp and paper consumed 36.58% of chlor-alkali volume in 2025 and is tracking a 3.22% CAGR. Elemental-chlorine-free bleaching still needs chlorine dioxide precursors plus caustic for kraft pulping. Brazilian and Indonesian mills expanded hardwood capacity by 3 million tons between 2024 and 2026, underpinning caustic off-take contracts with ISO 14067 clauses. Organic chemicals, led by PVC, represent the fastest absolute growth, pulling 0.58 tons of chlorine per ton of resin. Inorganic chains such as TiO₂ and sodium hypochlorite show steadier, low-single-digit growth yet pay premiums for 32% diaphragm-grade caustic.
Alumina refining, at 0.08-0.12 t caustic/t alumina, links chlor-alkali fortunes to EV battery rollout. Textiles remain a sizable outlet in South Asia but face water-recycling mandates that curb unit consumption. Food, pharma, and niche electronic-chemicals together form a 12-15% slice distinguished by high-purity premiums that cushion cyclical dips.
Geography Analysis
APAC Chlor-alkali Market
Asia-Pacific led the chlor-alkali market with 62.22% of global tonnage in 2025, propelled by China’s coastal PVC expansions and India’s persisting caustic deficit. The region’s chlor-alkali market size is forecast to chart a 3.23% CAGR through 2031 as integrated complexes secure brine and renewable power. Tata Chemicals is retrofitting 200,000 tons of membrane capacity at Mithapur, slicing energy costs by USD 38/t and positioning for exports into Australia. Japanese producers are pivoting to 99.5% purity grades for semiconductors, fetching USD 750/t ex-works. South Korean additions at Yeosu will feed in-house PVC and propylene oxide, capturing co-product credits.
North America Chlor-alkali Market
In North America, diaphragm conversions and electro-chlorination substitution in water treatment offset demand upside from alumina refining. Olin’s Freeport and McIntosh upgrades add 8% capacity while trimming 50 kWh/t of electricity per ton. Occidental’s OxyChem unit intends to liquefy by-product hydrogen for Gulf refineries, targeting a USD 25/t uplift in caustic economics.
EMEA and Turkey Chlor-alkali Market
Europe battles the cost drag of EUR 35-40/MWh gas and EUR 65/t carbon. Covestro sources 60% renewable power at Dormagen, dropping carbon intensity below 0.5 t CO₂/t caustic and qualifying for green-premium contracts.INEOS is piloting hydrogen co-location with methanol at Rafnes to lift returns 10-15%. Turkey leverages low-cost trona and gas to ship soda ash and caustic into MENA.
MEA Chlor-alkali Market
In the Middle East and Africa, natural-gas-based power under USD 0.04/kWh and downstream PVC, alumina, and desalination investments make the basin a structural exporter to Europe and Asia. SABIC’s new Jubail membrane unit will tap wind-PPA blocks, cutting life-cycle CO₂ by 40%.
South America Chlor-alkali Market
South America's market share is dominated by Brazilian PVC chains that enjoy captive eucalyptus feedstock for pulp bleach demand. Braskem’s Bahia expansion synchronizes chlorine, caustic, and vinyls, allowing net-back optimisation across three revenue streams.
Regulatory Landscape
Regulation is accelerating the shift away from mercury and asbestos-based diaphragm operations. Under the Minamata Convention on Mercury, mercury use in chlor-alkali production reached its phase-out date on January 1, 2025, reinforcing global retirement or conversion of mercury-cell capacity. In the United States, EPA rules under 40 CFR 751.505 prohibit the manufacture (including import) of chrysotile asbestos for chlor-alkali diaphragms as of May 28, 2024, pushing remaining diaphragm assets toward membrane conversions and associated capital programs.
In Europe, compliance burdens increasingly combine industrial permitting, carbon cost, and strategic supply security requirements. The European Commission published an Action Plan for the chemicals industry in July 2025, including initiatives to map critical molecules and to establish EU Critical Chemicals Sites by 2026, with the Council signaling a potential legislative proposal on critical molecules in 2026. Separately, EU carbon policy and reporting requirements, including the Carbon Border Adjustment Mechanism reporting phase since 2026 for certain product chains, add documentation and working-capital friction that tends to favor low-carbon, traceable supply and integrated offtake structures.
Value Chain Analysis
The chlor-alkali value chain starts with salt (brine), water, and electricity as the core inputs to electrolysis, producing chlorine, caustic soda, and hydrogen as co-products. Electricity is the largest controllable cost lever, shaping plant siting and technology choices, while environmental controls for brine purification and effluent management influence both capex and operating costs. Technology providers such as thyssenkrupp nucera and Asahi Kasei supply membrane electrolyzer systems that support higher-purity caustic, lower power intensity, and improved compliance positioning versus older diaphragm or mercury routes.
Downstream integration and logistics drive monetization. Chlorine is commonly consumed captively in vinyls (EDC/PVC) or other derivatives, while caustic soda supports alumina, pulp and paper, inorganic chemicals, and water-treatment chains. Recent capacity actions show how projects pull through equipment vendors, utilities, and derivative units: AGC Vinythai commissioned an expanded chlor-alkali plant at Map Ta Phut, Thailand (220,000 tpy caustic capacity) using thyssenkrupp nucera e-BiTAC v7 electrolyzers, and Bondalti Chemicals started operation of a modernized chlor-alkali facility in Estarreja, Portugal, using Asahi Kasei electrolysis technology. In Indonesia, Chandra Asri Group advanced a chlor-alkali and EDC complex in Cilegon with external funding support, reflecting the role of integrated vinyl demand and import-substitution objectives in shaping new-build pipelines.
Competitive Landscape
The Chlor-alkali market is moderately concentrated. Integrated strategies dominate. Formosa’s Point Comfort complex internalises 100% of chlorine into captive PVC, buffering margin swings. Dow leverages in-house ethylene and electricity cogeneration to trim cash costs by 12%. Occidental is monetising hydrogen into blue ammonia under long-term Gulf Coast contracts, adding USD 20/t to caustic value. Regulation is catalyzing consolidation. The EPA asbestos ban forces USD 150-200 million of retrofit spend on eight US diaphragm sites, a cost that smaller independents struggle to finance. EU CBAM reporting raises working-capital needs for traders, nudging them toward long-term offtake with low-carbon suppliers.
Chlor-alkali Industry Leaders
-
INEOS
-
Occidental Petroleum Corporation
-
Olin Corporation
-
Tata Chemicals Ltd
-
Westlake Corporation
- *Disclaimer: Major Players sorted in no particular order
Chlor-alkali Market Companies Covered in this Report
- ANWIL SA
- BorsodChem (Wanhua)
- Ciner Group
- Covestro AG
- Dow
- Ercros SA
- Formosa Plastics Corporation
- Genesis Energy, L.P.
- Hanwha Group
- INEOS
- Kemira
- MicroBio
- Nirma
- Nobian (Reyez)
- Occidental Petroleum Corporation
- Olin Corporation
- PCC SE
- Shin-Etsu Chemical Co., Ltd
- Sisecam
- Solvay
- Spolchemie
- Tata Chemicals Ltd
- Tosoh Corporation
- Vynova Group
- Westlake Corporation
Market Opportunities and Future Outlook
White-space is emerging where countries build domestic chlor-alkali capacity to reduce reliance on imports for water treatment and other core industrial intermediates, often alongside downstream integration into vinyls. In Indonesia, a US$200 million investment agreement by Danantara and the Indonesia Investment Authority (INA) supports Chandra Asri Group's US$800 million chlor-alkali and ethylene dichloride (CA-EDC) project in Cilegon, and the project was reported at 50% completion in February 2026. With this combination of financing and integration into EDC, the project provides a route to scale captive chlorine consumption while anchoring caustic supply for local industrial users.
Opportunities also cluster around efficiency-led debottlenecking and modernization, where higher-efficiency membrane electrolyzers and co-product hydrogen management improve site economics under tighter carbon and water constraints. AGC Vinythai's February 2026 commissioning of an expanded Map Ta Phut chlor-alkali unit using thyssenkrupp nucera e-BiTAC v7 technology underscores continued demand for advanced electrolyzer platforms tied to capacity additions. In emerging markets, projectization continues through smaller, utility-aligned builds that expand local supply footprints, including Nuberg EPC winning an order in June 2026 for a 45-tpd chlor-alkali plant in Mlandizi District, Tanzania (commissioning targeted for January 2027), pointing to contracting activity for EPCs, equipment suppliers, and operators supporting new domestic chemical infrastructure.
Recent Industry Developments in Chlor-alkali Market
- April 2026: INEOS INOVYN agreed to sell its Italian chlor-alkali business (INOVYN Produzione Italia SpA, including the Rosignano and Tavazzano sites) to Esseco Industrial, with completion planned in 2026. The transaction reflects ongoing European portfolio rationalization amid cost and compliance pressures and shifts asset control to a buyer focused on the local industrial base.
- October 2025: INEOS confirmed its intention to close production units for chlorine and caustic soda at Rheinberg, Germany, citing the strain of high energy costs on European operations. The planned closures tighten regional supply and reinforce the competitiveness gap versus lower-cost power regions, influencing trade flows and long-term offtake strategies.
- December 2024: Olin confirmed plans to shut diaphragm-grade chlor-alkali capacity in Freeport, Texas, serving integrated demand tied to downstream customers. The move underscores the industry transition away from older diaphragm configurations and increases the importance of capacity availability at membrane-based sites for continuity of chlorine and caustic supply.
Chlor-alkali Market Report Scope and Research Methodology
Market Definition and Coverage
For this study, the chlor-alkali market covers bulk chemicals produced from brine electrolysis and supplied for industrial use, tracked as physical output volumes across regions. The focus stays on the core chlor-alkali chain where chlorine and caustic soda production economics are linked.
Scope exclusions: We exclude downstream derivatives and finished goods that use these chemicals (for example, PVC, solvents, detergents, alumina products, and paper products), and we also exclude internal captive transfers that are not reflected as market supply.
Segments Covered in This Report
- By Product
- Caustic Soda
- Chlorine
- Soda Ash
- By Production Process
- Membrane Cell
- Diaphragm Cell
- Other Processes
- By Application
- Pulp and Paper
- Organic Chemicals
- Inorganic Chemicals
- Soaps and Detergents
- Alumina
- Textiles
- Other Applications
- By Geography
- Asia-Pacific
- China
- India
- Japan
- South Korea
- Indonesia
- Thailand
- Malaysia
- Vietnam
- Rest of Asia-Pacific
- North America
- United States
- Canada
- Mexico
- Europe
- Germany
- United Kingdom
- France
- Italy
- Spain
- Turkey
- Russia
- Nordic Countries
- Rest of Europe
- South America
- Brazil
- Argentina
- Colombia
- Rest of South America
- Middle-East and Africa
- Saudi Arabia
- United Arab Emirates
- Qatar
- Egypt
- South Africa
- Nigeria
- Rest of Middle-East and Africa
- Asia-Pacific
Data Sources, Market Sizing, and Validation
Desk Research
Desk research started by mapping the supply chain, typical production routes (membrane and diaphragm), and the main demand pools that drive plant run rates. We relied on public sources such as the USGS, UN Comtrade, the International Energy Agency, and national industrial statistics offices, since they support country-level checks on production, trade flows, and energy intensity.
To tighten assumptions, we also reviewed company annual reports, sustainability disclosures, investor decks, and updates from industry associations, followed by reputable press coverage on plant shutdowns and capacity additions. Where needed, paid subscriptions were used for company financials and intelligence, patent lookups, and shipment-level import export checks to remove obvious outliers. The sources listed above are illustrative, and additional references were also used during data collection and cross-checking.
Primary Interviews and Surveys
Primary work centered on interviews and short surveys with chlor-alkali producers, distributors, EPC and plant-operations experts, and large industrial buyers that procure chlorine and caustic soda under contracts or spot arrangements. We used these discussions to confirm utilization ranges, regional pricing behavior, and the timing of capacity ramps, and then to sanity check conversion factors from nameplate capacity to saleable output across APAC, EMEA, and the Americas.
Distribution of primary research fieldwork respondents
| Company type | Respondent position | Region |
|---|---|---|
| Top tier: 33% | CXOs: 21% | APAC: 48% |
| Mid tier: 46% | Functional/Unit leaders: 32% | EMEA: 33% |
| Smaller Players: 21% | Managers: 47% | Americas: 19% |
Market-Sizing & Forecasting
Sizing was built using a top-down and bottom-up approach, where regional chlor-alkali output is reconstructed from installed capacity, typical operating rates, and trade movement, and then normalized to avoid double counting across co-produced outputs. After that structure was in place, we corroborated totals with selective bottom-up checks, including sampled producer capacity roll-ups, distributor channel checks, and simple volume cross-checks using indicative price direction.
A few inputs that matter a lot in this market were handled explicitly, including operating rate cycles tied to electricity prices, announced capacity additions and de-bottlenecking, co-product balance (chlorine pull versus caustic pull), and country-level import export dependence for key consuming sectors. Forecasts were extended using scenario analysis, where base case utilization and trade assumptions were adjusted using expert consensus, followed by a smoothing step to avoid unrealistic year-to-year jumps. When bottom-up checks were thin in smaller countries, gaps were handled by applying regionally observed utilization bands and validating them against trade signals and known plant footprints.
Data Validation & Update Cycle
Outputs were checked through several passes, starting with arithmetic and unit consistency checks, followed by variance checks versus independent indicators like capacity announcements, trade balances, and energy price shifts that typically move operating rates. If a region showed a sudden swing that could not be explained by a plant event or policy change, assumptions were reopened and interview notes were revisited.
Before sign-off, the model and supporting logic are reviewed by another analyst, and any material gaps trigger re-contact with selected industry participants for clarification. The report is refreshed annually, and interim updates are made when major capacity moves, regulatory changes, or abnormal energy pricing materially change the outlook. Right before delivery, we run a final refresh pass so clients receive the latest updated view.
Mordor Intelligence's Chlor Alkali Market Size Compared With Other Published Estimates
It is normal to see published chlor-alkali market sizes spread out, since some sources report physical production volumes and others report revenues that depend heavily on regional pricing and product mix. Differences also show up when soda ash is bundled into the same total, or when captive consumption is counted the same way as merchant sales.
Some published estimates present a single global USD value using blended price assumptions across caustic soda, chlorine, and adjacent chemicals. In Mordor Intelligence, the 2025 total is reported in million tons and is anchored to region-level capacity, utilization, and net trade checks, so the count is limited to saleable output rather than value-based rollups.
Benchmark comparison
| Source | Market Size | Gaps in Research Methodology |
|---|---|---|
| Mordor Intelligence | USD 286.78 M (2025) | |
| Global Data Publisher A | USD 65.18 B (2024) | Reported as revenue for 2024, so totals can swing with assumed ASPs, product mix, and currency conversion timing, and the scope may also blend merchant and captive volumes without a clear physical reconciliation. |
| Industry Report Publisher B | USD 58.40 B (2024) | Uses a global USD framing with process and application splits, which typically relies on blended price curves and may not show how co-product balancing and regional utilization were used to constrain volumes. |
Taken together, the spread mainly reflects unit choice (tons versus USD), plus how pricing and captive volumes are treated in the build. When the market is constrained by plant capacity, operating rates, and trade signals, the final number becomes easier to reproduce and to explain across regions.
Key Questions Answered in the Report
What is the projected volume of the chlor-alkali market by 2031?
It is forecast to reach 344.63 million tons, reflecting a 3.11% CAGR during 2026-2031.
Which segment holds the largest chlor-alkali market share?
Chlorine led with 40.89% of global volume in 2025.
Why are membrane cells gaining ground over diaphragm technology?
Membranes cut energy use to about 1,950 kWh per ton, eliminate asbestos, raise product purity, and enable hydrogen by-product sales.
How will carbon regulation influence regional competitiveness?
EU and Chinese carbon pricing raises cash costs by USD 60-80/t, advantaging Middle Eastern producers with low-carbon power.
What role does hydrogen valorisation play in plant economics?
Selling the 0.028 tons of hydrogen co-produced per ton of caustic can improve EBITDA by 8-12% when hydrogen prices exceed USD 3/kg.