Chitosan Market Size and Share
Market Overview
| Study Period | 2020 - 2031 |
|---|---|
| Market Size (2026) | USD 6.30 Billion |
| Market Size (2031) | USD 11.30 Billion |
| Growth Rate (2026 - 2031) | 12.38% CAGR |
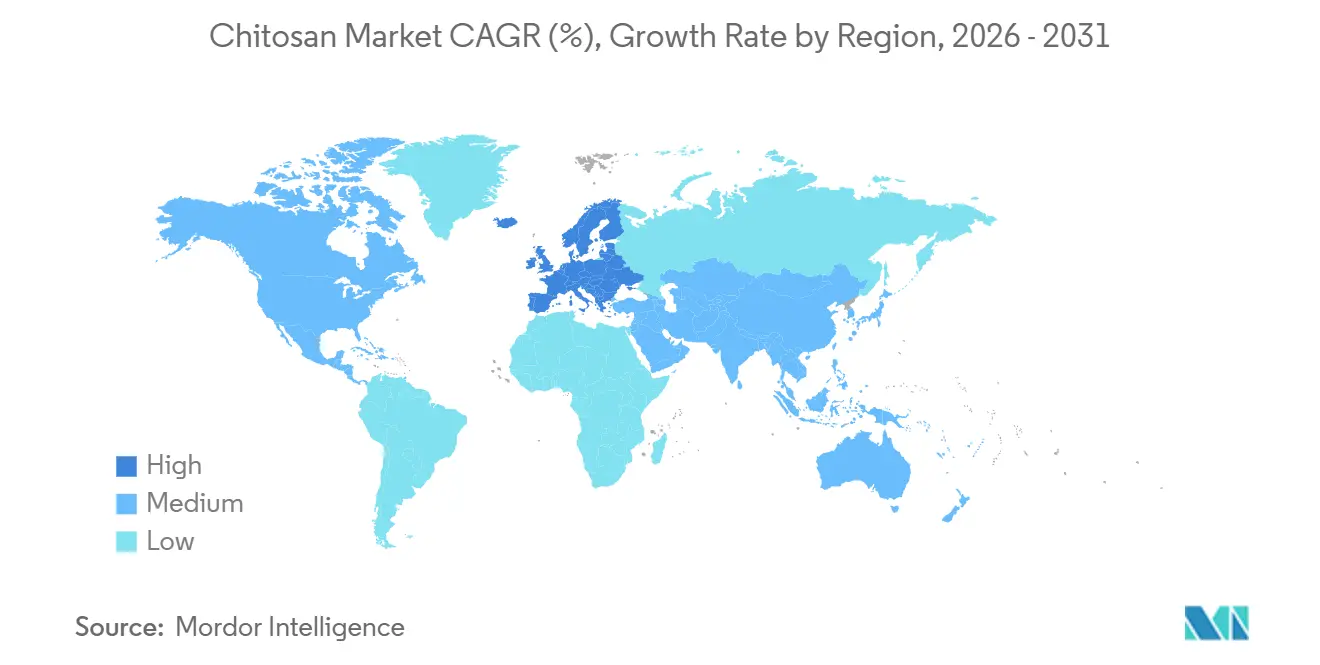
| Fastest Growing Market | Europe |
| Largest Market | North America |
| Market Concentration | Medium |
Major Players *Disclaimer: Major Players sorted in no particular order Image © Mordor Intelligence. Reuse requires attribution under CC BY 4.0. | |

Chitosan Market Analysis by Mordor Intelligence
The Chitosan Market size is estimated at USD 6.30 billion in 2026, and is expected to reach USD 11.30 billion by 2031, at a CAGR of 12.38% during the forecast period (2026-2031).
Rising demand for biodegradable flocculants in municipal and industrial water treatment, regulatory recognition of chitosan as a plant biostimulant in Europe, and clinical validation of chitosan-based hemostatic dressings are the pivotal forces propelling the global chitosan market. Municipal utilities in the European Union are swapping synthetic polyacrylamide for chitosan to comply with the 2024 recast of the Urban Wastewater Treatment Directive, while industrial dischargers in the United States face tighter EPA heavy-metal limits that favor chitosan chelators. Pharmaceutical developers are scaling nano-chitosan carriers that triple tumor drug accumulation, and cosmetic formulators are harnessing chitosan oligosaccharides in “clean beauty” lines that tout marine-origin biodegradability. Venture funding in circular-economy processors, exemplified by Tidal Vision’s USD 6.5 million Series A round, signals investor confidence in the global chitosan market as a source of both environmental compliance and high-margin specialty products.
Key Report Takeaways
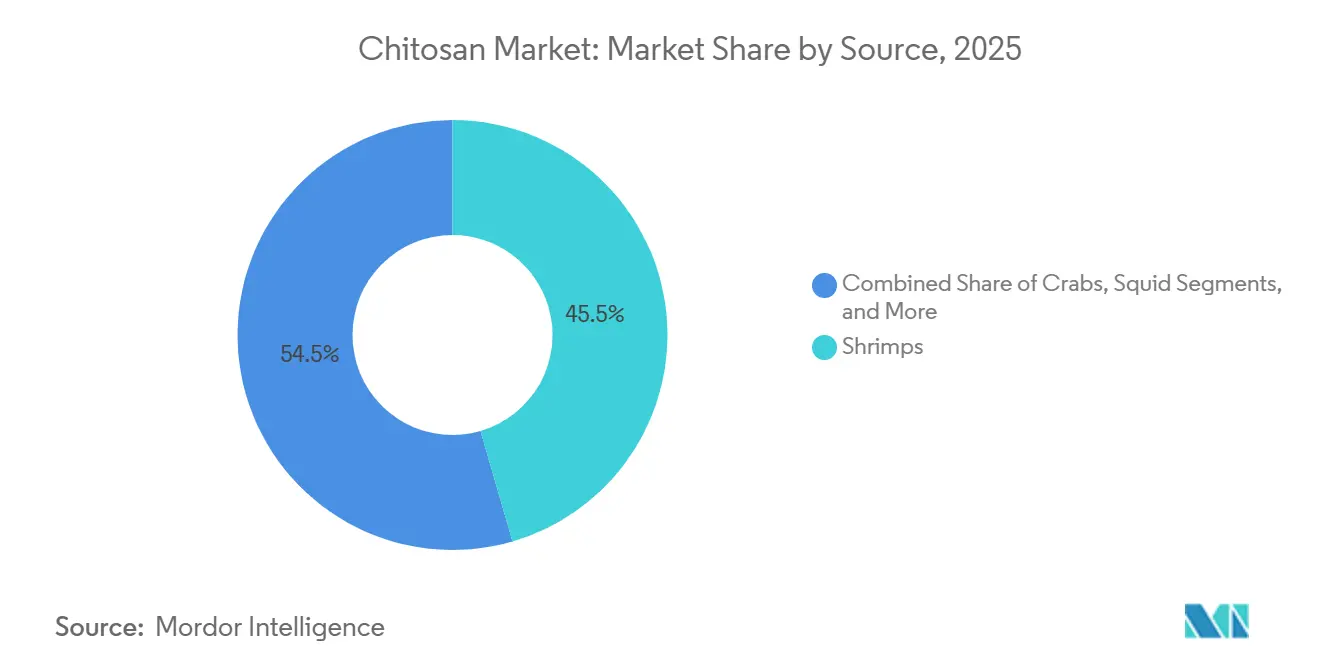
- By source, shrimps led with 45.55% of chitosan market share in 2025, while crabs are forecast to post a 13.25% CAGR through 2031.
- By grade, industrial specifications accounted for 45.53% of the chitosan market in 2025; pharmaceutical and biomedical grade is projected to expand at a 12.85% CAGR to 2031.
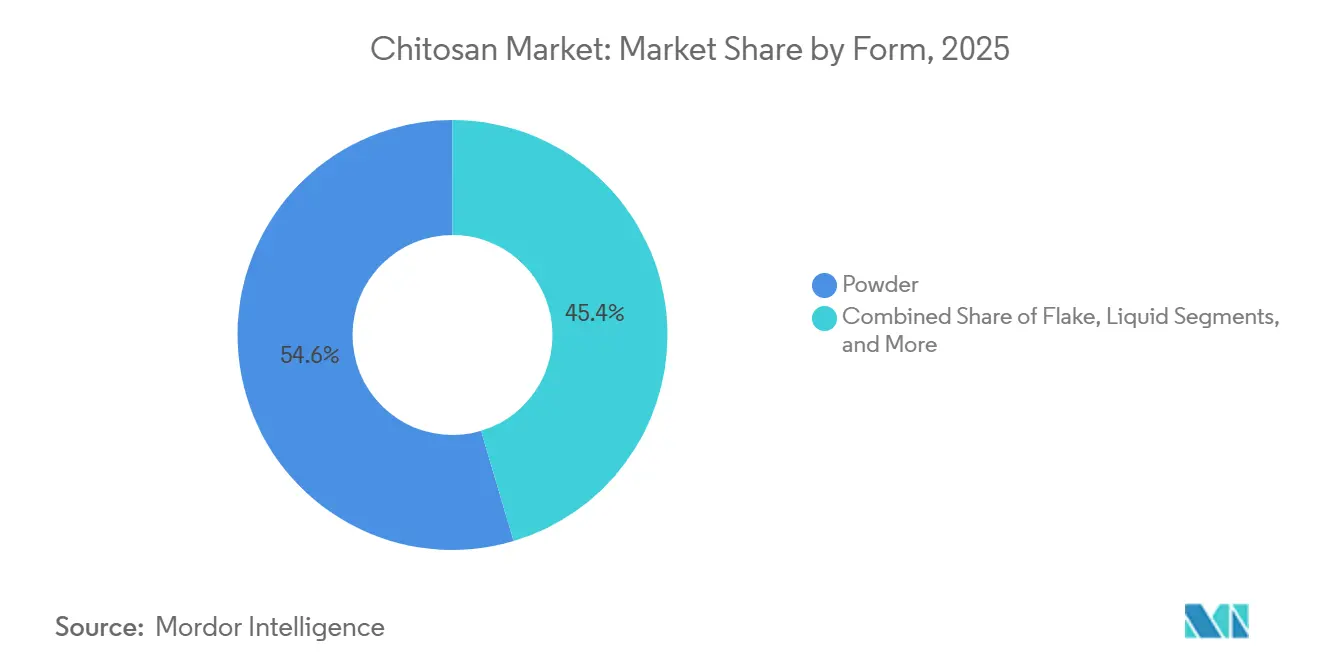
- By form, powders held 54.63% share of the chitosan market size in 2025, whereas nano and micro particles are advancing at a 13.87% CAGR during the outlook period.
- By application, water treatment represented 28.13% of the chitosan market in 2025, yet pharmaceutical and biomedical uses will register the fastest 13.7% CAGR to 2031.
- By geography, North America commanded 25.13% share of the chitosan market in 2025; Europe is on track to expand at a 14.51% CAGR to 2031.
Note: Market size and forecast figures in this report are generated using Mordor Intelligence’s proprietary estimation framework, updated with the latest available data and insights as of January 2026.
Global Chitosan Market Trends and Insights
Driver Impact Analysis
| Driver | (~) % Impact on CAGR Forecast | Geographic Relevance | Impact Timeline |
|---|---|---|---|
| Rising water-treatment regulations | +2.8% | EU, North America, China | Medium term (2-4 years) |
| Surging demand for biodegradable and eco-friendly materials | +2.5% | Global, led by EU and North America | Long term (≥ 4 years) |
| Expanding biomedical, cosmetics and food uses of chitosan oligosaccharides | +2.1% | North America, EU, Japan | Medium term (2-4 years) |
| Shift toward bio-based flocculants in industrial effluents | +1.9% | Asia-Pacific core, spill-over to MEA | Short term (≤ 2 years) |
| Adoption of fungal or plant-based chitosan for vegan and Halal markets | +1.4% | EU, Middle East, Southeast Asia | Long term (≥ 4 years) |
| Circular-economy valorization of seafood and insect waste streams | +1.1% | North America, Nordic countries, Asia-Pacific | Medium term (2-4 years) |
| Source: Mordor Intelligence | |||
Rising Water-Treatment Regulations
Utilities in the European Union must now install quaternary treatment that targets micropollutants, and chitosan simultaneously coagulates colloids and adsorbs trace organics, reducing alum use by up to 30%[1]European Commission, “Urban Waste Water Treatment Directive,” europa.eu. Industrial sites in the United States face stricter 40 CFR Part 125 limits for heavy metals, and chitosan derivatives remove 93–99% of iron, copper and zinc without hazardous sludge. China has cut total chromium limits for electroplating effluent to 0.5 mg L-1, prompting early adoption of chitosan flocculants in Zhejiang and Guangdong. These converging regulations enlarge the addressable market for high-deacetylation chitosan grades that assure both performance and biodegradability.
Surging Demand for Biodegradable and Eco-Friendly Materials
Brand owners pursuing plastic-free packaging and compostable agriculture inputs are specifying chitosan films that degrade 80–90% within 60 days under industrial composting, far faster than polyethylene. The Single-Use Plastics Directive in Europe curbs oxo-degradable polymers, directing formulators toward chitosan seed coatings and controlled-release fertilizers that leave no persistent residue. Hair-care brands are reformulating gels with quaternized chitosan that delivers hold without microplastics, leveraging marine-origin storytelling to command premium shelf pricing. These preferences move the global chitosan market beyond compliance, turning biodegradability into a marketing advantage.
Expanding Biomedical, Cosmetics and Food Uses of Chitosan Oligosaccharides
Clinical studies show chitosan oligosaccharides enrich gut Bifidobacterium and reduce fasting glucose in pre-diabetic adults, supporting their emergence as prebiotic supplements. Cosmetic serums formulated with low-molecular-weight chitosan penetrate the stratum corneum, lowering transepidermal water loss and calming UV-induced redness in human trials. Japanese producers employ enzymatic hydrolysis to control molecular weight distribution, optimizing bioavailability for dermal and oral applications. Food and beverage adoption awaits European Food Safety Authority clearance on allergenicity, yet U.S. dietary supplement use is climbing under Generally Recognized as Safe status.
Shift Toward Bio-Based Flocculants in Industrial Effluents
Polyacrylamide residue caps in China and India have spurred pulp and paper mills to trial chitosan alternatives that equal cationic polyacrylamide performance at 30% lower dosage. Quaternized chitosan flocculates across a broad pH window, making it suited to both acidic mining water and alkaline textile effluent without the need for multiple synthetic blends. Asia-Pacific suppliers are releasing tailored molecular-weight chitosan variants, securing multi-year contracts by delivering site-specific performance rather than competing solely on price.
Restraint Impact Analysis
| Restraint | (~) % Impact on CAGR Forecast | Geographic Relevance | Impact Timeline |
|---|---|---|---|
| Allergenic concerns limiting food and cosmetic uptake | -1.6% | EU, North America | Short term (≤ 2 years) |
| High cost of ultra-high-purity medical-grade chitosan | -1.3% | Global, intense in value-sensitive segments | Medium term (2-4 years) |
| Limited scalability of fungal fermentation capacity | -0.9% | EU, North America | Long term (≥ 4 years) |
| Climate-driven volatility of crustacean biomass supply | -1.1% | Asia-Pacific, North America | Medium term (2-4 years) |
| Source: Mordor Intelligence | |||
Allergenic Concerns Limiting Food and Cosmetic Uptake
Residual proteins in lower-grade crustacean chitosan can trigger IgE reactions in shellfish-sensitized individuals, leading the European Food Safety Authority to delay opinions on direct food contact and forcing cosmetic brands to label shellfish origin[2]Journal of Allergy and Clinical Immunology, “Shellfish Allergenicity,” jacionline.org. Fungal and insect chitosan could bypass allergen labeling, but clinical safety dossiers remain incomplete, holding back full-scale commercialization. Until risk assessments conclude, formulators in mass-market foods and cosmetics will limit chitosan inclusion or invest in higher-purity grades, tempering near-term volume growth.
High Cost of Ultra-High-Purity Medical-Grade Chitosan
Meeting pharmaceutical specifications below 0.5 EU mg-1 endotoxin and above 95% deacetylation requires multi-stage acid-base hydrolysis, activated-carbon treatment and ultrafiltration that triples operating costs versus industrial chitosan. Good Manufacturing Practice compliance adds cleanroom overhead and batch traceability, confining supply to a few DMF-holding producers who exercise oligopolistic pricing. The resulting USD 500 kg price for nano-chitosan restricts penetration to premium wound-care dressings and oncology drug carriers, slowing broader clinical uptake.
Segment Analysis
By Source: Crustacean Shells Sustain Volume while Crabs Accelerate
Shrimp shells yielded 45.55% of global chitosan market output in 2025, supported by established logistics in Thailand, Vietnam and India that channel 1.5 million t of shell waste into dedicated deacetylation lines. Crabs are forecast to lead growth at a 13.25% CAGR as processors in Alaska and Northern Europe consolidate shell recovery, boosting deacetylation yields and lowering unit costs. Insect exoskeletons and fungal biomass are emerging feedstocks with vegan, Halal and Kosher positioning, yet extraction costs remain 20–30% higher owing to immature infrastructure. Seasonal variability still influences the global chitosan market, as climate anomalies shrink shrimp harvests in El Niño years, prompting processors to hedge supply with mixed crustacean and fungal inputs. Although squid-derived chitosan remains a niche, its clarity and low viscosity command premium pricing in high-end cosmetics, revealing the diversification potential within marine feedstocks.
Crab-based capacity expansions in Norway and Canada are backed by grants that subsidize cold-water fishery waste valorization, reinforcing supply security for European buyers seeking traceability under the EU Green Deal. Asian government incentives for insect farming on food waste are likewise nurturing pilot-scale black soldier fly chitosan plants, opening a circular-economy storyline. While insect chitosan currently represents less than 2% of global chitosan market volume, favorable life-cycle assessments could accelerate its share once purification costs fall. Overall, feedstock diversification limits raw-material risk and supports stable pricing in a market vulnerable to aquaculture disease outbreaks.
Note: Segment shares of all individual segments available upon report purchase
By Grade: Pharmaceutical Purity Unlocks Premium Margins
Industrial-grade material commanded 45.53% of the global chitosan market size in 2025, filling water-treatment and textile niches where 75–85% deacetylation suffices. Pharmaceutical and biomedical grades, however, will outpace commodity specifications at 12.85% CAGR through 2031 as clinical evidence spreads and military procurement of hemostatic dressings rises. The degree of deacetylation, endotoxin burden and molecular-weight range define price tiers, with Good Manufacturing Practice batches retailing at 3–10 times industrial equivalents.
Drug-carrier patents covering chitosan-collagen composites and nano-gel matrices strengthen price resilience, while oligopolistic supply from Primex, Heppe Medical Chitosan and a few Chinese DMF holders preserves market discipline. Food-grade chitosan, positioned between industrial and medical benchmarks, benefits from Generally Recognized as Safe status in the United States yet awaits full clearance in Europe. As a result, the grade hierarchy widens, segmenting buyers by regulatory exposure and margin appetite rather than sheer volume requirements.
By Form: Nano Particles Propel Drug-Delivery Innovation
Powders retained 54.63% global chitosan market share in 2025 thanks to easy handling in water treatment and agriculture. Nano and micro particles will chart the fastest 13.87% CAGR, driven by oncology pipelines where sub-300 nm chitosan vectors triple tumor accumulation of doxorubicin and cut cardiotoxicity in half. Production routes such as ionic gelation with tripolyphosphate add USD 300–400 kg to cost, confining initial adoption to high-value indications including gene delivery and ophthalmic therapeutics.
Flake and bead forms serve agriculture and controlled-release fertilizers, hydrating slowly to maintain field persistence. Liquid chitosan solutions gain favor in cosmetics and food applications for mix-free incorporation, although their 6-to-12-month shelf life limits export horizons. The form factor range underpins the global chitosan market’s flexibility, allowing suppliers to target both high-volume industrial buyers and precision-dosing pharmaceutical companies.
Note: Segment shares of all individual segments available upon report purchase
By Application: Pharmaceutical Uses Surpass Commodity Water Treatment
Water treatment contributed 28.13% to the global chitosan market in 2025 but faces moderating expansion as penetration peaks in mature economies. Pharmaceutical and biomedical applications are projected to grow at 13.7% CAGR, spurred by U.S. Department of Defense procurement of chitosan dressings and phase II trials of oxygenating hydrogels that cut bacterial load by 90% in chronic wounds. Cosmetics tap chitosan’s film-forming and moisturizing traits for anti-aging serums, while agriculture leverages foliar sprays that cut powdery mildew incidence by 60–80% in grapes and tomatoes without pesticide registration. Food and beverage uses remain cautious until allergen rulings conclude, though dietary supplement demand rises on prebiotic positioning. As specialty applications widen, dependence on commodity flocculation revenue declines, rebalancing the global chitosan market toward value-dense segments.
Geography Analysis
Europe will post the strongest 14.51% CAGR through 2031, propelled by quaternary wastewater mandates and the biostimulant classification that simplifies chitosan deployment in farming. Germany funds municipal trials that replace polyacrylamide with chitosan, and Spain deploys chitosan sprays in viticulture to reduce synthetic fungicide load. United Kingdom trauma centers have standardized chitosan dressings, boosting hospital demand and reinforcing the region’s leadership in medical applications.
North America captured 25.13% of global chitosan market share in 2025, anchored by EPA pretreatment standards and early battlefield use of chitosan hemostats. Growth moderates as water-treatment installations mature, yet pharmaceutical prospects remain attractive as inhaled-drug-grade chitosan wins its first USP monograph. Canada’s cold-water crab fisheries provide low-contaminant shells, supporting premium pharmaceutical supply chains and reinforcing regional competitiveness.
Asia-Pacific supplies most feedstock, processing about 2 million of shell waste annually in Thailand, Vietnam and China. Domestic chitosan uptake is uneven; China tightened chromium discharge limits, catalyzing localized adoption, but enforcement gaps restrain nationwide penetration. Japan specializes in cosmetic-grade oligosaccharides with proprietary hydrolysis technology, while India’s aquaculture hubs expand industrial-grade output for global export. Emerging markets in the Middle East test chitosan as a pretreatment in desalination, and South America inches forward with Brazil deploying chitosan bio-pesticides in organic soy farming amid tariff and infrastructure headwinds.
Competitive Landscape
The chitosan market is moderately concentrated; the top five suppliers control a significant share, leaving space for agile entrants to specialize in grades or feedstocks. Primex leverages Icelandic shrimp shells certified by the Marine Stewardship Council to market traceable, low-endotoxin material, while Advanced Biopolymers integrates extraction and downstream purification in Norway to stabilize margins despite biomass volatility. KitoZyme dominates oligosaccharides for nutraceuticals through proprietary enzymatic hydrolysis that fine-tunes molecular weight distribution, creating a defensible niche[3]KitoZyme, “Corporate Overview,” kitozyme.com.
Heppe Medical Chitosan capitalizes on multiple patents for chitosan-collagen composites and holds an FDA Drug Master File, anchoring its premium pricing strategy in biomedical consumables. Disruptors such as Tidal Vision target negative-cost crab shells from U.S. processors, projecting cost leadership once its proprietary green extraction line scales in 2026. Meron Biopolymers pilots submerged fermentation to supply vegan chitosan in the EU, though production volumes remain small. Competitive differentiation hinges on raw-material control, Good Manufacturing Practice compliance and formulation patents, barriers that discourage purely price-based competition.
Chitosan Industry Leaders
Primex ehf
Panvo Organics Pvt Ltd
KitoZyme SA
Heppe Medical Chitosan GmbH
GTC Bio Corporation
- *Disclaimer: Major Players sorted in no particular order
Recent Industry Developments
- July 2025: trū Chitosan, a brand of iterro Life Sciences, introduced trū Chitosan USP Inhalant—the first commercially available chitosan qualified for inhaled drug delivery, based on USP and USP 232 standards.
- April 2025: BC3 Technologies received a U.S. patent protecting its SEAL Hemostatic Wound Spray, the world’s first FDA-cleared aerosolized chitosan for rapid arterial bleeding control.
Research Methodology Framework and Report Scope
Market Definitions and Key Coverage
Our study defines the chitosan market as the value generated from sales of primary chitosan polymer, regardless of molecular weight, obtained through commercial de-acetylation of chitin sourced from crustacean shells or fungal mycelium and traded in powder, flake, liquid, or micro-/nano-particle forms for use across water treatment, food, cosmetics, biomedical, agriculture, textile, and industrial processing.
Scope Exclusion: Blended downstream derivatives such as chitosan oligosaccharides, glucosamine supplements, and finished wound-dressing products are outside the value pool.
Segmentation Overview
- By Source
- Shrimps
- Crabs
- Squid
- Fungi / Mycelium
- Insect Exoskeletons
- Others
- By Grade
- Industrial Grade
- Food Grade
- Pharmaceutical & Biomedical Grade
- By Form
- Powder
- Flake
- Liquid
- Nano / Micro Particles
- By Application
- Water Treatment
- Cosmetics & Personal Care
- Pharmaceutical & Biomedical
- Food & Beverage
- Agriculture & Horticulture
- Textile & Printing
- Others
- By Geography
- North America
- United States
- Canada
- Mexico
- Europe
- Germany
- United Kingdom
- France
- Italy
- Spain
- Rest of Europe
- Asia-Pacific
- China
- Japan
- India
- Australia
- South Korea
- Rest of Asia-Pacific
- Middle East & Africa
- GCC
- South Africa
- Rest of Middle East & Africa
- South America
- Brazil
- Argentina
- Rest of South America
- North America
Detailed Research Methodology and Data Validation
Primary Research
Multiple touchpoints with polymer chemists, wastewater plant managers in Asia-Pacific, biomedical formulators in North America, and bulk distributors in Europe allowed us to validate yield-loss assumptions, average transaction prices, and end-use penetration shares, while clarifying regional regulatory triggers that do not surface in public literature.
Desk Research
Our team began with open datasets, including FAO Fisheries capture volumes (raw shell supply proxy), UN Comtrade HS-code 391390 export-import flows, Eurostat industrial wastewater statistics, and OECD Bio-economy policy trackers, which frame baseline production and demand metrics. Peer-reviewed work in Carbohydrate Polymers and patent families retrieved through Questel clarified performance traits, emerging grades, and regional research intensity.
We then layered firm-level evidence, SEC 10-Ks, Japanese EDINET filings, and investor presentations, cross-checked with shipment analytics from Volza and news archives via Dow Jones Factiva to map producer capacities, typical selling prices, and new capacity announcements. The sources cited represent only a subset of the wide secondary corpus screened during compilation.
Market-Sizing & Forecasting
The core model starts with a top-down reconstruction: global crustacean shell waste volumes, adjusted for chitin content and de-acetylation yields, generate an addressable production pool that is then apportioned by application using verified penetration ratios. Select bottom-up cross-checks, such as sample manufacturer revenues and ASP × volume channel checks, align totals and flag outliers. Key variables guiding the base year include (i) shrimp processing output, (ii) industrial wastewater capacity additions, (iii) average pharmaceutical-grade ASP, (iv) regulatory approvals for chitosan-based hemostats, and (v) cosmetic launch counts. Multivariate regression of these drivers underpins the 2025-2030 forecast, with scenario analysis stress-testing raw-material volatility. Identified data gaps, such as informal fungal production, are bridged by conservative elasticity factors agreed during expert calls.
Data Validation & Update Cycle
Outputs pass a three-layer variance screen, senior analyst peer review, and director sign-off. Models refresh every twelve months, with interim updates triggered by >10 % capacity shifts, material mergers, or regulatory shocks; a last-mile sense check is performed immediately before report delivery.
Why Mordor's Chitosan Baseline Stands Up to Scrutiny
Published estimates often diverge because firms adopt distinct scopes, pricing ladders, and update cadences.
Key gap drivers here include: some publishers fold in high-value oligosaccharides and derivative blends, others anchor on historic 2023 prices without adjusting for the 9 % ASP softening seen in 2024, while a few roll forward projections from older capacity surveys that missed the recent pullback in Chinese exports. Mordor's analysts restrict the scope to primary chitosan polymer, factor real-time trade prices, and apply yearly refreshes, yielding a more stable benchmark for planners.
Benchmark comparison
| Market Size | Anonymized source | Primary gap driver |
|---|---|---|
| USD 2.34 B | Mordor Intelligence | - |
| USD 2.10 B (2023) | Regional Consultancy A | Older base year, excludes biomedical grade, limited primary validation |
| USD 19.15 B | Global Consultancy B | Includes derivatives/oligosaccharides, aggressive ASP assumptions, broad additive scope |
These comparisons show that once scope inflation and outdated inputs are stripped away, Mordor's disciplined, annually refreshed approach offers a balanced, transparent baseline decision-makers can rely on.
Key Questions Answered in the Report
How large is the global chitosan market in 2026?
The global chitosan market size stands at USD 6.30 billion in 2026.
What CAGR is expected for chitosan through 2031?
The market is forecast to grow at a 12.38% CAGR during 2026-2031.
Which source segment is growing fastest?
Crab-derived chitosan is projected to record a 13.25% CAGR to 2031.
Why is Europe the fastest-expanding region?
EU wastewater and biostimulant regulations accelerate adoption, lifting regional growth to a 14.51% CAGR.
What is driving pharmaceutical demand for chitosan?
FDA-cleared hemostatic dressings and clinical trials of nano-chitosan drug carriers are spurring pharmaceutical uptake.


