
Market Overview
| Study Period | 2020 - 2031 |
|---|---|
| Forecast Data Period | 2026 - 2031 |
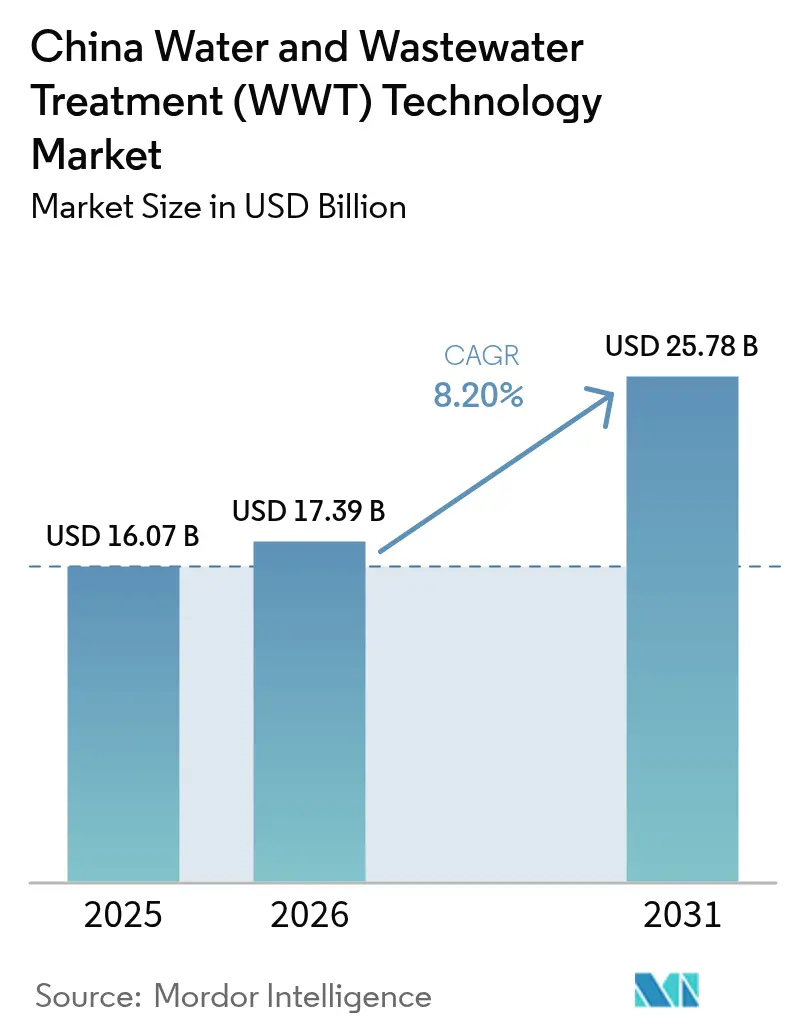
| Base Year Market Size (2025) | USD 16.07 Billion |
| Market Size (2026) | USD 17.39 Billion |
| Market Size (2031) | USD 25.78 Billion |
| Growth Rate (2026 - 2031) | 8.20 % |
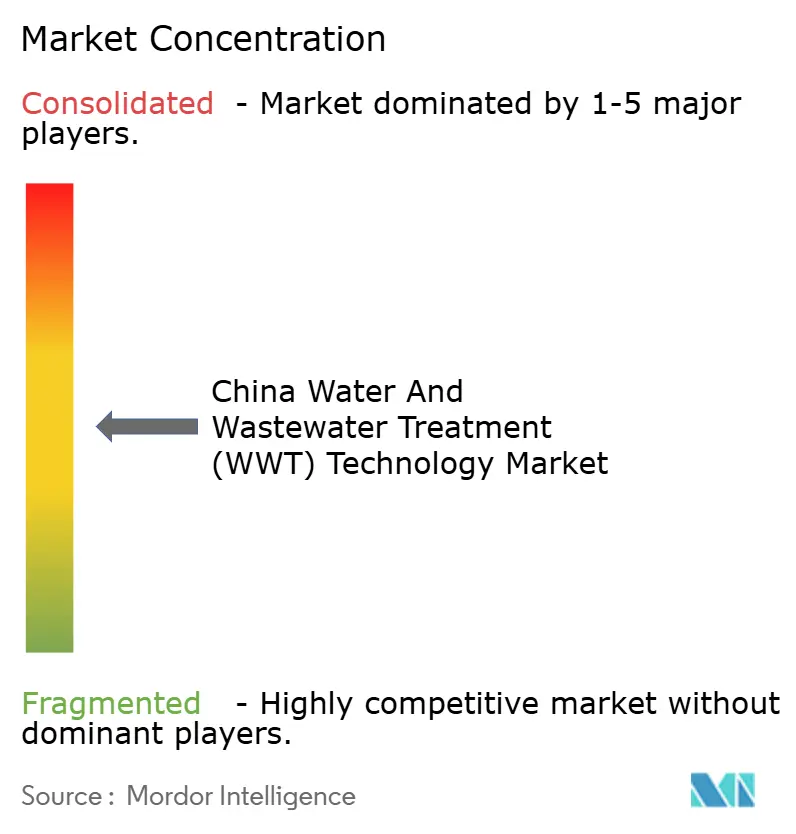
| Market Concentration | Medium |
Major Players *Disclaimer: Major Players sorted in no particular order Image © Mordor Intelligence. Reuse requires attribution under CC BY 4.0. | |
China Water And Wastewater Treatment (WWT) Technology Market Analysis by Mordor Intelligence
The China Water and Wastewater Treatment Technology Market size was valued at USD 16.07 billion in 2025 and estimated to grow from USD 17.39 billion in 2026 to reach USD 25.78 billion by 2031, at a CAGR of 8.20% during the forecast period (2026-2031). Rapid urbanization, strict zero-liquid-discharge (ZLD) mandates, and a USD 50 billion public-private-partnership (PPP) pipeline are the primary forces expanding treatment capacity and pushing advanced membrane adoption. Industrial operators now view wastewater as a recoverable resource that can yield biogas, nutrients, and deionized water, turning cost centers into revenue generators and improving project bankability. Regional tariff incentives in the Yangtze and Pearl River deltas deliver 20-30% higher internal rates of return, prompting technology vendors to prioritize eastern provinces for pilot roll-outs and joint ventures. Competitive intensity remains moderate as domestic manufacturers accelerate ceramic-membrane scaling while international suppliers focus on turnkey resource-recovery solutions, creating scope for hybrid partnership models that blend global know-how with local execution.
Key Report Takeaways
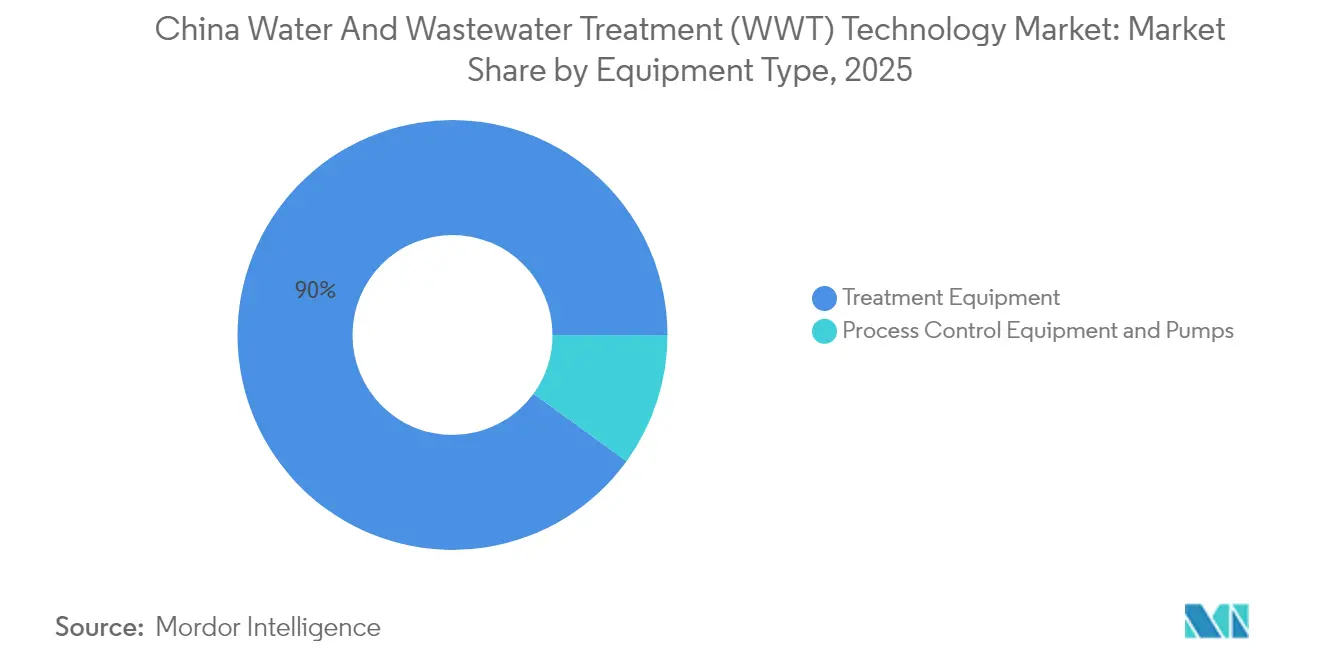
- By equipment type, treatment equipment captured 90.02% of the China water and wastewater treatment technology market share in 2025 and will expand at an 8.39% CAGR through 2031.
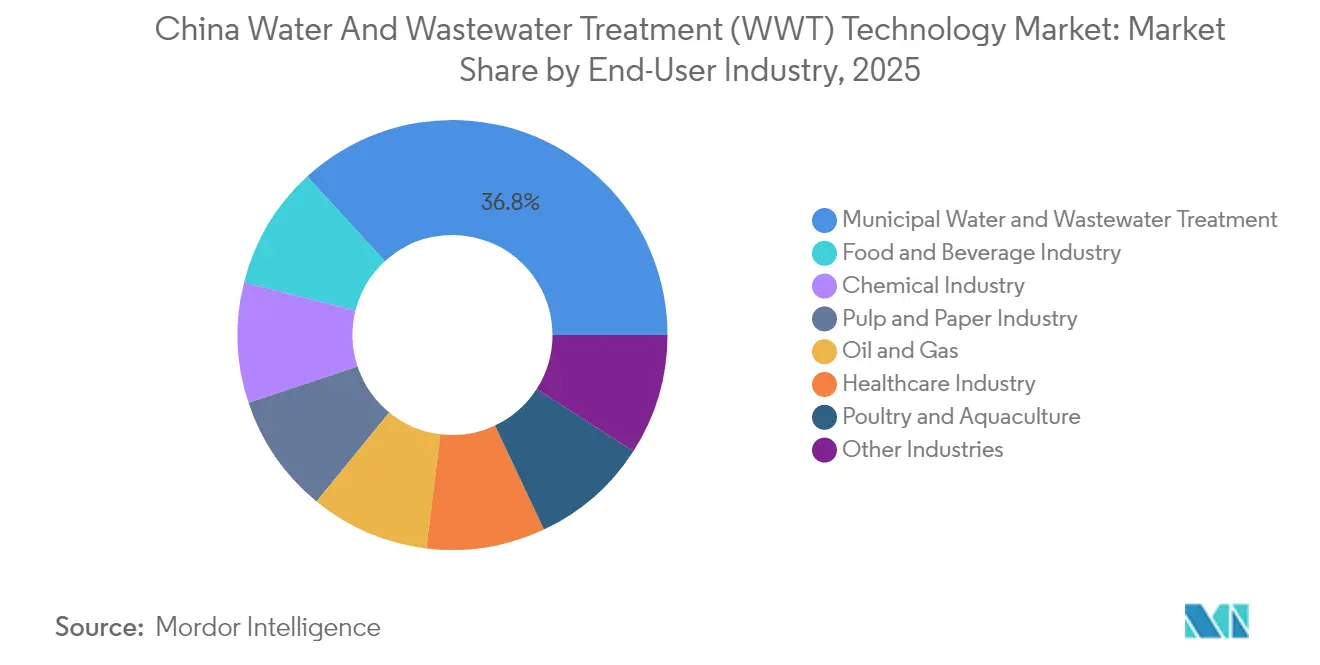
- By end-user sector, municipal facilities held 36.82% of the China water and wastewater treatment technology market size in 2025, whereas the food and beverage sector is forecast to grow the fastest at a 9.30% CAGR to 2031.
Note: Market size and forecast figures in this report are generated using Mordor Intelligence’s proprietary estimation framework, updated with the latest available data and insights as of 2026.
China Water And Wastewater Treatment (WWT) Technology Market Trends and Insights
Drivers Impact Analysis*
| Driver | (~) % Impact on CAGR Forecast | Geographic Relevance | Impact Timeline |
|---|---|---|---|
| Industrial zero-liquid-discharge mandates | +2.10% | Yangtze & Pearl River deltas | Short term (≤ 2 years) |
| Strong municipal PPP pipeline under 14th Five-Year Plan | +1.80% | Tier 2–3 cities nationwide | Medium term (2–4 years) |
| Rising semiconductor and EV water-purity requirements | +1.20% | Guangdong, Jiangsu, Shanghai | Medium term (2–4 years) |
| Carbon-neutral goals driving energy-efficient WWT tech | +1.10% | Early adoption in Beijing, Shenzhen, Hangzhou | Long term (≥ 4 years) |
| Waste-to-resource (biogas, nutrient recovery) economics | +0.90% | Shandong, Hebei, Liaoning | Long term (≥ 4 years) |
| Source: Mordor Intelligence | |||
Industrial Zero-Liquid-Discharge Mandates Drive Technology Upgrades
ZLD regulations compel more than 15,000 chemical, pharmaceutical, and textile sites to recover 95% of process water or face penalties up to USD 1.5 million. Mandatory compliance resets procurement criteria toward reverse-osmosis, evaporation, and crystallization trains that deliver near-complete water recovery. Ceramic ultrafiltration membranes command 40-50% price premiums yet deliver longer life cycles and lower fouling, reducing the total cost of ownership beyond year 4. The GB 18918-2002 framework synchronizes provincial inspections, turning enforcement into a predictable demand cycle that sustains supplier order books. Domestic firms close the technology gap by licensing thin-film composite chemistries, while international vendors differentiate through integrated energy-recovery modules that cut operating kilowatt-hours by 25-30%.
Municipal PPP Pipeline Under 14th Five-Year Plan Accelerates Infrastructure Investment
The 14th Five-Year Plan allocates USD 75 billion specifically to water infrastructure, with 60% slated for PPPs that guarantee 20–30-year service payments anchored to performance indices. Tier 2 and Tier 3 municipalities tendered over 200 wastewater projects in 2024, each valued at USD 50-150 million, creating an addressable backlog attractive to foreign operators offering EPC-plus-O&M models[1]. Standardized contract templates lower legal costs and compress bid-to-award cycles from 18 months to 9 months, improving cash-flow visibility for equipment suppliers. The PPP momentum stabilizes tariff regimes, which is pivotal for lenders that previously discounted variable pricing risk. Consequently, the China water and wastewater treatment technology market experiences steadier capital inflows that fund advanced oxidation and membrane bioreactor upgrades over conventional lagoons.
Semiconductor and EV Manufacturing Drive Ultra-Pure Water Demand
China’s push for 70% chip self-sufficiency by 2030 adds more than 50 new fabs, each requiring 10,000–50,000 m³/day of water at 18 megohm-cm resistivity[2]. Treatment trains integrating electrodeionization units, double-pass RO, and 0.05 µm filtration cost 3–5 times standard systems but lock in supply contracts upward of 10 years, underpinning long-term revenue for specialty providers. EV battery output scaling to 600 GWh demands equally stringent deionized process water, further widening the high-margin ultrapure segment. Bundled offerings that pair water polishing with wastewater metal-recovery units extract nickel, cobalt, and lithium worth USD 1,000–3,000/ton, supporting circular-economy objectives and reducing raw-material intensity by 4-6 percentage points. Provincial subsidies on “green-fab” certification expedite such installations, accelerating adoption in the China water and wastewater treatment technology market.
Waste-to-Resource Economics Transform Wastewater into Revenue Streams
Anaerobic digesters, which monetize 0.3–0.4 m³ biogas per cubic meter of influent, generate annual revenues of USD 2–5 million for large-footprint plants and cut methane emissions by 80-90%[3]. Nutrient-recovery modules crystallize phosphate salts worth USD 500-800/ton, allowing facilities to sell fertilizer into premium organic channels. Food processors lead adoption because high-BOD effluent yields triple biogas volumes relative to municipal sewage, while lowered sludge volumes reduce disposal fees by up to 35%. Government tax credits for 50% resource-recovery rates and subsidized development-bank loans shorten investment cycles to six years. These economics reposition the China water and wastewater treatment technology market toward circular-economy value capture instead of compliance alone.
Restraints Impact Analysis*
| Restraint | (~) % Impact on CAGR Forecast | Geographic Relevance | Impact Timeline |
|---|---|---|---|
| High capex for advanced membranes and AOP systems | -1.50% | Central & western provinces | Short term (≤ 2 years) |
| Slow standardisation for IIoT cybersecurity in plants | -0.80% | Large municipal plants nationwide | Medium term (2–4 years) |
| Provincial tariff gaps limiting private ROI | -0.60% | Rural municipalities | Long term (≥ 4 years) |
| Source: Mordor Intelligence | |||
High Capital Requirements Constrain Market Entry
Ceramic membranes enabling ZLD run USD 800–1,200 per m³/day versus USD 300–500 for activated-sludge units, pushing smaller plants to defer upgrades. Bank debt typically covers 60–70% of project cost, yet ten-year amortization proves too short for cash-flow breakeven, especially in western provinces with lower tariffs. Leasing and build-operate-transfer schemes could fill the gap but remain unevenly regulated, adding legal risk premiums that raise overall borrowing costs. The capex hurdle delays penetration of AOP units that eliminate micropollutants, thereby slowing the pace at which the China water and wastewater treatment technology industry can align with emerging toxicity rules.
IIoT Integration Faces Cybersecurity Challenges
Water utilities seek sensor networks and predictive analytics to cut chemical dosing 10–15%, but disparate cybersecurity protocols elevate the threat of operational downtime. The Multi-Level Protection Scheme mandates localized data and extensive penetration testing, obligations that smaller operators struggle to finance. Vendor-specific communication stacks further complicate interoperability, inflating engineering budgets by 20-30% and elongating commissioning schedules by up to a year. Until standardized frameworks emerge, IIoT rollouts will progress sporadically, tempering digital-service revenue potential within the China water and wastewater treatment technology market.
*Our forecasts treat driver/restraint impacts as directional, not additive. The impact forecasts reflect baseline growth, mix effects, and variable interactions.
Segment Analysis
By Equipment Type: Treatment Equipment Maintains Technological Leadership
Treatment equipment accounted for 90.02% of the China water and wastewater treatment technology market share in 2025 and is projected to expand at an 8.39% CAGR through 2031. Membrane bioreactors, advanced oxidation units, and multi-stage filtration lines form the backbone of ZLD compliance as well as ultrapure-water fabrication demands. Biological systems dominate subsegment revenue, leveraging anaerobic and membrane integration to balance high removal efficiency with energy recovery. Oil-water separators now target 95% separation thresholds, boosting demand in petrochemical belts along the Yangtze. Metal-recovery skids, still niche, benefit from electronics manufacturers reclaiming gold and palladium worth USD 1,000–3,000/ton, providing ancillary returns that offset capex.
Digitalized control modules, although a small slice of the China water and wastewater treatment technology market size, synchronize pump curves and blower speeds, shaving 12–18% off energy bills. Disinfection units pivot toward UV-LED clusters that eliminate chlorine transport hazards and avoid carcinogenic byproducts. As PPP contracts shift to performance-based remuneration, operators bundle membranes with sensors and cloud dashboards to lock in after-sales revenue, thus elevating lifetime value per installation.

By End-User Industry: Municipal Dominance Faces Food & Beverage Disruption
Municipal utilities commanded 36.82% of the China water and wastewater treatment technology market size in 2025, anchored by urban coverage targets that now exceed 70% population connectivity. Upgrades from Class 1 B to Class 1 A effluent drive retrofits toward MBR and energy-neutral digestion lines. Yet, food and beverage sites post the fastest 9.30% CAGR as export-oriented processors chase pharmaceutical-grade water to satisfy overseas audits. Breweries and dairy plants adopt anaerobic membrane digesters that slash chemical oxygen demand while yielding power offsets covering 25% of plant electricity.
In chemical parks, zero-liquid-discharge clusters absorb high-recovery evaporators paired with crystallizers to meet 95% water-reuse mandates. Hospitals accelerate deployment of membrane-based nanofiltration to achieve 99.9% pathogen attenuation. Oil-and-gas fields invest in produced-water softening units, reusing over 90% of treated flows for enhanced-oil-recovery injections, reinforcing circular resource trends in the China water and wastewater treatment technology market.
Geography Analysis
Eastern provinces—Guangdong, Jiangsu, and Zhejiang—collectively generated a significant share of the China water and wastewater treatment technology market size in 2025, supported by export-oriented industry clusters and stringent discharge norms. Semiconductor fabs in Suzhou and Nanjing escalate ultrapure-water installation counts, while Shenzhen’s carbon-net-zero pledges raise demand for energy-efficient digester retrofits.
Central provinces such as Henan, Hubei, and Hunan witness industrial migration from coastal areas. PPP incentives, lower land costs, and newly streamlined environmental approvals shrink project lead times by 20–30% and elevate market attractiveness. Waste-to-resource projects in these provinces recover nutrients for regional grain belts, forging industrial-agricultural symbiosis.
Western provinces struggle with lower tariffs and limited financing channels, yet targeted subsidies under the Western Development Strategy propel mining and coal-chemistry wastewater projects. Modular skids suited for remote, high-altitude locales gain traction, as do solar-coupled reverse-osmosis units that hedge against grid unreliability. Overall, geographic dispersion ensures the China water and wastewater treatment technology market remains opportunity-rich, but technology mix and financing structures diverge widely by region.
Value Chain Analysis
The value chain in China water and wastewater treatment (WWT) technology starts upstream with raw materials and component supply, including polymer and ceramic media, specialty chemicals, sensors and instrumentation, pumps and blowers, and imported high-end parts (notably premium reverse osmosis membranes and energy-recovery devices). Midstream participants include domestic and international OEMs that assemble treatment skids and packaged systems (MBR, RO, evaporation-crystallization, AOP), followed by EPC contractors that integrate civil works, electrical, and automation. Downstream execution focuses on municipal and industrial end users through PPP-driven tenders and industrial-park procurement, where O&M providers monetize long-duration service contracts through performance-linked payments.
Project economics increasingly shift from one-time equipment capex to lifecycle value through commissioning, consumables (membrane replacement, media, UV modules, dosing chemicals), spare parts, digital monitoring, and contracted O&M. A common project split cited for the sector is roughly 40-45% equipment supply, 25-30% installation and commissioning, and 25-30% aftermarket consumables and replacement parts, keeping supplier margins tied to long-term plant uptime and fouling control. Import reliance for core premium components raises lead-time and cost exposure for high-spec segments such as ultrapure water and ZLD, which reinforces the need for localization partnerships and domestic capacity build-out for critical membranes and energy-efficiency modules.
Competitive Landscape
The China water and wastewater treatment technology market exhibits moderately fragmented concentration. Domestic champions Beijing OriginWater and Beijing Enterprises Water Group exploit government rapport and low-cost manufacturing to anchor municipal PPP bids, while international heavyweights Veolia, Xylem, SUEZ, and DuPont capture ultrapure-water and high-end membrane niches. Joint ventures proliferate: Veolia’s partnership with Shandong-based Jingshui delivers French oxidation know-how via local fabrication, trimming landed cost by 18%. Technology packages now bundle OT cybersecurity, predictive maintenance, and resource-recovery analytics, creating sticky service revenues that dilute pure-capex competition.
Digital platforms differentiate entrants; firms offering cloud dashboards with real-time energy and chemical optimization secure multiyear service annuities worth 8–10% of project value. Fragmentation persists in low-tier equipment, but high-barrier segments such as ceramic membranes, electrode-deionization, and AnMBR units see consolidation around fewer than ten suppliers. White-space innovators integrate AI-driven sludge digesters that improve gas yield by 12% and lower polymer usage by 15%, attacking pain points of older municipal plants. Taken together, the China water and wastewater treatment technology market shows a moderate concentration level with increasing premium on integrated, digital-ready offerings.
China Water And Wastewater Treatment (WWT) Technology Industry Leaders
-
Beijing Enterprises Water Group Limited (BEWG)
-
DuPont
-
Veolia
-
Xylem
-
Ecolab Inc.
- *Disclaimer: Major Players sorted in no particular order
Market Opportunities and Future Outlook
Standardization and enforcement for industrial-park wastewater are tightening around clearer technical pathways, which creates whitespace for suppliers that package compliance into replicable, modular deployments. The Ministry of Ecology and Environment released HJ 945.4-2026 (June 2026), a technical guide for setting water pollutant emission standards for centralized sewage treatment facilities in industrial parks, supporting demand for robust pretreatment, high-recovery membrane trains, and advanced oxidation where influent variability and trace pollutants increase performance risk. In parallel, the May 2024 Water Saving Regulation (State Council Order No. 776) elevates wastewater reuse and tiered pricing into operating requirements, supporting investments in water reuse, deionized polishing for manufacturing, and retrofits that reduce net freshwater intake.
Opportunities also cluster around asset management and operational resilience, especially for utilities and large industrial operators facing tighter monitoring and maintenance obligations. The State Council issued the Water Supply Regulation (Order No. 831) in February 2026 (effective June 1, 2026), strengthening monitoring and facility maintenance requirements, which increases addressable spend on process control, instrumentation, and O&M-oriented upgrades alongside core treatment equipment. Policy attention to pollution and carbon synergy is also visible in the MEE call in May 2026 for advanced water pollution prevention technologies for the 2026 National Directory of Pollution Prevention Technology, which supports demand for energy-efficient aeration, anaerobic digestion with biogas utilization, and automation that can document performance and emissions outcomes as part of project acceptance and financing.
Recent Industry Developments
- April 2026: Beijing Enterprises Water Group Limited (BEWG) reported that it operated 1,141 water treatment plants with a combined daily design capacity of 34,086,302 tons per day as of year-end 2025. The disclosure highlights the scale of installed assets under professional operators, supporting ongoing demand for retrofit-driven equipment replacement, consumables, and O&M optimization across a large, standardized fleet.
- September 2025: DuPont signed an agreement to acquire Sinochem (Ningbo) RO Memtech Co., Ltd. to establish a local manufacturing base for FilmTec reverse osmosis membranes in Zhejiang Province. Local production supports supply assurance and lead times for high-end membrane deployments tied to ZLD and ultrapure-water projects, where procurement schedules and performance specifications are tight.
- June 2024: China implemented the Water Saving Regulation (State Council Order No. 776), mandating industrial water recycling, wastewater reuse, and tiered water pricing mechanisms. The regulation broadens the addressable market for reuse-centric treatment trains and monitoring solutions by making water-efficiency outcomes a procurement requirement rather than an optional upgrade.
Research Methodology Framework and Report Scope
Market Definition and Coverage
This market covers the value of technologies and related systems used to treat water and wastewater in China, from intake and pretreatment through core treatment steps and discharge or reuse, as purchased for municipal and industrial applications.
Scope exclusions: We do not count upstream water supply network buildout (pipes and distribution only), or general civil construction costs that are not specific to treatment process technology.
Segmentation Overview
- By Equipment Type
- Treatment Equipment
- Oil/Water Separation
- Suspended Solids Removal
- Dissolved Solids Removal
- Biological Treatment
- Metal Recovery
- Disinfection/Oxidation
- Others
- Process Control Equipment and Pumps
- Treatment Equipment
- By End-user Industry
- Municipal Water and Wastewater Treatment
- Food and Beverage Industry
- Pulp and Paper Industry
- Oil and Gas
- Healthcare Industry
- Poultry and Aquaculture
- Chemical Industry
- Other Industries
Data Sources, Market Sizing, and Validation
Desk Research
Desk research was used to map the demand pool and the policy and compliance context that drives investments in treatment upgrades. We reviewed public sources such as the Ministry of Ecology and Environment publications, the Ministry of Water Resources releases, National Bureau of Statistics data series, and the China Statistical Yearbook for water use and wastewater discharge indicators. We also referenced standards and targets available from government portals and municipal bulletins, which helped us interpret why certain technologies get adopted faster.
To anchor technology-level assumptions, we also checked sources such as academic journal articles on treatment performance, patents and technology filings, and customs or trade statistics where equipment movement is visible. Company annual reports, investor presentations, and reputable press were used to understand capacity additions, project wins, and pricing direction. Where needed, a paid subscription for company financials and a patent database was used to speed up cross-checks of revenue exposure and technology focus. These source examples are illustrative rather than exhaustive, and many other public documents were also used for collection, validation, and clarification.
Primary Interviews and Surveys
Primary work focused on validating the demand signals behind municipal and industrial spend, and on stress-testing assumptions used in the model. We spoke with a mix of equipment suppliers, EPC and O&M participants, engineering consultants, and buyer-side stakeholders. Input was balanced across major regions in China to reflect differences in regulation and industrial mix.
The respondent feedback was used to narrow gaps between capacity expansion announcements and the portion of project budgets that should be counted as treatment process technology.
Distribution of primary research fieldwork respondents
| Company type | Respondent position |
|---|---|
| Top tier: 36% | CXOs: 17% |
| Mid tier: 42% | Functional/Unit leaders: 39% |
| Smaller Players: 22% | Managers: 44% |
Market-Sizing & Forecasting
Sizing starts from a top-down build that translates China water withdrawal, wastewater generation, and treatment coverage signals into an addressable technology spend pool, and then links that pool to typical technology mixes used in municipal plants and industrial treatment trains. To keep the model practical, we used a small set of inputs that can be checked repeatedly, such as wastewater discharge volumes, treatment rate and reuse targets, capex intensity per added treatment capacity, operating cost direction for energy and chemicals, and adoption levels for advanced steps like membrane filtration and tertiary treatment.
The total was corroborated using selective bottom-up approximations, mainly by comparing sampled project budgets, supplier revenue exposure to China, and observed pricing ranges for key equipment packages, which helped us adjust for underreported projects and timing gaps. When a specific technology spend could not be observed cleanly, proxies were applied using capacity additions and typical bill-of-process shares, and the assumptions were then refined through expert feedback.
For forecasting, scenario analysis was used because spending is sensitive to regulatory enforcement, municipal financing, and industrial compliance cycles. Growth rates for key drivers were set using a mix of time series trends and the direction shared by interviewees, and then we applied the resulting outlook to the technology spend pool so the forecast stays traceable to real indicators.
Data Validation & Update Cycle
Model outputs were checked against independent signals such as published treatment capacity additions, publicly announced project pipelines, and changes in wastewater discharge and compliance indicators. If a variance was too wide, we revisited the input assumptions, re-checked the conversion factors, and followed up with sources to confirm whether timing, scope, or pricing was causing the gap.
Before sign-off, the work goes through multiple analyst reviews, including logic checks for year-on-year jumps, unit consistency, and currency handling. Reports are refreshed annually, and interim updates are made when there are material policy shifts, major project program announcements, or visible price shocks. Right before delivery, a final review pass is completed so clients receive the most current view possible.
Mordor Intelligence's China Water and Wastewater Treatment Wwt Technology Market Size Compared Against Other Published Estimates
Published market sizes for this space can look far apart because teams do not always count the same spending lines and they may not anchor the model to the same demand signals. In practice, the differences often come from what is treated as technology spend versus general construction, which year is used for currency and pricing, and how fast advanced treatment adoption is assumed to rise.
Capacity expansion announcements, wastewater discharge indicators, and treatment coverage signals are the evidence points that keep Mordor Intelligence aligned to a technology-only spend pool for China, which avoids inflating the number with broader water infrastructure and non-process civil works. Some estimates also mix equipment-only scopes with wider solution bundles, or they apply upgrade rates without checking municipal budget cycles and industrial compliance timing.
Benchmark comparison
| Source | Market Size | Gaps in Research Methodology |
|---|---|---|
| Mordor Intelligence | USD 16.07 B (2025) | |
| Global Consultancy A | USD 11.15 B (2024) | Uses an earlier base year and a tighter capture of treatment technology, which can leave out portions of municipal upgrade spending and some advanced treatment packages priced into newer projects. |
| Industry Research Group B | USD 1.79 B (2024) | Looks limited to primary treatment equipment only, so secondary and tertiary steps, reuse systems, and broader wastewater technology spending are excluded, which naturally produces a much smaller total. |
The spread mainly reflects scope boundaries and year alignment rather than a simple disagreement on growth. By tying the sizing steps to observable volume and capacity signals, and then pressure-testing pricing and adoption through interviews, our estimate stays transparent and repeatable for buyers who need a number they can trace back to clear drivers.
Key Questions Answered in the Report
What is the current value of the China water and wastewater treatment technology market?
The market is valued at USD 17.39 billion in 2026 with an 8.20% CAGR through 2031.
Which segment holds the largest share within Chinese treatment equipment?
Treatment equipment dominates with 90.02% share, largely due to membrane bioreactors and advanced oxidation units.
Which end-user sector is growing fastest?
Food and beverage sites post a 9.30% CAGR as export standards demand ultrapure and nutrient-recovery systems.
How are ZLD mandates influencing technology choices?
ZLD rules enforce 95% water recovery, pushing facilities toward multistage RO, evaporation, and ceramic membranes.
Why is ultrapure-water demand rising in China?
Expansion of semiconductor fabs and EV battery plants requires resistivity above 18 megohm-cm, creating high-margin opportunities for specialty providers.
What factors shape regional investment patterns?
Eastern provinces benefit from stricter regulations and higher tariffs, while central regions gain from industrial relocation and PPP incentives.