
Market Overview
| Study Period | 2019 - 2031 |
|---|---|
| Forecast Data Period | 2026 - 2031 |
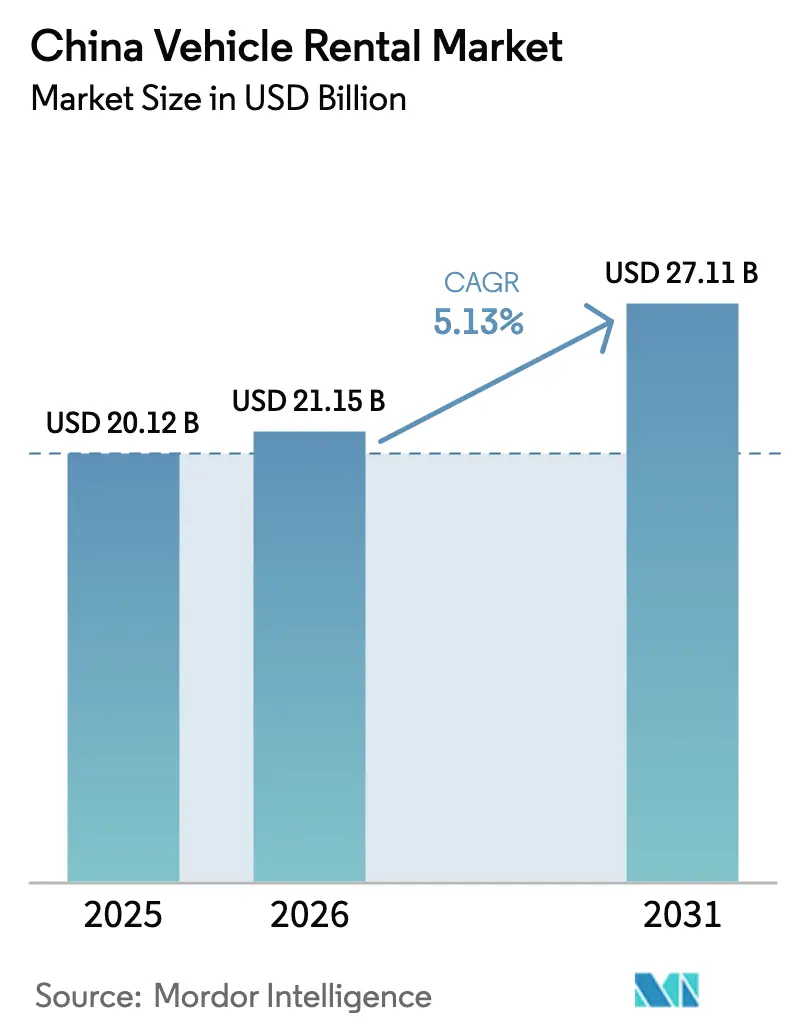
| Base Year Market Size (2025) | USD 20.12 Billion |
| Market Size (2026) | USD 21.15 Billion |
| Market Size (2031) | USD 27.11 Billion |
| Growth Rate (2026 - 2031) | 5.13 % |
| Market Concentration | Medium |
Major Players *Disclaimer: Major Players sorted in no particular order Image © Mordor Intelligence. Reuse requires attribution under CC BY 4.0. | |
China Vehicle Rental Market Analysis by Mordor Intelligence
The China vehicle rental market size was valued at USD 20.12 billion in 2025 and is estimated to grow from USD 21.15 billion in 2026 to reach USD 27.11 billion by 2031, at a CAGR of 5.13% during the forecast period (2026-2031). Leisure and tourism applications retain more than half of total revenue as domestic travel rebounds, while the online channel’s 63.78% share underscores a sustained shift to digital booking. Self-driven demand continues to dominate, yet battery-electric fleet penetration is accelerating on the back of zero-emission zone mandates. Passenger cars remain the core asset class, but light commercial vehicles are carving out niches in last-mile logistics. Competition is tight, with incumbent scale, data capabilities, and electrification strategies emerging as key differentiators.
Key Report Takeaways
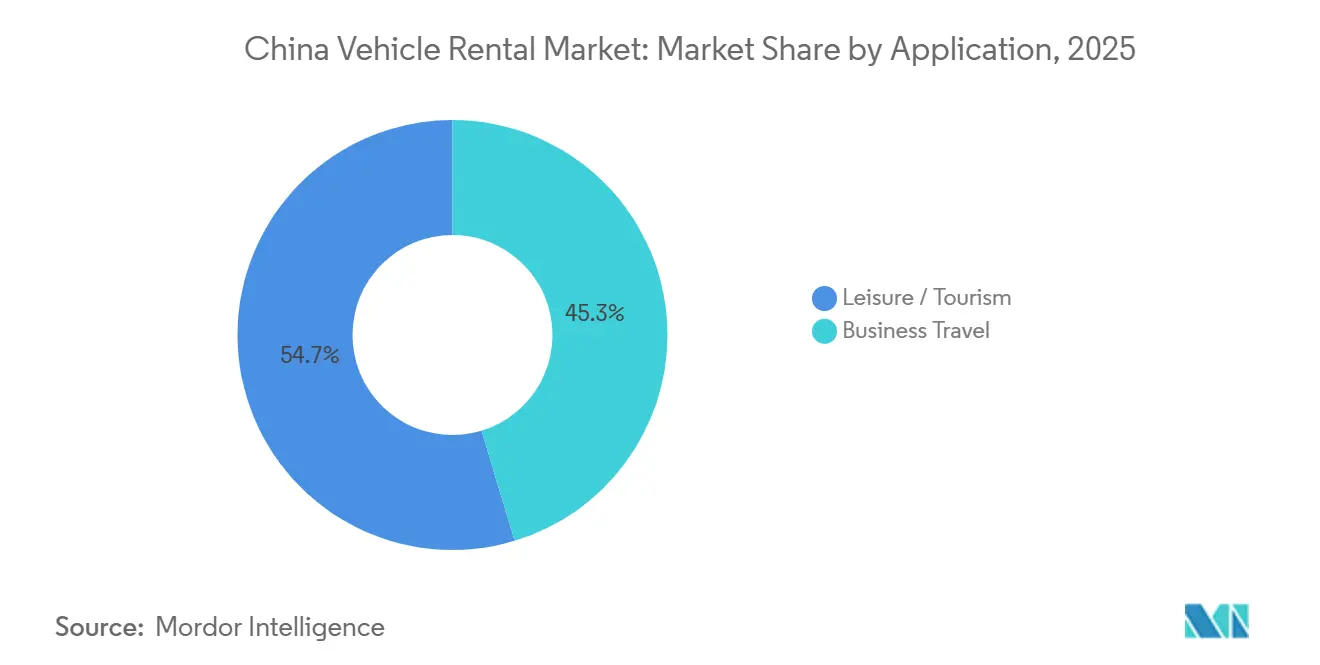
- By application, leisure and tourism accounted for 54.67% of the Chinese vehicle rental market share in 2025 and are forecast to grow at a 7.59% CAGR through 2031.
- By booking type, online platforms accounted for 63.78% revenue share in 2025 and are set to register the fastest projected CAGR at 8.29% through 2031.
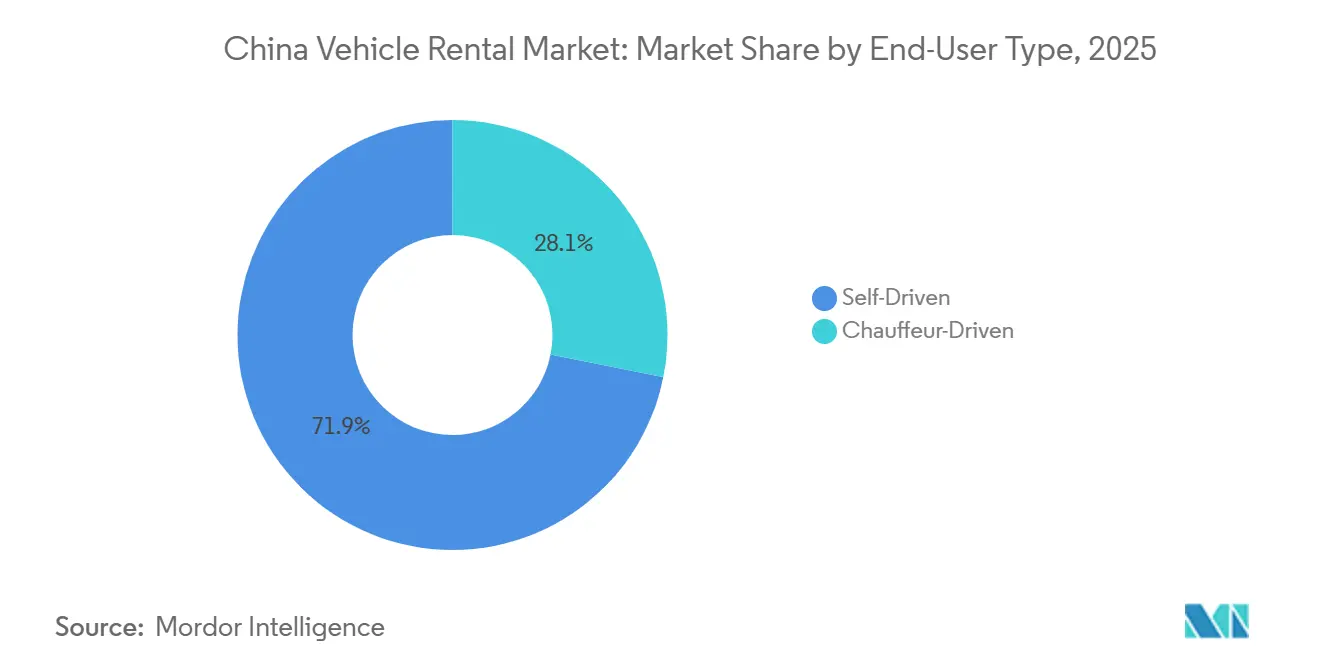
- By end-user type, self-driven customers accounted for 71.87% of the China vehicle rental market size in 2025, and are forecast to grow at an 8.03% CAGR through 2031.
- By vehicle type, passenger cars accounted for 48.59% of the Chinese vehicle rental market share in 2025 and are forecast to grow at a 6.92% CAGR through 2031.
- By powertrain, internal combustion engine models accounted for 72.89% of the China vehicle rental market share in 2025, while battery-electric vehicles are forecast to grow at a 10.57% CAGR through 2031.
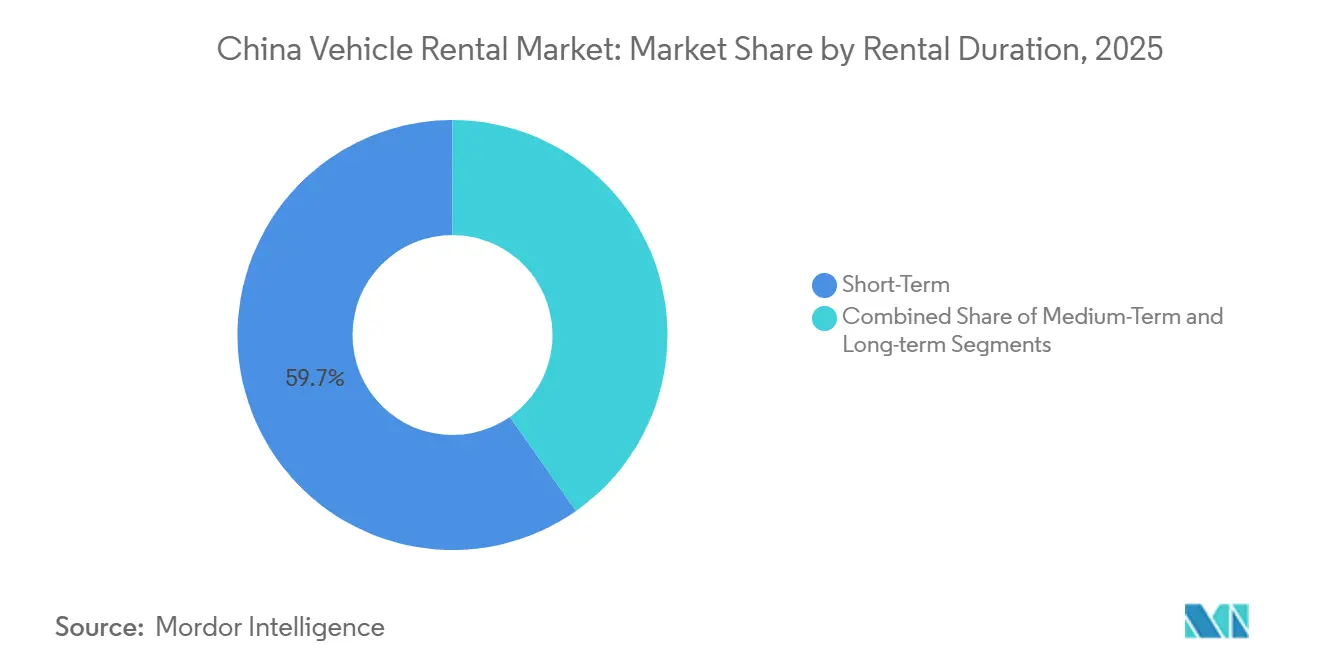
- By rental duration, short-term rentals accounted for 59.73% of the China vehicle rental market share in 2025; long-term rentals are expected to rise at a 7.01% CAGR through 2031.
- By service channel, off-airport and downtown locations accounted for 67.83% of the China vehicle rental market share in 2025 and are expected to rise at an 8.44% CAGR through 2031.
- By region, East China accounted for 38.47% of the China vehicle rental market share in 2025, and West China is expected to rise at a 7.02% CAGR through 2031.
Note: Market size and forecast figures in this report are generated using Mordor Intelligence’s proprietary estimation framework, updated with the latest available data and insights as of January 2026.
Market Trends and Insights
Drivers Impact Analysis of China Vehicle Rental Market*
| Driver | (~)% Impact on CAGR Forecast | Geographic Relevance | Impact Timeline |
|---|---|---|---|
| Domestic Tourism Rebound | +1.8% | East China, South-Central China, West China | Short term (≤ 2 years) |
| License-Plate Quotas in Tier-1 Cities | +1.5% | Beijing, Shanghai, Guangzhou, Shenzhen, Tianjin | Medium term (2-4 years) |
| Digital and Mobile Booking Platforms | +1.2% | National, with early gains in East China, South-Central China | Short term (≤ 2 years) |
| Licensed-Driver Middle Class | +1.0% | National, concentrated in East China, South-Central China | Long term (≥ 4 years) |
| Fleet-Electrification Mandates | +0.8% | Beijing, Shanghai, Shenzhen, Guangzhou | Medium term (2-4 years) |
| Corporate ESG Targets | +0.5% | National, with early adoption in East China | Long term (≥ 4 years) |
| Source: Mordor Intelligence | |||
Domestic Tourism Rebound Fuels Leisure Rentals
Domestic trips hit 3.28 billion in H1 2025 (+20.6% YoY), per China’s Ministry of Culture and Tourism reporting via the State Council portal, which directly enlarged demand for self-drive vacations[1]. Holiday peaks delivered utilization rates above 85% in scenic regions, while off-peak occupancy prompted dynamic-pricing adoption to balance yield. Flexible itineraries and ongoing hygiene concerns keep private car use preferred over group tours. Government promotion of rural revitalization and “red tourism” is driving travel flows into lower-tier cities, compelling operators to expand their service footprints. The dispersion strategy requires investment in roadside assistance and maintenance networks to uphold service levels outside core hubs.
License-Plate Quotas in Tier-1 Cities Spur Rental Demand
Beijing will issue 100,000 passenger-vehicle quotas in 2025, including 80,000 for new-energy vehicles (NEVs), which will intensify scarcity for internal-combustion registrations[2]. Firms with large, commercially plated fleets offer immediate mobility, securing a competitive moat in quota-constrained centers. However, cross-provincial restrictions hamper fleet rebalancing when vehicles transit disparate regulatory zones. Operators must therefore maintain redundant fleets to meet urban peak demand while absorbing idle risk elsewhere.
Shift to Digital and Mobile Booking Platforms
Digital channels accounted for over 60% of transactions in 2024, with leading operators recording mobile contributions above 80%. Super-app integrations enable bundled flight, hotel, and vehicle reservations, boosting average order values. AI-powered recommendation engines match pricing to demand spikes, optimizing revenue per available car. Reduced acquisition cost relative to physical counters improves margins, though compliance spending under China’s data-protection regime is rising. The digital pivot is rewriting competitive boundaries as nimble, tech-forward players gain scale without equivalent brick-and-mortar expansion.
Growing Licensed-Driver Middle Class
China reported over 500 million licensed drivers by the end of November 2022; authorities had previously reported average net increases of roughly 25 million drivers per year. Rising disposable income in tier-2 and tier-3 cities is driving conversions from licenses to active rentals, especially among 25- to 40-year-olds who prioritize experience over ownership. Membership programs and loyalty rewards enhance retention, while flexible durations help align with budgets. The slowing issuance of new licenses points to market maturation, forcing brands to differentiate through service quality and digital convenience. Competition from ride-hailing and micro-mobility options intensifies the fight for wallet share, reinforcing the need for price segmentation and targeted promotions.
Restraints Impact Analysis of China Vehicle Rental Market*
| Restraint | (~)% Impact on CAGR Forecast | Geographic Relevance | Impact Timeline |
|---|---|---|---|
| Ride-Hailing and Robotaxi Substitution | -1.2% | Beijing, Guangzhou, Shenzhen, Shanghai, Wuhan | Medium term (2-4 years) |
| Vehicle Acquisition and Financing Costs | -0.8% | National | Short term (≤ 2 years) |
| EV Residual-Value Uncertainty | -0.5% | National, acute in East China, South-Central China | Medium term (2-4 years) |
| Plate-Quota Volatility | -0.3% | Beijing, Shanghai, Guangzhou, Tianjin, Hangzhou | Short term (≤ 2 years) |
| Source: Mordor Intelligence | |||
Ride-Hailing & Robotaxi Substitution Risk
Baidu reported obtaining pilot commercialization qualifications across multiple cities, including Beijing, Shanghai, Shenzhen, Chongqing, Wuhan, Changsha, Hefei, Wuzhen, and Yangquan. On-demand convenience without parking costs appeals to urban travelers, diverting traffic from short-term rentals. Incumbents respond by embedding chauffeur options into apps and forging cross-selling agreements with ride-hailing leaders. While regulatory approvals for fully driverless operations remain confined, rapid tech maturation positions robotaxis as a medium-term disruptor, compelling rental firms to accelerate electrification and invest in differentiated service experiences.
Rising Vehicle Acquisition & Financing Costs
Semiconductor constraints and raw-material inflation continue to push up procurement prices, squeezing fleet-refresh margins. Higher interest rates elevate financing expenses, slowing aggressive expansion strategies. Operators renegotiate volume discounts and prolong holding periods, yet residual-value risk mounts, particularly for internal-combustion assets that face accelerating depreciation. Capital-efficient models such as asset-light franchising and third-party leasebacks surface as alternative paths to maintain growth.
*Our forecasts treat driver/restraint impacts as directional, not additive. The impact forecasts reflect baseline growth, mix effects, and variable interactions.
China Vehicle Rental Market Segment Analysis
By Application:
Leisure Demand Surges While Corporate Rentals Stabilize MarginsLeisure and tourism accounted for 54.67% of the 2025 turnover, and the segment is forecasted to grow at a 7.59% CAGR as holidaymakers favor flexible itineraries and self-drive exploration. This strength mitigates the pandemic's aftereffects and underscores the cultural shift toward experiential consumption. Seasonal rental spikes, however, stretch fleet capacity during Golden Week and summer peaks, prompting operators to deploy dynamic pricing and cross-regional vehicle transfers. Business travel remains a counter-cyclical pillar, contributing to stable weekday utilization and higher average spend per booking, driven by premium car categories and ancillary insurance.
Corporate demand also reinforces the size of the Chinese vehicle rental market during off-season periods, sustaining asset productivity when leisure volumes decline. Enterprises increasingly bundle long-term contracts across multiple cities to standardize employee mobility and lock in predictable income streams. Both sub-segments will coexist as twin engines; however, leisure growth outpaces corporate expansion in absolute volume, reshaping the fleet mix toward compact passenger cars and crossover SUVs that align with family trip preferences.
By Booking Type:
Online Dominance DeepensOnline reservations captured 63.78% of overall transactions in 2025 and are projected to grow at an 8.29% CAGR, driven by frictionless in-app experiences and integrated payment ecosystems. The digital interface provides real-time inventory visibility, boosts add-on sales, and supports algorithmic pricing to improve yield management. User reviews and loyalty programs further increase switching costs, reinforcing platform stickiness.
Offline channels accounted for the remainder and persist primarily at airport counters and tier-3 city storefronts, where digital adoption lags. Walk-in customers value face-to-face support for insurance clarification and last-minute changes, benefits not always replicable online. The blended mobile check-in strategy at physical outlets exemplifies convergence. Over the horizon, physical touchpoints will likely transition toward vehicle-handover nodes rather than booking centers, cutting fixed overhead without abandoning personal service.
By End-User Type:
Self-Driven Core, Chauffeur UpsideSelf-driven rentals accounted for 71.87% of the market in 2025 and are expected to post an 8.03% CAGR, driven by autonomy, privacy, and cost efficiency. Younger renters appreciate seamless app journeys and digital key handovers that reduce counter time. Vehicle telematics enable real-time monitoring of mileage and driving behavior, lowering damage-related disputes and insurance losses. Social media word of mouth accelerates acquisition, effectively lowering marketing spend per customer.
Chauffeur-driven services, while smaller, are growing faster among executives, senior citizens, and inbound tourists. Premium positioning supports higher daily rates and cross-sell of concierge services. Labor shortages, however, inflate driver wages in tier-1 cities, putting pressure on margins. Partnerships with ride-hailing platforms can unlock flexible driver supply, but regulatory clarity on employment classification remains pivotal. Autonomous technology may erode chauffeur growth in the long term, yet near-term demand for high-touch service sustains the niche.
By Vehicle Type:
Passenger Cars Anchor Revenue, LCVs Address Logistics GapsPassenger cars, which accounted for 48.59% of the 2025 market size and posted a 6.92% CAGR, serve both leisure travelers and commuting professionals, reinforcing stable utilization across weekdays and weekends. Standardized maintenance procedures and robust resale markets support asset rotation and residual value protection. Sedan and SUV diversification introduces upselling levers without drastically broadening spare-parts inventory.
Light commercial vehicles appeal to courier and e-commerce operators who need temporary capacity during promotional surges. This sub-segment, although lower, commands rising rates, which cushion total fleet revenue. Medium and heavy-duty rentals fulfill construction projects and group tour demand but require specialized maintenance, limiting rapid scaling. Pilot deployments of electric delivery vans in last-mile zones offer incremental income while advancing decarbonization commitments.
By Powertrain:
BEV Momentum Accelerates Structural ShiftIn 2025, internal-combustion engines accounted for 72.89% of the active fleet, but battery electric vehicles are projected to grow at a 10.57% CAGR (2026-2031), the fastest among powertrain categories, underpinning substantial future share capture. Municipal zero-emission zones grant BEVs privileged access, increasing asset turn and utilization. Reduced energy cost per kilometer further enhances lifecycle economics, compensating for higher acquisition prices.
Hybrid electric vehicles stand as transitional options, balancing range flexibility with lower emissions. Operators increasingly trial battery-swap models that decouple battery ownership, mitigating residual-value risk. China’s charging network has scaled rapidly; public charging facilities were about 4.63 million by the end of November 2025 (National Energy Administration), which improves user confidence and reduces range anxiety. ICE demand persists on inter-provincial routes with sparse charging infrastructure, but policy headwinds suggest an inevitable decline.
By Rental Duration:
Short-Term Volume Meets Long-Term VisibilityShort-term contracts (1 week or less) accounted for 59.73% revenue in 2025, fueled by weekend leisure and business trips. High daily rates and rapid asset turnover uplift margins but expose operators to seasonal volatility. Dynamic discounting and loyalty perks temper occupancy troughs, yet surge-season fleet constraints persist. Long-term rentals (over 1 month) are growing at a 7.01% CAGR as companies seek off-balance-sheet mobility aligned with ESG goals.
Subscription offers featuring maintenance, telematics, and carbon reporting secure predictable cash flows, stabilizing the China vehicle rental market size throughout the year. Medium-term hires bridge relocation and project-based demand, enabling yield optimization that would otherwise be lost to idle stock. Balancing fleet allocation across durations thus becomes a critical revenue-management lever.

By Service Channel:
Off-Airport Sites Expand AccessOff-airport outlets, encompassing downtown branches and neighborhood pickup points, accounted for a 67.83% share in 2025 and are expanding at an 8.44% CAGR. Lower occupancy costs and smartphone-enabled instant reservations underpin the channel’s ascendance. Consumers appreciate proximity and the ability to avoid airport surcharges and parking congestion. Airport counters remain valuable for inbound travelers, but they face concession fees and competition from ride-hailing services.
Bundled airline partnerships and loyalty integrations attempt to defend share, yet off-airport convenience proves compelling as high-speed rail broadens domestic mobility choices. Hybrid models that allow airport pickup with off-airport return optimize asset repositioning and fee exposure, signaling that channel strategies will increasingly prioritize network efficiency over legacy location prestige.
Geography Analysis
East China, encompassing Shanghai, Zhejiang, and Jiangsu, accounted for 38.47% of the 2025 revenue. Dense tourism corridors, elevated disposable incomes, and a flourishing corporate base underpin consistent rental demand. High-speed rail connectivity promotes multi-city self-drive loops, amplifying average rental duration. Digital adoption rates in the Yangtze Delta also accelerate online penetration, reinforcing operating leverage for platform-centric providers. Fleet electrification outpaces national averages, driven by aggressive municipal incentives and the expansion of supercharger presence.
South-Central China's growth is propelled by Guangdong’s export manufacturers and Shenzhen’s tech start-ups. Business travel maintains weekday occupancy, while weekend leisure in Hunan’s scenic zones augments seasonal peaks. The Greater Bay Area framework facilitates cross-border movement, supporting intra-city returns that enhance utilization. However, ride-hailing density in megacities introduces competitive friction, prompting rental firms to bundle chauffeur and self-drive packages.
West China posts the fastest CAGR of 7.02% through 2031. Infrastructure upgrades in Sichuan, Chongqing, and Yunnan unlock eco-tourism and adventure routes. Mountainous terrain favors four-wheel-drive and electric SUVs, compelling operators to diversify fleet composition. Lower-tier city expansion offers blue-ocean opportunities, albeit with logistical challenges related to maintenance coverage and spare parts availability. Regional governments’ tourism promotion grants help offset setup costs, accelerating footprint build-out. Meanwhile, North China remains pivotal due to Beijing’s administrative influence and Tianjin’s port economy, yet strict plate quotas curb private car ownership, bolstering rental substitution.
Regulatory Landscape
China regulates small and micro passenger vehicle rental through filing and operating requirements under the Ministry of Transport framework, including the Administrative Measures for the Operation and Service of Small and Micro Passenger Car Rental (2020 Order No. 22). Service standardization tightened with the implementation of the national standard GB/T 29911-2025 on November 1, 2025, which sets requirements for rental operators, vehicles, personnel, service processes, and platform management.
In June 2026, the Ministry of Transport, together with multiple departments, released the Three-Year Action Plan (2026-2028) for high-quality development of small and micro passenger vehicle rental. It focuses on network coverage at airports and high-speed rail stations and improving service accessibility. In the same month, the Ministry of Commerce and other departments issued measures to cultivate automotive aftermarket consumption, explicitly encouraging rental-industry integration through models such as rent-to-own (以租代购) and cross-city vehicle return (异地还车), which provides support for broader networks and more interoperable operations.
Value Chain Analysis
The value chain begins with vehicle sourcing and financing (OEM procurement, dealer channels, financial leasing, and fleet financing). It then moves into fleet onboarding, covering registration and compliance filings, insurance, and telematics installation, before shifting to network operations across airports, high-speed rail nodes, and off-airport or downtown pickup points. Rental operators and platforms, including CAR Inc. and eHi, typically integrate fleet acquisition, digital booking, and risk controls such as ID and driver verification and deposits or credit, along with aftersales activities like maintenance, roadside assistance, and remarketing of de-fleeted vehicles.
Electrification is changing upstream and midstream linkages as rental firms connect procurement with charging and energy partners at branches. For instance, CAR Inc. signed a framework arrangement with BYD for large-scale vehicle supply tied to flash-charging station deployment at rental locations, and Xpeng delivered EVs to CAR Inc. to expand mobility-service capacity. Standards such as GB/T 29911-2025 (effective November 1, 2025) raise operational requirements for service processes and platform management, which increases the need for compliant digital systems, fleet-condition monitoring, and standardized customer service across multi-city networks.
Competitive Landscape
Competition is moderate, led by CAR Inc., eHi, and DiDi’s rental offerings for 2025 revenue. CAR Inc. leads, supported by a fleet of ~160,000 vehicles (September 2024). Its early BEV adoption secures privileged access to downtown zones. eHi Car Service follows a differentiating strategy, offering zero-deposit rentals and a 10,000-outlet footprint that enables cross-city returns, lowering repositioning costs. DiDi reported 631 million annual active users worldwide for the 12 months ended Dec 31, 2023.
Strategic priorities focus on accelerating electrification, implementing data-driven yield management, and enhancing autonomous testing. Battery-swap partnerships shorten BEV downtime, enhancing effective daily utilization. Telematics and AI pricing engines unlock granular demand insights, empowering agile fleet-rotation decisions. Incumbents also court corporate accounts with long-term, emissions-tracked subscriptions that hedge leisure seasonality.
Emerging challengers leverage asset-light models, franchising, and pure digital engagement to undercut traditional cost bases. Electric-only start-ups' position on sustainability and regulatory foresight, targeting tier-2 cities where legacy networks remain thin. Success hinges on capital access for fleet procurement, talent acquisition in software and analytics, and the depth of relationships with OEMs for preferential pricing and early access to technology.
China Vehicle Rental Industry Leaders
-
Avis Budget Group, Inc.
-
The Hertz Corporation
-
eHi Car Service (Enterprise Holdings)
-
Shouqi Car rental (Europcar Mobility Group)
-
Beijing China Auto Rental (CAR Inc.)
- *Disclaimer: Major Players sorted in no particular order

China Vehicle Rental Market Companies Covered in this Report
- Beijing China Auto Rental (CAR Inc.)
- eHi Car Service
- Shouqi Car Rental
- Avis Budget Group
- Hertz Corporation
- Shenzhen Topone Car Rental
- Didi Car Rental
- EVCard
- Gofun Travel
- Xiangdao Chuxing
- UCAR Inc.
- Zuzuche
- Caocao Mobility
- PonyCar
- T3 Go Mobility
- Shenzhou Joy Travel
- Tongcheng-Elong Car Rental
- Huizuche
- Hello Chuxing Car Rental
- Meituan Car Rental
Market Opportunities and Future Outlook
Policy-led network buildout is creating whitespace around intermodal travel nodes and cross-city mobility, which aligns with the June 2026 Three-Year Action Plan (2026-2028) emphasizing coverage at airports and high-speed rail stations and prioritizing service accessibility and network quality. The concurrent June 2026 Ministry of Commerce measures that promote rental integration via cross-city returns and rent-to-own models also support product changes, including pricing, deposits, and eligibility rules, and encourage partnerships that make multi-city rentals easier to execute.
Fleet electrification and smart-mobility capabilities also create new monetization pathways for operators that bundle vehicles, charging access, and digital operations into a more standardized service offer. CAR Inc. and BYD, for example, aligned vehicle procurement with branch-level flash-charging infrastructure rollout, and CAR Inc. signed a cooperation agreement with Huaxia Financial Leasing to support commercial rental and operation models linked to automated-driving fleets. With national service requirements already tightened by GB/T 29911-2025 (implemented November 1, 2025), operators that invest in platform governance, vehicle-condition transparency, and consistent multi-city service processes have clearer ways to compete in online-first demand and broaden their geographic footprint.
Recent Industry Developments in China Vehicle Rental Market
- July 2026: Shenzhou Zuche (CAR Inc.) signed a strategic cooperation agreement with XPeng Group covering vehicle supply and smart-travel scenario development, with a stated purchase plan of 5,000 vehicles. The tie-up strengthens EV supply assurance and brings OEM-level intelligent cockpit and connectivity capabilities closer to the rental use case.
- May 2025: Baidu Apollo and CAR Inc. (Shenzhou) announced a strategic cooperation to explore autonomous driving plus car rental scenarios. The partnership links a major autonomous driving platform with a scaled rental operator, supporting new service models that combine fleet operations with automated driving capabilities.
- September 2024: CAR Inc. reported an active fleet of around 160,000 vehicles. The scale supports procurement leverage, network density, and the ability to rebalance vehicles across regions during peak travel periods.
China Vehicle Rental Market Report Scope and Research Methodology
Market Definition and Coverage
This market covers paid vehicle rental services in mainland China where a customer gets temporary access to a road-legal vehicle for a defined period, typically ranging from a few hours up to about one month.
Scope exclusions: long-term operating leases, driver-only ride-hailing, and micromobility rentals (bikes and scooters) are excluded from this sizing.
Segments Covered in This Report
- By Application
- Leisure / Tourism
- Business Travel
- By Booking Type
- Offline Access
- Online Access
- By End-User Type
- Self-Driven
- Chauffeur-Driven
- By Vehicle Type
- Passenger Cars
- Light Commercial Vehicles
- Medium and Heavy Duty Commercial Vehicles
- Buses and Coaches
- By Powertrain
- Internal Combustion Engine (ICE)
- Hybrid Electric Vehicle (HEV)
- Battery Electric Vehicle (BEV)
- By Rental Duration
- Short-Term (Less than 1 Week)
- Medium-Term (1 Week to 1 Month)
- Long-Term (Above 1 Month)
- By Service Channel
- On-Airport
- Off-Airport / Downtown
- By Region
- East China
- South-Central China
- North China
- West China
- Northeast China
Data Sources, Market Sizing, and Validation
Desk Research
Desk research was used to set the market frame and to anchor key inputs that can be checked in public data. We leaned on sources such as the National Bureau of Statistics of China, the Ministry of Transport, the Ministry of Culture and Tourism, and CAAM association releases for direction on travel activity and vehicle trends.
To tighten assumptions, additional context was taken from company annual reports and investor presentations, press coverage from business publications, and airport and tourism authority disclosures where available. For cross-checks on fleet activity signals, we also used paid subscriptions that consolidate company financials and corporate actions, along with a patent database to understand what is being prioritized in booking technology and fleet electrification. The sources mentioned here are illustrative, and many other public references were also reviewed for collection, validation, and clarification.
Primary Interviews and Surveys
Primary work focused on rental operators, fleet managers, mobility platform managers, travel intermediaries, and corporate account buyers so we could confirm utilization patterns and pricing logic that are not always clean in public series. Since the scope is China-wide, outreach was spread across major metro areas and airport-led demand centers, and follow-up calls were used to resolve gaps around seasonality, EV mix, and chauffeur-driven share.
Distribution of primary research fieldwork respondents
| Company type | Respondent position |
|---|---|
| Top tier: 38% | CXOs: 14% |
| Mid tier: 47% | Functional/Unit leaders: 31% |
| Smaller Players: 15% | Managers: 55% |
Market-Sizing & Forecasting
Sizing is built using a top-down approach where travel and mobility demand indicators are converted into a realistic rental demand pool, and then expressed in revenue using observed pricing bands. We start from signals like domestic trips and business travel intensity, airport passenger throughput, car parc direction, and the online booking mix, which are then filtered through rental duration patterns and utilization to avoid overstating addressable demand.
Next, the totals are corroborated using selective bottom-up approximations. These include sampling average daily rates by vehicle class and duration, applying reasonable utilization ranges for airport and city fleets, and cross-checking against operator revenue disclosures where available. If data is missing for smaller cities or niche vehicle types, we fill the gap with proxy assumptions based on nearby demand hubs and then re-test the impact through sensitivity checks.
For forecasting, we used scenario analysis supported by a simple multivariate regression view of the key drivers, so the trend is not pushed by a single variable. Inputs that mattered most in this market included domestic tourism momentum, corporate travel recovery pace, EV share in rental fleets (and its effect on depreciation and pricing), airport versus off-airport mix, and seasonality around holidays. These inputs were validated in interviews before finalizing the forward curve.
Data Validation & Update Cycle
Outputs are validated through multiple checks so the numbers stay consistent with real-world operating signals. We compare the modeled market to independent indicators like travel flows, vehicle registration direction, and pricing movement, and then investigate outliers that show up by year or by demand center before sign-off.
A second analyst review is completed to test assumptions, math integrity, and year-over-year logic. Follow-up outreach is triggered if a key driver shifts or if a data point conflicts with earlier inputs. Reports are refreshed annually, with interim updates when material events occur, and a final pre-delivery pass is done so clients receive the most current view.
Mordor Intelligence's China Vehicle Rental Market Size Compared With Other Published Estimates
Published market sizes for China vehicle rental can look far apart, even when they are describing similar customer behavior, because the scope choices and revenue line items are not always aligned. The biggest differences usually come from how the rental period is defined, whether ride-hailing and leasing revenues get blended in, and how pricing and utilization are projected across airports and urban centers.
Some published figures appear to use a wider mobility definition that can implicitly mix in longer-duration leasing-style revenues and adjacent on-demand transport activity. In Mordor Intelligence, only short-term vehicle rentals in mainland China are counted (typically a few hours to about one month), and long-term operating leases, driver-only ride-hailing, and micromobility are kept out. This changes the addressable revenue pool and the growth profile.
Benchmark comparison
| Source | Market Size | Gaps in Research Methodology |
|---|---|---|
| Mordor Intelligence | USD 20.12 B (2025) | |
| Global Consultancy A | USD 13.60 B (2024) | Uses an earlier base year and appears to apply a broader growth curve without clearly separating short-term rentals from longer-duration leasing-like revenue, which can shift the starting value and inflate CAGR comparisons. |
| Industry Publisher B | USD 17.00 B (2024) | Reported as a car-rental figure with limited public detail on inclusions, currency timing, and whether airport surcharges, chauffeur-driven fees, or related services are netted or grossed, which can move the total up or down. |
The table mainly shows that year selection and scope discipline drive most of the spread, not simple arithmetic differences. By tying revenue to observable travel indicators, rental duration realities, and interview-checked pricing and utilization ranges, our estimate stays traceable to inputs that can be re-tested as the market shifts.
Key Questions Answered in the Report
How large is the China vehicle rental market in 2026?
The China vehicle rental market size is valued at USD 21.15 billion in 2026
Which segment leads revenue within Chinese vehicle rentals?
Leisure and tourism applications account for the largest revenue share, holding 54.67% in 2025 and continuing to rise on robust domestic travel momentum.
What is driving the rapid uptake of battery electric rental vehicles?
Municipal zero-emission zones, falling battery costs, and expanding super-charging and battery-swap infrastructure are pushing operators toward BEVs.
Why are off-airport rental locations growing faster than airport counters?
Mobile booking convenience, lower concession fees, and proximity to residential and business districts make off-airport outlets more attractive to renters.
Which region shows the fastest vehicle rental growth in China?
West China leads growth with a 7.02% CAGR through 2031, driven by infrastructure investment and rising middle-class mobility in Sichuan and Chongqing.