
Market Overview
| Study Period | 2020 - 2031 |
|---|---|
| Forecast Data Period | 2026 - 2031 |
| Base Year Market Size (2025) | USD 169.71 Billion |
| Market Size (2026) | USD 180.18 Billion |
| Market Size (2031) | USD 243.06 Billion |
| Growth Rate (2026 - 2031) | 6.17 % |
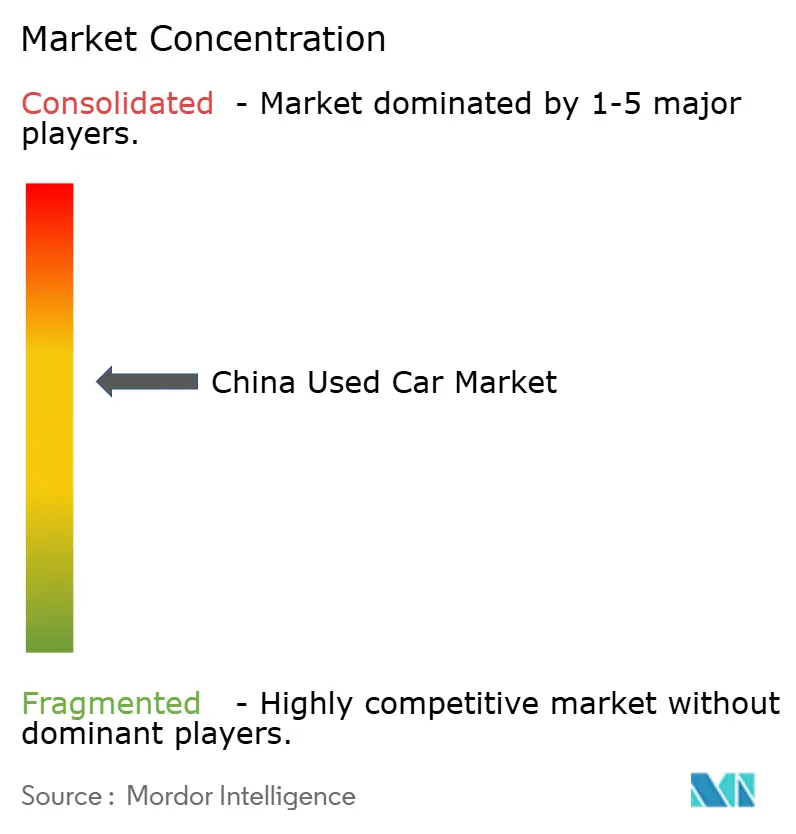
| Market Concentration | Medium |
Major Players *Disclaimer: Major Players sorted in no particular order Image © Mordor Intelligence. Reuse requires attribution under CC BY 4.0. | |
China Used Car Market Analysis by Mordor Intelligence
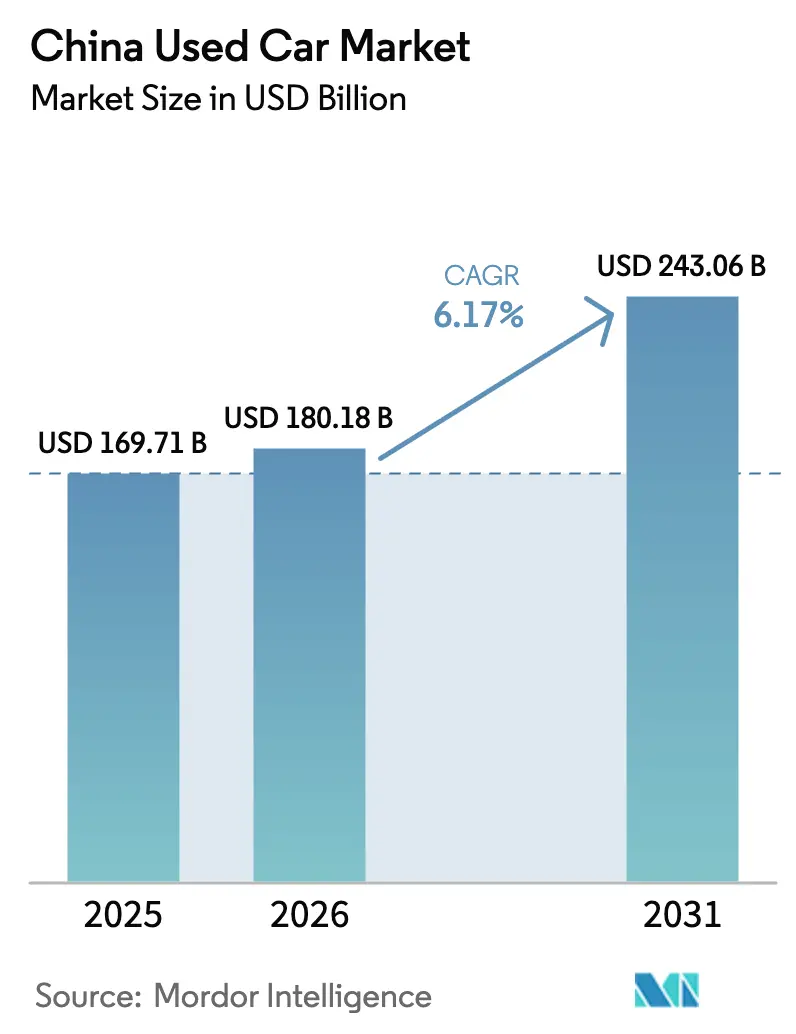
The China used car market size is expected to grow from USD 169.71 billion in 2025 to USD 180.18 billion in 2026 and is forecasted to reach USD 243.06 billion by 2031 at a 6.17% CAGR over 2026-2031. Beijing’s policy shift toward transparent inter-city transfers, expanding battery health certification, and OEM-backed certified pre-owned (CPO) programs are the pivotal growth engines. The sector is also absorbing a rising wave of nearly-new energy vehicles (NEVs) entering trade-in cycles as replacement intervals shorten. Digital platforms equipped with AI-driven residual-value forecasting compress inspection times, while blockchain-verified histories curb mileage fraud. At the same time, aggressive new-car discounting narrows the price gap between discounted new inventory and premium used stock, forcing organized vendors to differentiate through warranties and financing bundles. Sedans still headline transaction counts, yet SUVs and electric models are expanding faster, signaling that versatility and eco-credentials are reshaping shopper priorities.
Key Report Takeaways
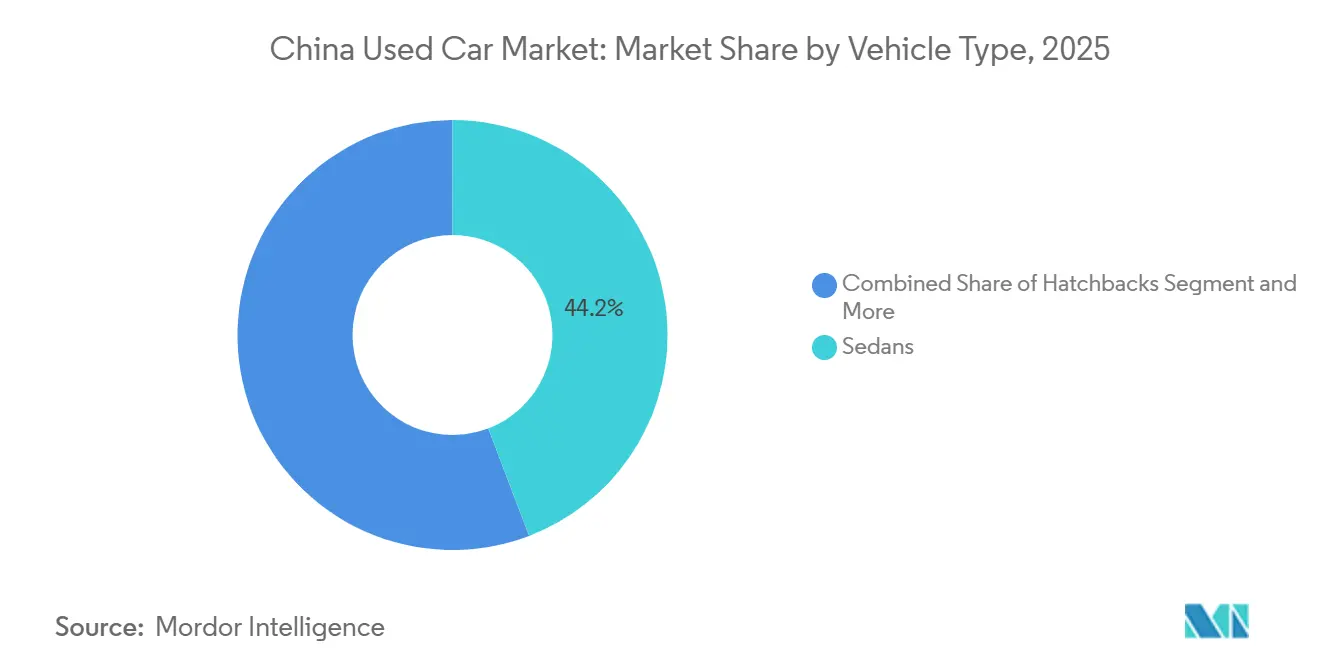
- By vehicle type, sedans commanded 44.21% of the China used car market share in 2025, while sport utility vehicles are projected to grow at a 16.21% CAGR through 2031.
- By sales channel, offline OEM-franchised dealers accounted for 32.18% of the 2025 market share 2025, whereas e-retailers are expected to scale at a 20.34% CAGR to 2031.
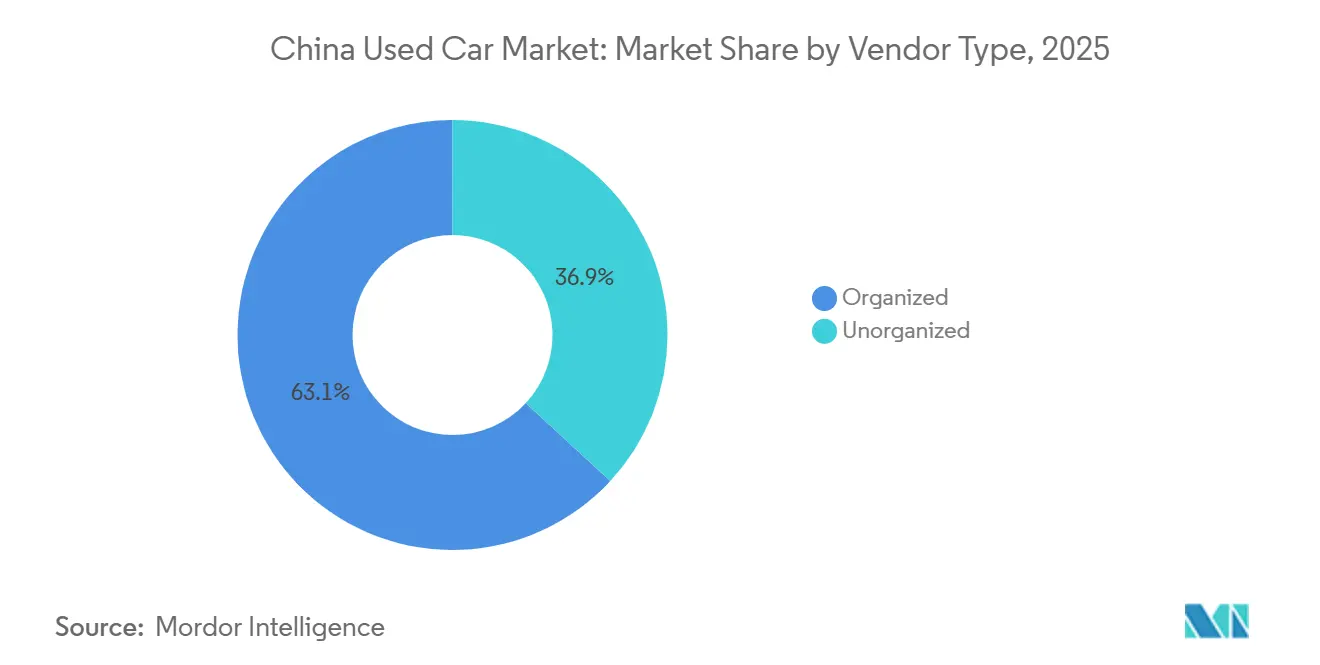
- By vendor type, organized vendors captured a 63.11% share in 2025 and are expected to grow at a 10.36% CAGR through 2031.
- By transaction type, full payment captured a 75.24% share in 2025, while financing is expected to grow at a 14.02% CAGR.
- By fuel type, petrol cars accounted for 67.04% of the Chinese used-car market in 2025, while electric vehicles are expected to grow at a 16.81% CAGR through 2031.
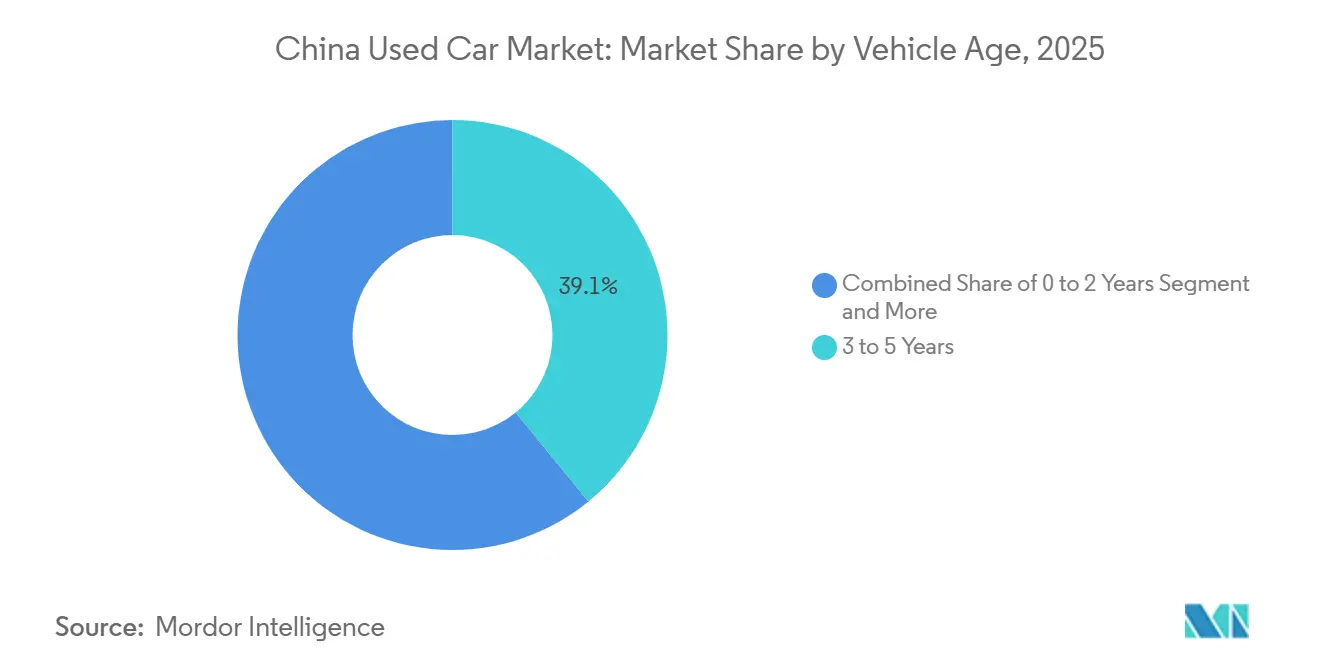
- By vehicle age, Vehicles aged 3 to 5 years accounted for 39.12% of the market share in 2025, while units aged 0 to 2 years are advancing at an 18.12% CAGR.
- By price segment, the USD 5,000-9,999 bracket captured a 30.34% share in 2025, whereas the USD 20,000-29,999 segment is projected to grow at a 15.45% CAGR.
- By geography, East China held a 33.29% share in 2025, while West China is set to grow at an 8.65% CAGR.
Note: Market size and forecast figures in this report are generated using Mordor Intelligence’s proprietary estimation framework, updated with the latest available data and insights as of January 2026.
China Used Car Market Trends and Insights
Drivers Impact Analysis*
| Driver | (~) % Impact on CAGR Forecast | Geographic Relevance | Impact Timeline |
|---|---|---|---|
| Rising Incomes Shorten Upgrade Cycles | +0.9% | Tier-1 and tier-2 cities | Long term (≥ 4 years) |
| Inter-City Vehicle Transfer Rules | +0.8% | East and Central China | Medium term (2-4 years) |
| Carbon Incentives Boost Scrapping Rates | +0.7% | Tier-1 emission zones | Short term (≤ 2 years) |
| OEM Programs Build Resale Trust | +0.6% | East and South China | Medium term (2-4 years) |
| Battery Health Transparency for NEVs | +0.5% | Coastal provinces | Medium term (2-4 years) |
| AI Predict Residual Values | +0.4% | Urban digital markets | Short term (≤ 2 years) |
| Source: Mordor Intelligence | |||
Rising Disposable Income and Upgrade Cycles
Urban disposable income averaged CNY 54,188 (~USD 7,748) in 2024, fueling faster replacement cycles that now run 5-6 years instead of the previous 6-8 years [1]. Affluent owners trade up earlier to access new ADAS features and longer-range batteries, feeding a surge of nearly-new units into the Chinese used car market. The 0-to-2-year bracket’s notable CAGR mirrors this behavioral shift, while lenders observe higher creditworthiness, lowering default risk. Concurrently, rising incomes cushion depreciation losses, encouraging sellers to accept quicker turnarounds. The effect is most pronounced in Shanghai, Beijing, and Shenzhen, where household earnings exceed the national average.e.
Deregulation of Inter-City Transfer Restrictions
The Ministry of Commerce is phasing in harmonized vehicle-transfer rules by 2026, eliminating local protectionism that once trapped inventory at its origin. Relaxed documentation and emissions alignment allow dealers to relocate stock from surplus inland lots to coastal hubs with denser demand. Early adopters in East China are already reducing average time-to-sale, freeing up working capital, and increasing margins. As logistics networks scale, cross-regional arbitrage should stabilize residual values and boost liquidity. Medium-term gains are forecast to compound as digital listing platforms integrate real-time transport availability, improving dealer sourcing efficiency.
OEM-Led Certified Pre-Owned Programs Expand Trust
BYD’s launch of a 179-point CPO inspection in 2025 raised industry transparency benchmarks [2]“BYD rolls out 179-point CPO inspection,” AutoCango, autocango.com. NIO Certified extends battery-swap privileges and 12-month warranties, bridging the trust gap that historically funneled shoppers toward new cars. These programs standardize inspection protocols and publicize state-of-health thresholds, anchoring residual values. Medium-term momentum will accelerate as OEM dealer networks roll out digital VIN tracking and integrate warranty data into online listings. East and South China, with dense dealer clusters, are poised to gain first-mover advantage.
Battery-Health Certification for Used NEVs
China’s GB38031-2025 standard, effective July 2026, mandates thermal-runaway testing plus mandatory disclosure of remaining capacity. Third-party labs will deliver standardized battery passports that lenders and insurers can underwrite, erasing a long-standing opacity premium. The framework is set to ease lender reluctance, catalyzing specialized NEV loan products that unlock pent-up demand. Coastal provinces with significant NEV penetration in 2025 led in adoption rates, reinforcing the driver’s positive impact on CAGR.
Restraints Impact Analysis*
| Restraint | (~)% Impact on CAGR Forecast | Geographic Relevance | Impact Timeline |
|---|---|---|---|
| Price Volatility | -0.8% | Segments with intense OEM competition | Short term (≤ 2 years) |
| Fraud and Information Asymmetry | -0.5% | Tier-3 and tier-4 cities | Long term (≥ 4 years) |
| Limited EV Financing | -0.4% | Low-NEV-penetration regions | Medium term (2-4 years) |
| License-Plate Quota | -0.3% | Tier-1 Hubs (Beijing, Shanghai, etc.) | Medium term (2-4 years) |
| Source: Mordor Intelligence | |||
Price Volatility from Aggressive New-Car Discounting
During the 2024-2025 price war, OEMs significantly reduced sticker prices, narrowing the divide between new and nearly-new inventories. BYD's reforms to payment terms, mandated by the company, led to a notable adjustment in its sales target, underscoring profitability challenges. For sellers in the used-car market, each factory rebate requires recalibrating asking prices, often diminishing profit margins. Dealers with a stock of slower-moving sedans are facing outsized losses. While regulatory bodies are intensifying scrutiny to mitigate predatory pricing, this oversight hasn't quelled the volatility that hampers buyer decisions.
Mileage Fraud and Information Asymmetry
A 2025 crackdown on zero-mileage fraud exposed widespread odometer tampering, especially in Guangdong’s multi-brand dealerships. Electronic vehicle licenses introduced in 2025 embed inspection and accident histories, yet enforcement lags in smaller cities where unorganized dealers dominate. As buyers demand deeper discounts to hedge unknown mileage risk, residual values sag, and transaction velocity declines. Blockchain-verified logs remain patchy, so full remediation may take several years, sustaining the restraint’s long-term drag.
*Our forecasts treat driver/restraint impacts as directional, not additive. The impact forecasts reflect baseline growth, mix effects, and variable interactions.
Segment Analysis
By Vehicle Type: SUVs Outpace Sedans in Upgrade Cycles
Sedans retained a 44.21% share in 2025, whereas the Chinese used-car market for SUVs is expanding at a robust 16.21% CAGR from 2026 to 2031. Higher seating positions, perceived safety, and elevated status make SUVs the default upgrade for urban households. Premium models from BMW, Mercedes-Benz, and NIO sustain a notable percentage-point residual-value premium three years post-purchase, insulating them from aggressive new-car discounts. In response, dealers allocate larger floor space to SUV inventory and invest in financing bundles that cater to buyers’ higher ticket sizes. Sedans continue to anchor volumes, yet residual values diverge sharply between entry-level models, those susceptible to price wars, and high-end trims that incorporate advanced driver-assistance systems. The trajectory suggests that SUVs could account for a notable share of transaction counts by 2031, reshaping dealer stocking strategies and compressing the resale curves of sedans.
The structural pivot toward SUVs aligns with broader urbanization trends that prioritize cargo flexibility and family utility. Crossovers, coupes, and convertibles command a marginal share but maintain loyal followings in coastal cities, where discretionary income supports lifestyle purchases. Hatchbacks and MPVs occupy niche spaces, first-time buyers and multi-child families respectively, but encounter slower growth as OEMs allocate R&D budgets to high-volume SUV platforms. The China used car market will therefore see supply concentration in SUVs and premium sedans, prompting auction houses to recalibrate appraisal algorithms that formerly weighted sedan benchmarks more heavily.


By Sales Channel: Digital Retailers Capture Scale Efficiencies
Offline sales channels captured a 32.18% share in 2025, while online e-retailers are forecasted to post a 20.34% CAGR from 2026 to 2031, dwarfing the share of OEM-franchised outlets. AI-enabled valuations and nationwide inventory aggregation enable online platforms to shorten time-to-sale from weeks to days, thereby freeing up dealer capital. Uxin's omnichannel superstores showcased a wide range of vehicles and recorded significant transaction growth in the second quarter of 2025. Classified portals like Autohome evolve into fintech gateways, monetizing financing referrals and warranty up-sells. While offline showrooms excel at experiential touchpoints, they shoulder higher rent and labor costs, compelling them to integrate digital appointment systems and remote video inspections.
Hybrid models, online browsing with in-store finalization, are emerging as the dominant retail template. Independent dealers and physical auction houses face shrinking margins because they cannot match the depth of data or marketing reach of national platforms. The Ministry of Public Security’s electronic license rollout feeds real-time inspection data directly into online listings, eroding the information edge of physical inspections. Consequently, unorganized dealers migrate to peripheral markets or pivot to sub-USD 5,000 inventory, where digital verification is less in demand. Organized platforms reinforce their advantage by layering loyalty programs, extended warranties, and buy-back guarantees that boost customer lifetime value and lock in repeat transactions.
By Vendor Type: Consolidation Favors Capital-Backed Players
Organized vendors held 63.11% market share in 2025 and are projected to grow at a 10.36% CAGR through 2031, widening their lead over unorganized vendors. Scale unlocks cheaper inventory financing and bulk reconditioning, reducing per-unit costs. Public-private partnerships, such as Uxin’s million joint venture in Wuhan, grant tax incentives and land access that small operators cannot secure. Government crackdowns on zero-mileage fraud disproportionately burden unorganized dealers lacking compliance infrastructure, accelerating exits or forced mergers. As organized players integrate blockchain odometer logs and patented AI appraisals, they build trust moats that fend off new entrants.
Nevertheless, the Chinese used-car industry still hosts thousands of family-run dealerships in tier-three cities, where information asymmetry persists. These operators survive by targeting price-sensitive buyers and leveraging local relationships. Yet their bargaining power declines as platforms enable sellers to compare instant offers nationwide. Over the forecast horizon, market concentration will increase, but regulatory vigilance against monopolistic behavior will limit any single player’s dominance.
By Transaction Type: Financing Penetration Climbs On NEV-Ready Loans
Full-payment deals commanded 75.24% of the 2025 market size, whereas financed purchases are projected to expand at a 14.02% CAGR from 2026 to 2031. Specialized NEV loans that incorporate battery health metrics and residual value guarantees entice younger, urban buyers focused on monthly affordability. The 2026 battery-health mandate equips lenders with actuarial data, thereby narrowing risk spreads compared to ICE loans. Platforms such as Uxin now approve credit within minutes by integrating fintech APIs that analyze social-credit and telematics data.
Government trade-in subsidies lower loan-to-value ratios, further easing lender concerns. Cultural preferences for outright ownership remain strong in rural areas and among older demographics. Yet, as vehicle prices rise in premium segments, installment options are gaining traction. Dealers bundle service contracts and extended warranties into loan packages, lifting ancillary revenue. The long-term trajectory suggests that financing could claim a notable share of transaction counts by 2031, pushing the Chinese used-car market toward Western-style credit penetration norms.
By Fuel Type: Electric Surge Redefines Residual Economics
Petrol remained dominant at 67.04% in 2025, while electric vehicles are set to register a 16.81% CAGR through 2031. OEM CPO programs, particularly BYD’s 90% battery state-of-health threshold, alleviate range anxiety and stabilize prices. As charging infrastructure densifies and battery-swap networks mature, buyer confidence shifts decisively toward used NEVs. Diesel’s relevance declines amid tighter emission zones in Tier 1 cities, while hybrid adoption plateaus as OEMs focus on pure electrics.
Financing hurdles persist, as battery leases complicate collateral, but standardization efforts, including GB38031-2025, should alleviate lenders' caution. By 2030, NEVs could command a notable share of the market, prompting auction houses to recalibrate their grading metrics, which currently heavily weight battery diagnostics. Policy support remains pivotal: plate-quota exemptions and preferential parking fees underpin demand, insulating NEVs from price wars that buffet ICE segments.
By Vehicle Age: Nearly-New Cars Gain Momentum
The Chinese used car market share for 3- to 5-year-old vehicles was 39.12% in 2025, mirroring the traditional replacement cycle. The 0-to-2-year bracket’s 18.12% CAGR is fueled by subsidies that reward owners who trade in early for NEVs, shrinking depreciation concerns. Nearly-new inventory commands higher average transaction prices but benefits from lower reconditioning costs and transferable factory warranties. Dealers respond by creating premium showroom zones and digital walk-around videos to justify elevated pricing.
Vehicles aged 6 to 12 years appeal to budget-conscious rural buyers but confront tightening emissions scrutiny. Cars older than 12 years face structural headwinds from electronic license enforcement, which flags overdue inspections, eroding their resale viability. The influx of nearly-new units is likely to elevate average selling prices and expand warranty uptake, reshaping aftermarket service economics.
By Price Segment: Premium Tier Accelerates on Warranty Confidence
The USD 5,000-9,999 segment captured a 30.34% share in 2025, while the USD 20,000-29,999 band is growing at a 15.45% CAGR to 2031. OEM CPO warranties, battery-health guarantees, and bundled roadside assistance justify premium pricing. Buyers migrating from new-car showrooms appreciate the combination of lower depreciation and certified reliability. Meanwhile, stocks priced under USD 5,000 are shrinking as scrapping incentives remove older units from circulation and regulatory hurdles deter cross-province transfers without complete documentation.
Middle-tier price bands are the most price-elastic, responding to factory rebate cycles that occasionally narrow the gap to discounted new models. This dynamic creates opportunities for consumers to access better-equipped vehicles at competitive prices. Luxury vehicles above USD 30,000, although niche, command stable demand due to their aspirational value and advanced technological features. Dealers offering concierge services, in-house financing, and personalized customer experiences capture incremental margins in this segment, further enhancing their market positioning. The growing emphasis on certified pre-owned programs and value-added services is expected to sustain growth across all price bands, ensuring a balanced market trajectory.
Geography Analysis
East China maintained a 33.29% market share in 2025, powered by Shanghai, Jiangsu, and Zhejiang, where dense dealer networks and high disposable incomes converge. Shanghai alone accounted for a significant share of national deals, yet its steep ICE plate auction fees are accelerating a pivot toward NEV stock. North China follows a similar pattern; Beijing’s lottery odds for ICE plates push registrations to neighboring Hebei, redistributing inventory flows. Digital license adoption is highest in these metropolitan areas, enabling faster online closings and reducing fraud.
South China is positioning itself as a pivotal growth hub. With well-established parts ecosystems and significant vehicle bases, Guangzhou and Shenzhen are primed to support Uxin’s ambitious superstore. Wage levels in Tier 1 cities drive demand for premium vehicles. Additionally, Guangdong's export focus, combined with lenient regulations, enables seamless cross-border resales into Southeast Asia. Meanwhile, Central China, encompassing Henan and Hubei, capitalizes on inter-city transfer deregulation, directing surplus coastal stock to inland areas. Uxin’s expansive facility in Zhengzhou epitomizes this logistics-driven redistribution.
West China books the fastest regional CAGR at 8.65% over 2026-2031, supported by infrastructure build-outs and income convergence policies. Provinces such as Sichuan and Shaanxi witness dealer expansions that seek to capitalize on low car-density baselines. However, regulatory oversight remains lighter, sustaining higher fraud risk and necessitating consumer education programs. As highway networks and charging corridors mature, the region’s share of China used car market transactions is set to rise from a low base, diversifying national demand dynamics.
Regulatory Landscape
China’s used car sector is being shaped by tighter compliance requirements aimed at improving transaction transparency, standardization, and cross-regional circulation. The Ministry of Commerce (MOFCOM) has been central to circulation reforms, including pilots that test digital transaction systems and inventory mobility across provinces, while enforcement actions in 2025 targeted practices such as “zero-mileage used cars” that distort pricing and consumer trust.
Standard-setting and product-safety rules are also becoming more consequential for used-NEV transactions. GB38031-2025 takes effect in July 2026 and elevates battery-safety and disclosure requirements that feed into how used NEVs are inspected, described, financed, and insured. On the export side, China tightened oversight of “new cars exported as used vehicles,” with after-sales service documentation requirements for vehicles exported within 180 days of registration effective from January 1, 2026, adding compliance steps for exporters and trading hubs such as Shanghai’s free-trade-zone platform.
Value Chain Analysis
The value chain starts with supply intake from consumers, fleets, leasing and rental operators, and OEM channels, then moves through appraisal, inspection, and title transfer. Increasingly, organized dealers and platforms standardize grading using formal inspection protocols, including OEM-certified pre-owned programs (for example, BYD’s 179-point CPO inspection launched in 2025) and the expanding use of electronic vehicle licenses that embed inspection and incident history data.
Reconditioning and merchandising are shifting toward centralized, warehouse-style superstores that combine refurbishment, photography, listing, and omnichannel sales under one operating model. Logistics partners support cross-province inventory rebalancing as transfer rules are harmonized by 2026. Financing, insurance, and warranty providers sit downstream as key value add-ons, particularly for nearly-new vehicles and used NEVs, where battery condition and warranty transferability affect credit terms and resale velocity. Export-oriented nodes are also emerging, supported by municipal service platforms (for example, Shanghai’s used-car international trading service platform debuted in December 2025), though stricter export compliance for near-new registrations raises documentation and after-sales obligations.
Competitive Landscape
The market remains moderately fragmented despite organized vendors holding a significant share in 2025. Uxin exemplifies the scale-plus-tech model; its Q2 2025 retail revenue hit RMB 607.6 million (USD 84.8 million), up 87% year-on-year [3]“Uxin Q2 2025 earnings release,” Uxin Limited, uxin.com. Superstores that blend physical displays with app-based transactions are effective at increasing foot traffic and conversion rates. Haier’s stake in Autohome heralds cross-industry convergence as appliance giants harvest establishments from auto-commerce data.
Souche, backed by Alibaba, integrates e-commerce logistics and payment rails into its dealer enablement, though its retail footprint lags Uxin's. Fintech insurgents backed by NIO Capital are targeting loan origination gaps by embedding credit scoring within NEV ecosystems. White-space opportunities include battery-lease transfer marketplaces and standardized health passport services, both of which are prerequisites for deep secondary-market liquidity in electric segments.
Meanwhile, blockchain pilots across provincial traffic bureaus are inching toward immutable vehicle histories, a potential industry standard that would elevate the barrier to entry for smaller dealers. Regulators monitor consolidation to ensure consumer protection without stifling innovation. The pending GB38031-2025 rules will likely raise compliance costs, favoring capital-rich incumbents. Nonetheless, the competitive field remains open for differentiated service models that combine financing, warranty, and digital provenance.
China Used Car Industry Leaders
Guazi Used Cars (Chehaoduo Group)
Renrenche
Souche
Uxin Limited
Tiantian Paiche
- *Disclaimer: Major Players sorted in no particular order

Market Opportunities and Future Outlook
Standardized battery-health disclosure and safety compliance create room for scalable used-NEV inspection, certification, and underwriting services that can be integrated into retail checkout and loan origination. With GB38031-2025 taking effect in July 2026, battery diagnostics and documented state-of-health carry more weight, supporting opportunities for third-party labs, digital “battery passport” providers, and lenders designing NEV loan products tied to verified condition data.
Format innovation and capacity build-out in organized retail also keep opening share-gain paths for operators that combine reconditioning, logistics, and fintech in one network. Uxin’s 2026 expansion of warehouse-style superstores, including launches in Chongqing and Shaoxing, indicates ongoing investment in centralized inventory and standardized retail processes, while the June 2026 close of a USD 15 million investment from parties designated by NIO Capital points to targeted capital for scale models. On the policy side, pilots under automotive circulation reforms and tighter governance of “zero-mileage” practices and used-car exports (effective January 1, 2026 for added export documentation on vehicles registered within 180 days) increase the value of compliant, data-rich listings and one-stop service platforms that reduce fraud and transaction friction.
Recent Industry Developments
- July 2026: Uxin Limited launches a new used car superstore project in Shaoxing with capacity greater than 2,500 vehicles. The expansion extends its centralized retail footprint to improve scale and liquidity in the secondary market.
- July 2026: Guazi (Chehaoduo Group) publishes 2026 first-half data showing triple-penetration of NEVs on the platform. The result indicates accelerated NEV adoption in the secondary market and differentiates Guazi for 2026-2027.
- June 2026: Uxin Limited closes a US$15 million investment from parties designated by NIO Capital under a previously announced subscription. The funding strengthens liquidity and supports longer-term scaling of the warehouse-style superstore model.


Research Methodology Framework and Report Scope
Market Definition and Coverage
For this study, the market measures the value of used car transactions in China, covering pre-owned vehicles sold through organized and unorganized channels during the year, reported in current USD.
Scope exclusions: It does not count brand-new vehicle sales, pure parts and service revenue, or vehicle scrappage and dismantling activity.
Segmentation Overview
- By Vehicle Type
- Hatchbacks
- Sedans
- Sport Utility Vehicles (SUVs)
- Multi-Utility Vehicles (MPVs)
- Others (Convertibles, Coupes, Crossovers, Sports Cars)
- By Sales Channel
- Online Digital Classified Portals
- Pure-play e-Retailers
- OEM-Certified Online Stores
- Offline OEM-Franchised Dealers
- Multi-brand Independent Dealers
- Physical Auction Houses
- By Vendor Type
- Organized
- Unorganized
- By Transaction Type
- Full Payment
- Finance
- By Fuel Type
- Petrol
- Diesel
- Hybrid
- Electric
- LPG / CNG / Others
- By Vehicle Age
- 0 to 2 Years
- 3 to 5 Years
- 6 to 8 Years
- 9 to 12 Years
- More Than 12 Years
- By Price Segment
- Less Than USD 5,000
- USD 5,000 to 9,999
- USD 10,000 to 14,999
- USD 15,000 to 19,999
- USD 20,000 to 29,999
- More Than USD 30,000
- By Geography
- East China
- North China
- South China
- Central China
- West China
Data Sources, Market Sizing, and Validation
Desk Research
Desk research helped us pin down the demand pool and the most consistent public signals around used vehicle turnover in China. We relied on sources such as the China Automobile Dealers Association releases, national and provincial transport and vehicle registration statistics, and customs trade data for used vehicle movements where relevant for cross checks.
To convert activity into value, we also reviewed information from listed-company filings and investor presentations of ecosystem participants, plus reputable press coverage on transaction volumes, pricing moves, and policy changes like cross-city transfers. In a few places, paid subscriptions for company financials and intelligence, news and financials, and shipment-level import and export records were used to fill gaps and sanity check assumptions. This list is illustrative only, and many other public and paid sources were also referenced for data collection, validation, and clarification.
Primary Interviews and Surveys
Primary work was used to test what the public data cannot show clearly, especially how prices, commissions, and financing attachment vary by city tier and channel in China. We spoke with stakeholders across dealer groups, marketplaces, auction and inspection networks, and financing and insurance intermediaries so that assumptions could be adjusted and then rechecked against the final model totals.
Distribution of primary research fieldwork respondents
| Company type | Respondent position |
|---|---|
| Top tier: 27% | CXOs: 14% |
| Mid tier: 59% | Functional/Unit leaders: 27% |
| Smaller Players: 14% | Managers: 59% |
Market-Sizing & Forecasting
Sizing starts with a demand-side build where transaction volumes are reconstructed using official used vehicle transaction series and mobility and registration context, and then those units are translated into value using observed price and mix indicators. The top-down approach is anchored on annual transaction counts, which are then shaped by vehicle type mix, average transaction values, and the share of cross-city transfers.
To keep the output realistic, we corroborated totals with selective bottom-up checks, such as sampled price points by age band and fuel type, channel-level take rates, and dealer throughput ranges shared in interviews in China. Where value signals varied widely across provinces, a gap-handling step was applied by using tiered city weights and conservative price bands, and then the results were revalidated with experts.
For forecasting, scenario analysis was used, with the base case built from variables that respondents were comfortable projecting, such as used-to-new sales ratio, new car discount intensity (which changes the used price corridor), NEV resale liquidity trends, and policy execution on inter-city transfers and title processing. When the main drivers were updated, the model was rerun so that the growth path stayed tied to observable market behavior rather than a single static CAGR assumption.
Data Validation & Update Cycle
Validation is done in several passes so that one data point does not overly influence the final output. We compare the modeled value against independent signals like association-reported transaction value, unit transactions, and consistency checks on implied average transaction value, and then investigate outliers before sign-off.
If a variance cannot be explained by mix, policy timing, or currency conversion, we re-contact sources to confirm whether the shift is structural or temporary. Reports are refreshed annually, and interim updates are made when material events occur, such as sharp pricing changes or major policy clarifications. Before delivery, an analyst performs a fresh pass on the key inputs so clients receive the most recent view available.
Mordor Intelligence's China Used Car Market Size Measured Against Other Published Estimates
Published market values for used cars in China can look different across sources because they are not always describing the same thing, even when the titles sound similar. The gaps usually come from whether the number is based on full transaction value versus only dealer revenue, how cross-city transfers are handled, and which exchange rate timing is applied.
A second set of differences comes from how pricing is treated over the year, since average ticket size changes fast when new car discounting intensifies and when NEVs begin moving into earlier resale cycles. In this study, the modeled value is tied to annual transaction counts and implied average transaction value checks rather than a single headline turnover value, which helps separate partial-year spikes from the full-year market view, a modeling choice reflected in Mordor Intelligence's approach.
Benchmark comparison
| Source | Market Size | Gaps in Research Methodology |
|---|---|---|
| Mordor Intelligence | USD 169.71 B (2025) | |
| Industry Association A | USD 180.00 B (2024) | This figure reflects reported total transaction value for the year in current terms, which can move with pricing swings and may not align with a base-year definition used for forward forecasting. |
| Trade Journal B | USD 1.29 T (2024) | Some publications quote the same 2024 transaction value in local currency without standardizing for definition and conversion timing, which can be misread as a different scale when converted or compared across years. |
The spread across the figures mostly comes down to definition and timing, not a disagreement on whether the market is large. When the transaction-value approach is matched to a consistent year, currency, and mix logic, the range narrows and the remaining differences are easier to explain and reproduce.


Key Questions Answered in the Report
Which vehicle type is growing fastest in Chinese secondhand sales?
Sport utility vehicles are advancing at a 16.21% CAGR between 2026 and 2031 due to buyer preference for space and safety features.
What share do organized dealers hold?
Organized vendors controlled 63.11% of 2025 transactions and are consolidating further at 10.36% CAGR.
How quickly are electric models expanding in resale channels?
Used electric vehicles are pacing at a 16.81% CAGR, driven by battery-health certification and OEM CPO warranties.
Which region posts the highest transaction volume?
East China leads with 33.29% of national volume, anchored by Shanghai, Jiangsu, and Zhejiang.
Page last updated on:


 Your data is secure and never sold or shared.


