
Market Overview
| Study Period | 2020 - 2031 |
|---|---|
| Forecast Data Period | 2026 - 2031 |
| Base Year Market Size (2025) | USD 96.31 Billion |
| Market Size (2026) | USD 109.35 Billion |
| Market Size (2031) | USD 206.44 Billion |
| Growth Rate (2026 - 2031) | 13.55 % |
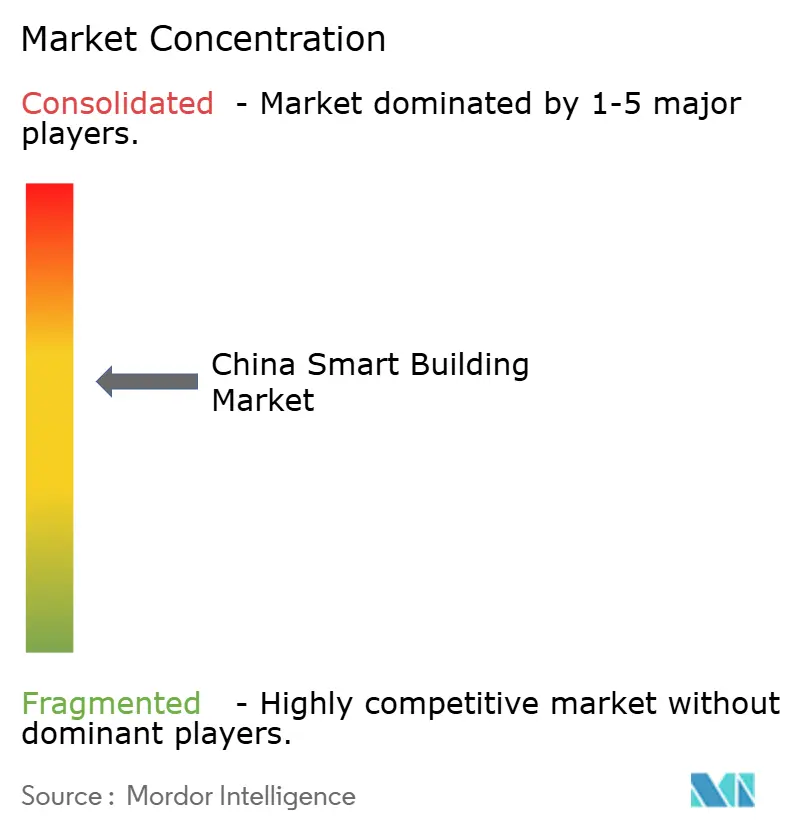
| Market Concentration | Medium |
Major Players *Disclaimer: Major Players sorted in no particular order Image © Mordor Intelligence. Reuse requires attribution under CC BY 4.0. | |
China Smart Building Market Analysis by Mordor Intelligence
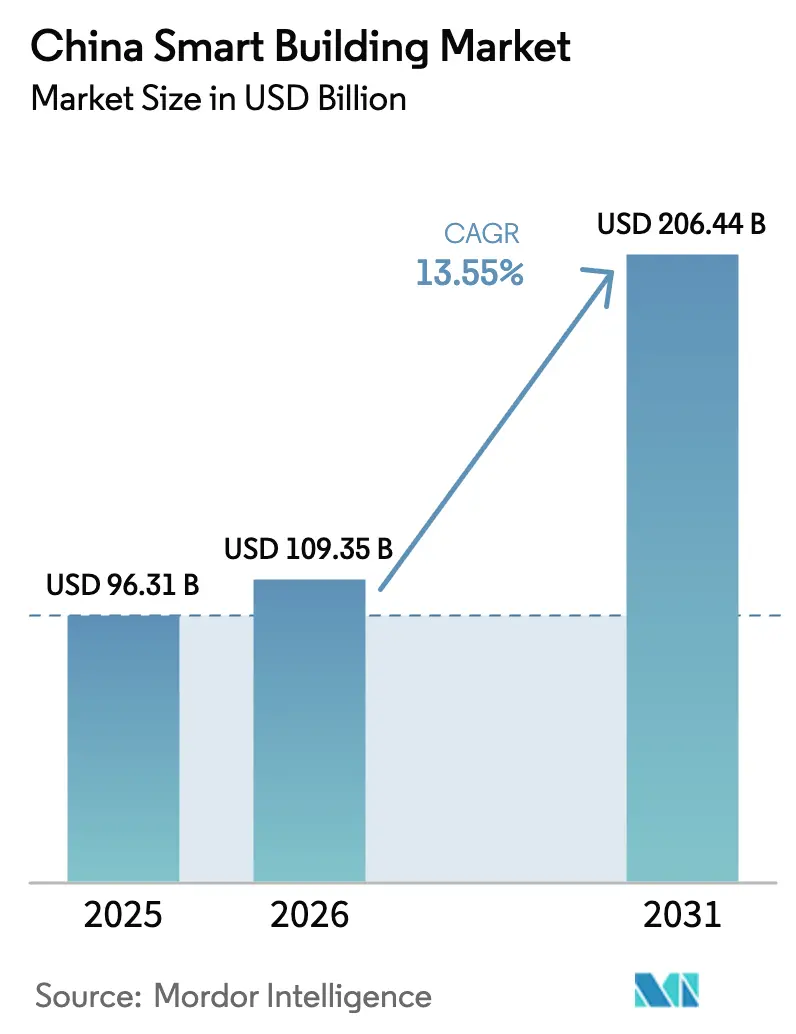
The China smart building market size is expected to grow from USD 96.31 billion in 2025 to USD 109.35 billion in 2026 and is forecast to reach USD 206.44 billion by 2031 at 13.55% CAGR over 2026-2031. Strong policy backing, generous green-finance lines, and rapid 5G rollout are transforming intelligent buildings from optional upgrades into mandated infrastructure that supports Beijing’s digital economy agenda. Mandatory energy-performance disclosure for large commercial properties, expanded carbon-reduction lending at 1.75% interest, and city-level digital-twin platforms are converging to create a compliance-driven adoption cycle. Telecom operators and automation giants are repositioning themselves as platform players, while domestic software specialists are capturing analytics layers by embedding into municipal data exchanges. Early movers benefit from network effects that raise switching costs, while lagging small and medium-sized enterprises (SMEs) face capital and skills barriers that slow the broader diffusion.
Key Report Takeaways
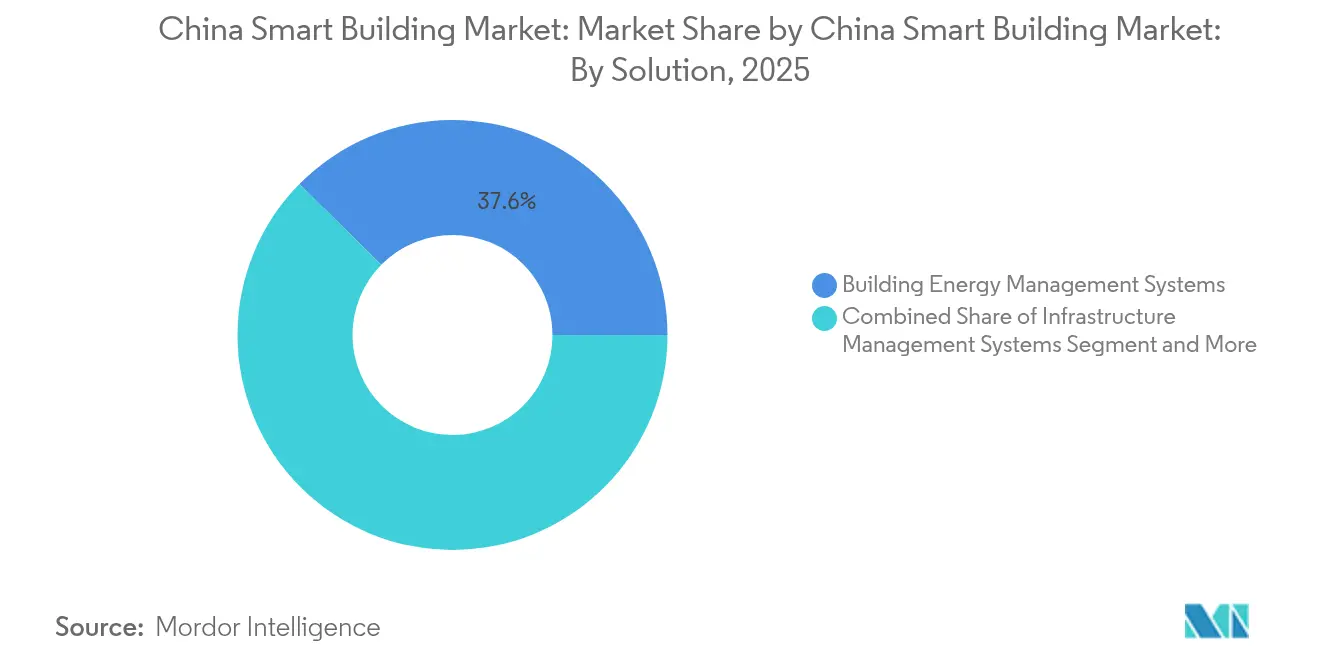
- By solution, building energy management systems led with 37.62% of the China smart building market share in 2025, while integrated workplace management platforms are forecast to expand at a 15.12% CAGR through 2031.
- By component, hardware accounted for 54.88% share of the China smart building market size in 2025 and services are advancing at a 13.95% CAGR to 2031.
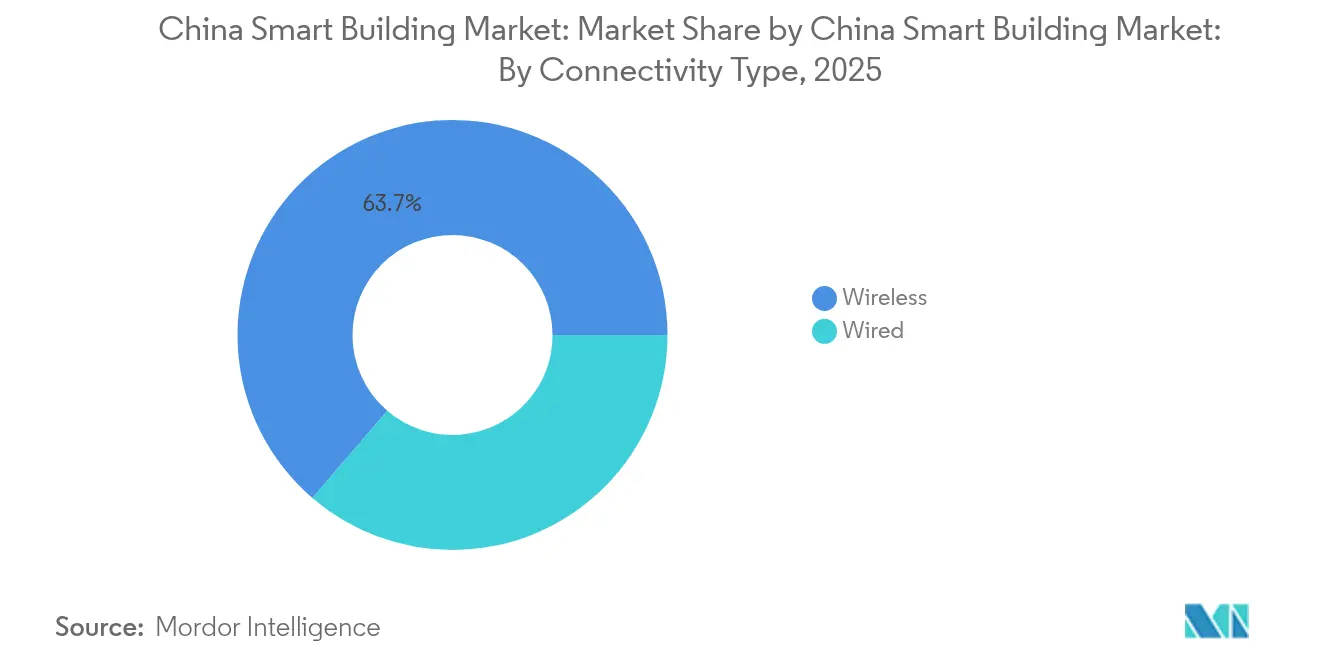
- By connectivity type, wireless technology commanded 63.70% share of the China smart building market size in 2025 and is poised to grow at a 14.42% CAGR through 2031.
- By building type, commercial facilities held 43.95% of the China smart building market share in 2025, whereas industrial buildings are projected to register the highest 15.05% CAGR between 2026 and 2031.
Note: Market size and forecast figures in this report are generated using Mordor Intelligence’s proprietary estimation framework, updated with the latest available data and insights as of 2026.
China Smart Building Market Trends and Insights
Drivers Impact Analysis*
| Driver | (~) % Impact on CAGR Forecast | Geographic Relevance | Impact Timeline |
|---|---|---|---|
| Expanding Government Smart City Initiatives | +3.2% | National clusters such as Beijing-Tianjin-Hebei, Yangtze River Delta, Pearl River Delta, Chengdu-Chongqing | Medium term (2-4 years) |
| Rising Demand for Energy-Efficient Retrofits in Existing Buildings | +2.8% | Tier-1 and tier-2 cities | Short term (≤ 2 years) |
| Integration of 5G and AIoT Platforms in Building Automation | +2.5% | Major urban centers with 5G-Advanced | Medium term (2-4 years) |
| Growing Corporate Net-Zero Carbon Commitments | +2.1% | Commercial real estate and industrial parks in eastern provinces | Long term (≥ 4 years) |
| Rapid Growth of Smart Property Management Services | +1.6% | Residential complexes in tier-1 and new-development zones | Short term (≤ 2 years) |
| Emergence of Digital Twin-Based Urban Planning Mandates | +1.5% | 16 smart-city demonstration zones and provincial capitals | Long term (≥ 4 years) |
| Source: Mordor Intelligence | |||
Expanding Government Smart City Initiatives
Beijing’s 2024 guideline commits CNY 1.2 trillion (USD 165 billion) through 2027 to digitalize municipal services, treating smart buildings as core infrastructure alongside 5G and data centers. The directive covers 16 demonstration zones and requires new public buildings above 10,000 m² to connect with city data platforms by 2026. Compliance timetables are driving a surge in turnkey projects, favoring vendors able to integrate automation, security, and energy modules under a single architecture. Local governments tie subsidy eligibility to adherence with the Ministry of Housing’s 2024 smart-building technical specification, effectively raising market-entry barriers.[1]As a result, the Chinese smart building market experiences policy-induced demand certainty even amid broader real-estate volatility.
Rising Demand for Energy-Efficient Retrofits in Existing Buildings
Roughly 60% of China’s building stock predates the 2010 energy codes, representing more than 20 billion square meters of retrofit potential.[2]The carbon peaking plan targets a 15% reduction in operational emissions by 2030, with retrofits accounting for half of the reduction. The People’s Bank of China extended its carbon-reduction facility to cover building energy-management projects at an interest rate of 1.75%, trimming payback periods for landlords. Fourteen provinces now require energy-performance disclosure at lease renewal, creating rental premiums for smart-enabled assets, as seen in Shanghai, where automated buildings achieved 8-12% higher rents in 2024. These incentives convert energy systems from cost centers into revenue enhancers, sustaining double-digit uptake across the Chinese smart building market.
Integration of 5G and AIoT Platforms in Building Automation
5G-Advanced coverage in over 95% of prefecture-level cities by mid-2024 removes wiring cost barriers that once limited retrofit projects. Telecom operators collaborate with automation firms to deliver unified 5G cores that support security, lighting, and HVAC on a single network. Huawei’s campus solution, certified in 127 cities, combines low-latency 5G with edge analytics to cut installation times and enable real-time control of elevators and fire systems. The Ministry of Industry and Information Technology’s 2024 AIoT guideline allocates dedicated spectrum for building applications, boosting reliability, and accelerating uptake.[3] These developments reinforce wireless as the default connectivity model, thereby strengthening the trajectory of the Chinese smart building market.
Growing Corporate Net-Zero Carbon Commitments
Listed developers and industrial-park operators now embed net-zero goals into tenant contracts, aligning private capital with national decarbonization goals. Multinational manufacturers in the Yangtze River Delta require smart logistics and energy monitoring to meet Science Based Targets initiative benchmarks, pulling digital infrastructure deeper into supply chains. Energy-as-a-service contracts, in which vendors guarantee savings, appeal to fleet-wide portfolios seeking predictable returns. The move links enterprise sustainability strategies with city-level digital-twin models, making building data a strategic asset. As carbon reporting hardens, smart-enabled facilities become prerequisites for financing from state and commercial banks that now price loans on emissions-intensity metrics, broadening the China smart building market base.
Restraints Impact Analysis*
| Restraint | (~) % Impact on CAGR Forecast | Geographic Relevance | Impact Timeline |
|---|---|---|---|
| High Upfront Capital Expenditure for SMEs | -1.8% | Tier-2 and tier-3 cities with SME ownership | Short term (≤ 2 years) |
| Fragmented Building Communication Protocols | -1.3% | National retrofit projects | Medium term (2-4 years) |
| Data Privacy and Cyber-Security Compliance Gaps | -0.9% | Government and financial buildings | Short term (≤ 2 years) |
| Shortage of Certified Smart-Building Facility Managers | -1.1% | Tier-2 and tier-3 cities | Long term (≥ 4 years) |
| Source: Mordor Intelligence | |||
High Upfront Capital Expenditure for SMEs
Comprehensive smart retrofits cost up to USD 200 per m², a hurdle for SMEs that hold 40% of commercial floor area but earn rental yields of only 4-6%. Commercial lending rates of 4.5-6.0% neutralize central-bank concessional lines reserved for state developers, stretching paybacks to 8-12 years. Subsidies covering 20-30% of costs in Zhejiang and Guangdong ease the burden yet remain confined to pilot budgets. As a result, the China smart building market shows bifurcation: tier-1 portfolios digitize rapidly while fragmented SME assets lag. Vendors are responding by offering modular kits, phased rollouts, and revenue-sharing energy contracts, but capital friction persists as a structural brake on nationwide penetration.
Shortage of Certified Smart-Building Facility Managers
The country is estimated to lack 150,000 certified operators capable of operating AI-driven platforms.[4]The annual graduation of fewer than 30,000 managers under the 2024 national certification program cannot keep pace with double-digit market growth. Skill gaps lead to under-commissioned systems, as Chengdu audits revealed that 40% of automated HVAC installations were missing projected savings. Shortfalls are most acute in Tier 2 and Tier 3 cities, amplifying regional disparities within the China smart building market. Managed services and vendor-run command centers are emerging to fill the void, but scarcity continues to constrain optimal returns on installed technology.
*Our forecasts treat driver/restraint impacts as directional, not additive. The impact forecasts reflect baseline growth, mix effects, and variable interactions.
Segment Analysis
By Solution: Energy Management Dominates Amid Workplace Platform Surge
Building energy management systems captured 37.62% of the Chinese smart building market share in 2025, supported by disclosure rules for properties above 20,000 m². Vendors bundle HVAC, lighting, and solar assets into algorithms that track weather and occupancy patterns, pushing the segment toward outcome-based contracts. Sliding hardware margins facilitate a shift to subscription models that ensure energy savings. Integrated workplace management, though smaller, is advancing at a 15.12% CAGR, helped by hybrid work trends and landlord demand for real-time space analytics. China Resources Land rolled out workplace dashboards across 2.8 million square meters in 2024, reducing tenant space by up to 20% and validating the segment’s value proposition.
Energy, security, and workplace modules increasingly converge on a single data layer. Infrastructure management systems offer steady if slower growth tied to new-build volume. Security remains essential amid rising compliance requirements for visitor tracking, but privacy curbs limit the use of facial recognition in residential complexes. Lighting controls fold into energy platforms, with LED retrofits serving as entry points for broader automation. Cross-domain vendors that can stitch multiple functions together are best positioned to win bundled tenders across the Chinese smart building market.

By Component: Hardware Saturation Accelerates Services Shift
Hardware generated 54.88% of 2025 revenue, yet it is losing pricing power as sensor and controller costs decline. Wireless 5G sensors further erode gateway demand, pressuring manufacturers that lack proprietary technology. Software layers, analytics, operating systems, and cyber-defense rise in strategic weight as clients seek insight rather than raw data. Subscription pricing, exemplified by Siemens Desigo CC, smooths cash flow and deepens stickiness.
Services, the smallest component in 2025, are on track for the fastest 13.95% CAGR through 2031. Integration complexity around legacy systems fuels demand for specialist integrators, while SMEs outsource operations to managed-service providers. Johnson Controls’ OpenBlue bookings in China increased by 40% in 2024 under outcome-based contracts, demonstrating the acceptance of performance guarantees. As monetization shifts from one-off hardware sales to life-cycle services, vendors with dense local support networks gain market share across the entire China smart building market spectrum.
By Connectivity Type: Wireless Dominance Driven by Retrofit Economics
Wireless connections accounted for 63.70% of revenue in 2025 and are expected to expand at a 14.42% CAGR. Retrofit projects avoid the 3-5 times extra cost of rewiring by adopting 5G-Advanced, whose ultra-reliable, low-latency performance now meets fire safety and elevator codes. Spectrum reserved for industrial IoT reduces interference risk, making wireless the default for new builds as well. Huawei’s campus deployments demonstrate how a unified 5G core can support automation, security, and energy traffic without requiring proprietary cabling.
Wired options persist only in mission-critical or cyber-sensitive sites, such as data centers and nuclear plants. Even there, hybrid topologies are emerging, with wired backbones feeding wireless edge devices. Vendors must master wireless-first designs without abandoning backward compatibility, a duality that favors incumbents familiar with decades of installed wired systems in the Chinese smart building market.
By Building Type: Industrial Segment Accelerates on Emissions Compliance
Commercial properties accounted for 43.95% of 2025 revenue, owing to concentrated ownership, strong tenant expectations, and green lease clauses. Residential adoption lags due to fragmented ownership, but grows in premium and subsidized projects tied to energy mandates. Industrial facilities, although smaller, are expected to achieve the highest 15.05% CAGR as factories install real-time energy and environmental monitoring systems to meet provincial carbon caps. Suzhou Industrial Park requires factories above 50,000 m² to install monitoring by 2026, catalyzing vendor pipelines.
Industrial projects prioritize rugged hardware, hazardous-area certifications, and integration with manufacturing execution systems. They also deliver demonstrable operational benefits, such as 20-30% reductions in downtime through the use of predictive maintenance. Vendors with an industrial-automation heritage enjoy an edge, but telecom-driven platforms are making inroads by offering unified networks that simplify site infrastructure, thereby broadening the customer base of the Chinese smart building market.
Geography Analysis
The Yangtze River Delta, Pearl River Delta, and Beijing-Tianjin-Hebei regions accounted for 61.30% of 2025 installations, supported by strong fiscal budgets, dense commercial stock, and robust telecom grids. Shanghai mandates three-star green certification for new commercial buildings above 20,000 m² by 2025, driving over 180 smart projects in 2024 alone. Shenzhen, with its technology cluster, acts as a test bed for digital twins and AI optimization, accelerating vendor learning cycles.
Chengdu-Chongqing is emerging as the inland growth pole, buoyed by central government investment and ambitions to become a smart manufacturing hub. Tier 2 and Tier 3 cities represent the next frontier, driven by ongoing urbanization and the diffusion of policy. However, fragmented ownership, high capital costs, and skills shortages delay adoption. Zhejiang and Guangdong subsidies mitigate entry costs but remain limited in scale. The October 2024 digital-twin mandate for districts exceeding 5 km² is likely to spur secondary-city projects as local governments compete for demonstration-zone status, thereby expanding the geographic footprint of the Chinese smart building market.
Domestic vendors leverage local ties and cost structures to win in secondary markets where global rivals face higher go-to-market expenses. Huawei’s certification in 127 prefecture-level cities demonstrates how telecom players leverage municipal infrastructure budgets to expand their reach. Regional integrators that blend global hardware with local software thrive under a hybrid model, tailoring solutions to local codes and budgets. Manufacturing-intensive provinces such as Jiangsu and Shandong benefit from the June 2024 AIoT spectrum allocation, which encourages industrial adoption and diversifies the Chinese smart building market landscape.
Regulatory Landscape
China smart building adoption is increasingly shaped by technical specifications and national programs covering housing quality, energy performance, and interoperability. The Ministry of Housing and Urban-Rural Development (MoHURD) provides the built-environment rulebook through smart-building evaluation and green-building assessment requirements, including localized updates to GB/T 50378-2019 implemented in October 2024, as well as residential-facing standards focused on safety, green performance, and smart design. City-level requirements for digital-platform connectivity and energy-performance disclosure also reinforce compliance-led deployments in large properties.
Standardization is moving beyond design guidance toward device interconnection and security compliance. In March 2026, the Ministry of Industry and Information Technology (MIIT) issued a draft plan proposing five mandatory national standards for smart home interconnection, targeting fragmented ecosystems across connectivity, operation, and security. MoHURD also renewed consultation in July 2026 on the Good Houses Construction Guide (Trial) (Draft for Comment), which pushes smart community integration (smart home, security, parking, and property management linkages) within the "Good Houses" quality framework, raising the practical bar for residential and community-scale smart system integration even where guidance is not yet mandatory.
Value Chain Analysis
The value chain covers component suppliers (sensors, controllers, meters, cameras, gateways, and 5G modules), platform and software providers (BMS, energy analytics, digital-twin and integration middleware), system integrators and engineering firms, and downstream building owners and operators (commercial portfolios, industrial parks, public facilities, and residential communities). Technical standards increasingly govern handoffs across design, installation, commissioning, and operations, with recent references including T/CECS 1529-2024 (effective June 2024) for intelligent building technical architecture, T/CABEE 112-2025 (effective August 2025) for public building smart operation and control, and T/NBSIA 019-2025 (effective December 2025) for integrated design of intelligent and digital buildings.
China-specific ecosystem dynamics still favor domestic platforms and integrated park or community deployments, where OEMs and tech platforms bundle equipment, connectivity, and O&M into lifecycle contracts. For example, Midea Building Technologies opened its Midea Global Innovation Park in Shanghai in July 2025, using the iBUILDING digital platform for park-wide energy and IoT device management, which shows how large-owner campuses can serve as reference projects that pull through devices, integration, and services. Demand also concentrates around large projects that incorporate smart environmental controls and monitoring requirements, increasing the importance of commissioning, cybersecurity configuration, and ongoing operations services for integrators and platform vendors.
Competitive Landscape
The China smart building market is moderately fragmented, with top-10 vendors controlling a majority of the 2024 revenue, while regional integrators and niche software houses split the remainder. Global stalwarts—Honeywell, Johnson Controls, Siemens, Schneider Electric- rely on HVAC and fire-safety heritage to anchor large projects. Yet, domestic platforms capture middleware and analytics by aligning with cybersecurity and data localization mandates. Huawei’s 5G-centric architecture integrates networking, automation, and energy layers, compelling traditional control vendors to shift toward AI and cloud services or risk margin compression.
Skills shortages and SME capital gaps create opportunities for turnkey providers that bundle financing, installation, and multi-year operations. Firms that build training academies and intuitive dashboards reduce the expertise hurdle and secure recurring revenue. Patent filings in building automation reached record levels in 2024, with Chinese applicants holding 68% of global submissions, intensifying technology races. The contest now revolves around platform control rather than component differentiation, echoing earlier battles in the enterprise IT sector. Vendors able to position their software as the default operating system for buildings will capture network effects that reinforce incumbency across the China smart building market.
China Smart Building Industry Leaders
-
Huawei Technologies Co., Ltd.
-
Johnson Controls International plc
-
Schneider Electric SE
-
Siemens Aktiengesellschaft
-
Honeywell International Inc.
- *Disclaimer: Major Players sorted in no particular order
Market Opportunities and Future Outlook
Interoperability and identity management create near-term whitespace, particularly where legacy subsystems and multi-vendor estates remain common. MIITs March 2026 draft plan proposing five mandatory national standards for smart home interconnection directly targets protocol fragmentation, opening room for gateway replacement cycles, standards-aligned controllers, and certified integration layers across residential communities and mixed-use portfolios. This standardization push also aligns with MoHURDs "Good Houses" framework (publicly consulted again in July 2026), which elevates integrated smart home, security, parking, and property management linkages from optional features to a core element of housing quality, expanding opportunities for end-to-end community platforms and managed operations.
Public-sector digital governance is also expanding the data spine for smart building operations, supporting digital twin and lifecycle management use cases. In 2026, MoHURD and the National Data Bureau issued a notice to implement a unified national coding system for buildings, assigning unique digital identities to new buildings by 2027, which supports cross-system data linkage for energy management, maintenance records, and compliance reporting. In parallel, the State Administration for Market Regulation issued GB/T 45402-2025 on reference architecture for city intelligent hubs, giving vendors and municipalities a clearer blueprint for integrating building energy and O&M data into city platforms, supporting larger bundled tenders that combine on-site systems with municipal data exchange requirements.
Recent Industry Developments
- July 2026: MoHURD initiated renewed public consultation on the Good Houses Construction Guide (Trial) (Draft for Comment), emphasizing smart community integration across smart home, security, parking, and property management. The move formalizes a national quality framework that pulls smart connectivity requirements into mainstream residential and community development. Vendors that can deliver interoperable, multi-system integration and long-term operations support gain an advantage as guidance is translated into local implementation rules.
- July 2025: Midea Building Technologies opened the Midea Global Innovation Park in Shanghai and positioned the iBUILDING digital platform for park-wide energy and IoT device management. The park acts as a live reference for integrated campus operations, helping drive platform-led procurement that bundles equipment, software, and services. It also strengthens domestic ecosystem pull-through for sensors, controls, and integration services in large owner-operated facilities.
- October 2024: Siemens partnered with China State Construction Engineering Corporation to roll out Desigo CC across 50 million m2 in 20 cities by 2027. The scale of deployment supports multi-site standardization of building management and accelerates adoption of unified operating platforms across geographically dispersed portfolios. Such large framework rollouts increase switching costs and favor vendors with strong integration and lifecycle service capabilities.
Research Methodology Framework and Report Scope
Market Definition and Coverage
For this report, we define the China smart building market as spending on solutions that make buildings more connected, automated, and easier to operate, covering systems used for energy, lighting, HVAC, safety, and workplace operations across China.
Scope exclusions: We exclude general construction spend that is not tied to smart systems deployment, along with unrelated IT equipment that is not installed and used for building operations.
Segmentation Overview
- By Solution
- Building Energy Management Systems
- Infrastructure Management Systems
- Intelligent Security Systems
- Integrated Workplace Management Platforms
- Lighting Control Systems
- By Component
- Hardware
- Software
- Services
- By Connectivity Type
- Wired
- Wireless
- By Building Type
- Residential
- Commercial
- Industrial
Data Sources, Market Sizing, and Validation
Desk Research
Desk research started with public data points that help explain the demand pool for smart building solutions in China, then narrowed to what can be measured consistently in the market model. We referred to sources such as the National Bureau of Statistics of China for construction and building stock indicators, and the Ministry of Housing and Urban-Rural Development for building and urban development signals that influence adoption.
To avoid relying on only one data stream, we also used materials such as China's standardization publications, including smart building and building automation related standards, the International Energy Agency for building energy use context, and peer reviewed journals on building management system and controls adoption patterns. On top of this, company annual reports, investor presentations, reputable press coverage, and a paid subscription for company financials, news, and patent intelligence were used to cross-check product focus and pricing direction. These examples are not exhaustive, and we reviewed other public documents and datasets for data collection, validation, and clarification.
Primary Interviews and Surveys
Primary work focused on validating what is getting deployed inside buildings, how projects get priced, and how buying decisions change by building type (residential, commercial, and industrial). We spoke with solution providers, system integrators, facility teams, and other industry experts across major Chinese demand centers so the assumptions from desk research could be corrected where needed, then aligned with real project behavior.
Distribution of primary research fieldwork respondents
| Company type | Respondent position |
|---|---|
| Top tier: 36% | CXOs: 16% |
| Mid tier: 44% | Functional/Unit leaders: 41% |
| Smaller Players: 20% | Managers: 43% |
Market-Sizing & Forecasting
Our sizing uses a top-down approach where building activity and operating demand signals in China are used to reconstruct addressable spend for smart building solutions, then split across solution categories based on adoption and budget shares. Once the demand pool is built, we run selective bottom-up checks using supplier and integrator revenue patterns, sampled project values, and typical system pricing ranges so totals can be adjusted to realistic levels.
Key inputs in the model include the pace of new commercial and residential floor area completion, retrofit intensity in existing buildings, typical penetration of building energy management and lighting controls, connectivity mix (wired versus wireless), and average project spend per building type. Because the term "smart building" is used loosely in the market, we cross-check the spend logic against observable deployment signals such as policy-backed efficiency programs and the share of buildings adopting intelligent security and workplace management platforms. Forecasts were built using scenario analysis, testing variables like construction cycle direction, retrofit acceleration, and pricing movement in hardware and software, then aligning them with expert expectations from primary discussions. Where bottom-up data is thin for smaller cities or less reported building categories, gaps are handled through conservative proxy ratios linked to building stock and project density, followed by rechecks with interview feedback.
Data Validation & Update Cycle
Results are validated through triangulation across the model output, desk indicators, and interview inputs so any one source does not overly influence the final number. We run variance checks across solution splits, building types, and connectivity shares, and any sharp jumps are investigated using project cycle explanations and pricing changes before sign-off.
Before publication, the dataset and calculations go through a multi-step analyst review, and we re-contact experts when a key assumption moves or when a new policy or demand shock emerges. The report is refreshed annually, and interim updates are added when material market events occur. Right before delivery, we do a fresh review pass so clients receive the latest updated view that still matches the defined scope.
Mordor Intelligence's China Smart Building Market Size Compared With Other Published Estimates
Published market sizes for China smart building can vary widely because the label covers adjacent spends, and each publisher draws the line differently across solutions, building types, and what gets counted as "smart." Differences also come from how pricing is treated, whether retrofit revenue is fully captured, and how currency timing is handled for multi-year comparisons.
The benchmark table shows a wide spread that mostly traces back to scope and what is recognized as smart building revenue, rather than a disagreement on the direction of growth. In Mordor Intelligence's model, the value is tied to defined smart building solutions like building energy management, infrastructure management, intelligent security, lighting control, and integrated workplace management platforms, instead of folding in broader construction digitization or generic IT spend that is not used for building operations.
Benchmark comparison
| Source | Market Size | Gaps in Research Methodology |
|---|---|---|
| Mordor Intelligence | USD 96.31 B (2025) | |
| Industry Research Portal A | USD 92.00 B (2025) | Uses a narrower view that mainly tracks new-build deployments, and it applies tighter inclusion rules for software and services, which can undercount retrofit-heavy categories like energy and lighting controls. |
| Trade Journal B | USD 118.50 B (2025) | Often extends the scope to include broader building digitization budgets and adjacent smart city or property IT programs, and it may assume faster average selling price increases without consistent project-level checks. |
Looking across the three figures, the main takeaway is that the spread is explained by what gets included and how retrofit and services revenue are treated year to year. By using clear solution boundaries, practical pricing and penetration inputs, and repeated interview-based checks, the market total stays traceable to a demand pool that can be reviewed and repeated.
Key Questions Answered in the Report
How large is the China smart building market in 2026?
The China smart building market size stands at USD 109.35 billion in 2026.
What is the projected growth rate for China’s smart building sector to 2031?
The market is set to expand at a 13.55% CAGR, reaching USD 206.44 billion by 2031 over 2026-2031.
Which solution leads current adoption?
Building energy management systems command 37.62% of 2025 revenue, driven by carbon-intensity rules.
Why are wireless networks gaining share in building automation?
5G-Advanced coverage cuts retrofit wiring costs and offers low-latency reliability, giving wireless 63.70% share in 2025.