
China Shrimp Market Analysis by Mordor Intelligence
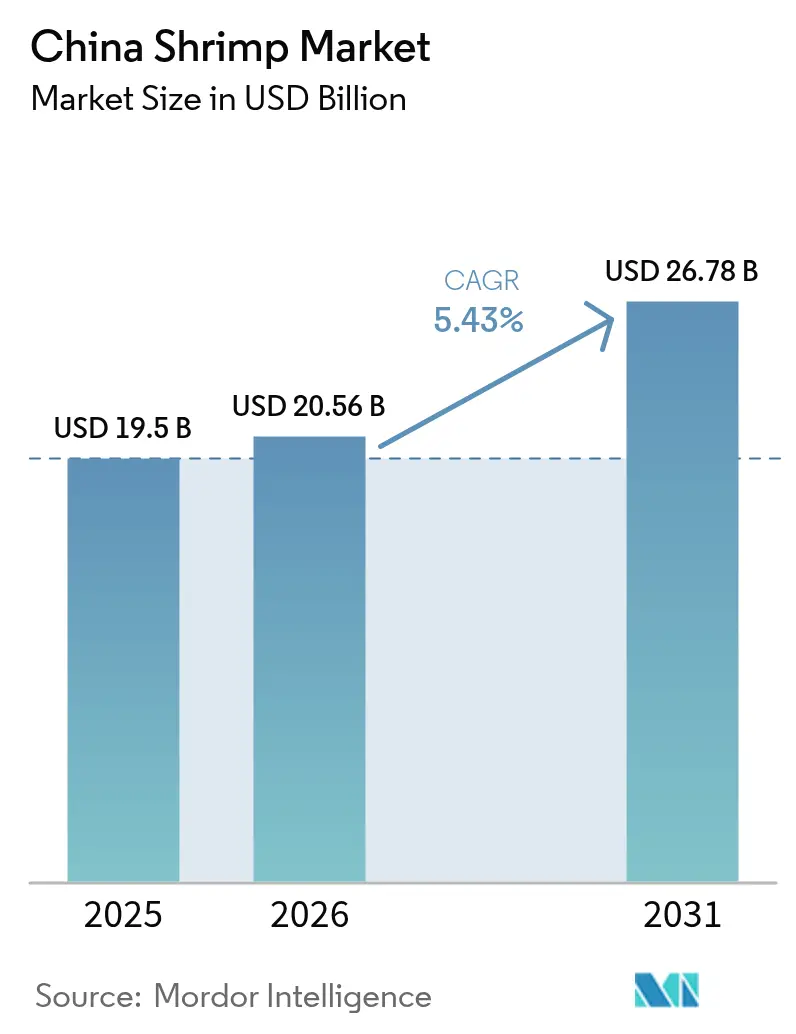
The China shrimp market size is expected to grow from USD 19.5 billion in 2025 to USD 20.56 billion in 2026 and is forecast to reach USD 26.78 billion by 2031 at 5.43% CAGR over 2026-2031. This growth is attributed to rising household spending, advancements in cold-chain infrastructure, and the adoption of recirculating aquaculture systems. However, low-cost imports from Ecuador are constraining pricing power. Domestic production is supported by innovations such as advanced greenhouse technology and solar-aquaculture hybrids, which are enhancing yields and addressing the challenges posed by coastal land-use restrictions on pond expansion. Urban consumers' preference for shrimp as a lean, health-conscious protein continues to drive demand. Conversely, stricter discharge regulations and recurring disease outbreaks are increasing production costs, leading small-scale producers to either consolidate operations or exit the market.
Key Report Takeaways
- By trade flow, Ecuadorian shrimp led with 65.74% of the China shrimp market share in frozen import volume during 2025, while India-origin shipments are forecast to grow at 7.01% CAGR through 2031.
Note: Market size and forecast figures in this report are generated using Mordor Intelligence’s proprietary estimation framework, updated with the latest available data and insights as of 2026.
China Shrimp Market Trends and Insights
Drivers Impact Analysis*
| Driver | (~) % Impact on CAGR Forecast | Geographic Relevance | Impact Timeline |
|---|---|---|---|
| Rising disposable income and preference for lean protein | +1.2% | National, strongest in Tier-1 and Tier-2 cities | Medium term (2-4 years) |
| Government incentives for modern recirculating aquaculture systems | +0.9% | Guangdong, Fujian, Shandong, Hainan, and Guangxi | Long term (≥ 4 years) |
| Strategic pivot to disease-resistant Specific Pathogen Free (SPF) broodstock | +0.8% | Major breeding centers nationwide | Medium term (2-4 years) |
| Vertical integration of processing and cold-chain logistics | +0.7% | Guangdong, Shandong, and Jiangsu | Long term (≥ 4 years) |
| Growing online B2B seafood procurement platforms | +0.6% | Coastal and Yangtze Delta regions | Short term (≤ 2 years) |
| Synergies with solar-aquaculture infrastructure | +0.5% | Provinces with high solar irradiance | Long term (≥ 4 years) |
| Source: Mordor Intelligence | |||
Rising Disposable Income and Preference for Lean Protein
Household consumption reached 39% of national GDP in 2024 and is projected to rise 3%-4% annually to 2035, creating a broad base of purchasing power for premium seafood. Per-capita meat intake doubled between the mid-1990s and 2024, and shrimp is gaining share because urban millennials favor low-fat protein that aligns with fitness trends. Foodservice revenue expanded 8.4% year-over-year in the first five months of 2024 as restaurants aggressively featured shrimp in quick-service menus. E-commerce data show that even amid 12% average price deflation during 2023, premium shrimp maintained stable margins, indicating buyers will pay for traceability and perceived freshness. The demographic engine behind this demand, millennials and Gen Z, has higher disposable income, is digitally savvy, and values sustainability credentials, giving suppliers that adopt Environmental, Social and Governance (ESG) labeling a clear advantage. As middle-class households migrate inland, cold-chain growth is extending its reach, stimulating demand beyond coastal cities.
Government Incentives for Modern Recirculating Aquaculture Systems
Provincial subsidies and low-interest loans are accelerating recirculating aquaculture system (RAS) roll-outs that recycle water and slash pathogen exposure. Hubei made substantial investments in 2024 to support in constructing of greenhouse facilities, while Shandong offers tax rebates covering 30% of capital expenditure for farms that meet biosecurity benchmarks [1]Hubei Provincial Government, “RAS Subsidy Program 2024,” Hubei.gov.cn. The recirculating aquaculture system (RAS) units achieve 3-5 times higher stocking density and cut water use by 90%, satisfying strict discharge rules while maximizing land productivity [2]Ministry of Agriculture and Rural Affairs, “Cold-Chain Treatment Report 2023,” Moa.gov.cn. The systems also enable year-round cycles, smoothing seasonal price swings that previously reached 60%. Payback periods of 4-6 years are proving attractive for mid-sized farms with credit access. Suppliers of filtration membranes and sensor suites are benefitting from a wave of retrofit orders. Over time, recirculating aquaculture system (RAS) adoption should raise national output without expanding coastal footprints, supporting the long-run competitiveness of the China shrimp market.
Strategic Pivot to Disease-Resistant Specific Pathogen Free (SPF) Broodstock
Losses from acute hepatopancreatic necrosis disease (AHPND) and white spot syndrome have exceeded USD 3 billion since 2010, pushing growers toward specific pathogen-free (SPF) broodstock that lowers mortality to 10%-15% versus 40%-100% in conventional ponds. Guangdong and Hainan breeding centers now generate a significant number of post-larvae annually, yet demand still outstrips supply by 30% during peak March-May stocking. Genome-editing research, including the Clustered regularly interspaced short palindromic repeats (CRISPR) applications, has demonstrated 45% yield gains in tilapia and is on track for Pacific white shrimp trials estimated by 2027 [3]Nature Biotechnology, “Genome Editing Applications in Aquaculture,” Nature.com. Regulatory pathways remain uncertain, but early adoption promises a first-mover edge. Higher survival rates reduce feed wastage and antibiotic use, aligning with government efforts to curb antimicrobial resistance. Capital investment in hatcheries is likely to accelerate as integrated players aim for closed-loop genetic control and to capture premium prices from disease-conscious buyers.
Vertical Integration of Processing and Cold-Chain Logistics
Origin-level blast freezing covered majority of aquatic products in 2023, illustrating a national push to curtail spoilage and elevate product grade. Total cold-storage capacity has climbed significantly, and Yuhu Cold Chain now runs IoT-enabled warehouses in Guangzhou, Chengdu, and Wuhan that guarantee stable -18 °C storage from harvest to retail shelf. Integrating feed mills, hatcheries, processing plants, and e-commerce channels lets producers capture 15%-25% of the final retail margin, bypassing distributors who formerly took 30%-40%. Blockchain traceability reassures consumers and supports premium positioning. AI-optimized route planning has shaved last-mile costs 12%-18%, enabling same-day delivery within 200 kilometers of production hubs. As online grocery penetration edges toward 25% of food retail by 2027, integrated operators can lock in market access and defend against fluctuating wholesale prices.
Market Restraints*
| Restraint | (~) % Impact on CAGR Forecast | Geographic Relevance | Impact Timeline |
|---|---|---|---|
| Recurring acute hepatopancreatic necrosis disease outbreaks | −0.8% | National, highest in pond systems | Short term (≤ 2 years) |
| Volatile feed ingredient costs (soybean, fishmeal) | −0.7% | National, all systems | Medium term (2-4 years) |
| Strict coastal discharge and ecological regulations | −0.6% | Guangdong, Fujian, Shandong, Hainan, and Guangxi | Long term (≥ 4 years) |
| Intensifying competition from low-cost Ecuadorian imports | −0.9% | Retail and foodservice channels nationwide | Medium term (2-4 years) |
| Source: Mordor Intelligence | |||
Recurring Acute Hepatopancreatic Necrosis Disease Outbreaks
Acute Hepatopancreatic Necrosis Disease Outbreaks (AHPND), driven by Vibrio parahaemolyticus bearing the pirAB toxin genes, routinely causes 40%-100% pond mortality within 20-30 days post-stocking at water temperatures above 28 °C. Biosecurity practices, water filtration, probiotics, and quarantine remain the only defense because no approved therapeutics exist. White spot syndrome virus compounds the burden in many coastal sites. Transitioning to RAS facilities can cut infection vectors, yet demands USD 70,000-280,000 per hectare, a barrier for smallholders who still account for roughly 60% of output. Insurance uptake hovers below 15%, leaving most growers exposed to catastrophic losses. Disease flare-ups, therefore, dampen stocking confidence, delay harvests, and temper the medium-term expansion of the China shrimp market.
Volatile Feed Ingredient Costs (Soybean, Fishmeal)
Fishmeal prices spiked in mid-2024 due to El Niño-driven reductions in Peruvian anchovy landings, while soybean meal also rose because of severe drought conditions in South America. Feed forms 50%-60% of total operating costs, so a 10% price rise trims farm margins by 5-6 points. Alternative proteins, such as insect meal or algae, remain 20%-40% costlier and face regulatory hurdles. Even as genetic selection and precision feeding have lifted feed conversion ratios from 1.8:1 to 1.5:1 over the past decade, further gains require automated feeders costing USD 14,000-42,000 per installation. Margin squeeze reduces reinvestment in biosecurity and innovation, slowing productivity gains needed to offset flat farm-gate prices.
*Our forecasts treat driver/restraint impacts as directional, not additive. The impact forecasts reflect baseline growth, mix effects, and variable interactions.
Geography Analysis
Guangdong produces a major share of the national shrimp volume in 2025, due to its 1,900-kilometer shoreline, warm climate, and proximity to Hong Kong and Macau export gateways . Shandong followed, leveraging greenhouse technology that enables winter culture and earns premiums during seasonal shortages. Fujian, Hainan, and Guangxi together delivered a significant share of output, supported by high-salinity coastlines and established hatchery clusters. Coastal protection statutes cap horizontal expansion, funneling capital toward yield-intense RAS projects and solar-aquaculture hybrids that maximize output per hectare. Inland provinces such as Hubei and Jiangsu now deploy RAS at scale, demonstrating geographic diversification of supply.
Consumption patterns mirror urban income tiers. The Yangtze River Delta, including Shanghai, Jiangsu, and Zhejiang, reports the country’s highest per-capita intake. Pearl River Delta cities, notably Guangzhou and Shenzhen, follow closely. Inland provinces average lower consumption but are steadily catching up as cold-chain penetration deepens.
Regulatory enforcement varies. Guangdong and Fujian perform quarterly discharge audits, spurring rapid adoption of treatment wetlands. Hainan specializes in SPF broodstock, supplying 40% of national demand and exporting post-larvae across Southeast Asia. Jiangsu and Zhejiang focus on processing and logistics, hosting blast-freezing and e-commerce hubs. This specialization highlights the growing maturity of the China shrimp market, where each province leverages its comparative advantages to drive growth.
Regulatory Landscape
China shrimp production and trade operate under food safety, import control, and environmental compliance frameworks led by the General Administration of Customs of China (GACC) and the Ministry of Agriculture and Rural Affairs (MARA). A key trade compliance change is GACC Decree 280, which enters into force in June 2026 and updates the overseas food facility registration system, including mandatory registration for overseas cold storage facilities handling aquatic products. This tightens documentation and audit readiness across imported shrimp supply chains.
On the domestic production side, MARA policy signals continue to push modernization and biosecurity. In July 2025, MARA issued a national notice promoting high-quality development of integrated rice-shrimp farming, with an emphasis on disease-resistant breeding and strengthening local seed supply capacity. This was complemented by provincial technical standards such as Hunan's DB43/T 3233-2025 for integrated whiteleg shrimp and rice farming (implemented in 2025). Input regulation is also evolving, with MARA approving Calysta's FeedKind single-cell protein for use in aquaculture feeds in 2026. This supports efforts to diversify protein sources while aligning with disease management and sustainability objectives.
Value Chain Analysis
China's shrimp value chain spans broodstock and hatchery (post-larvae), feed and functional inputs, grow-out across pond, greenhouse-covered systems, and RAS, then harvesting, primary handling, processing, cold storage, wholesale distribution, and retail/foodservice and e-commerce. Modernization is centered on intensification and tighter biosecurity, but disease management, germplasm constraints, wastewater treatment, and uneven cold-chain and deep-processing coverage remain bottlenecks. These gaps can limit consistent quality and raise losses outside the best-connected coastal clusters.
Trade and distribution dynamics add another layer, as imports remain important for meeting demand for consistent size and supply even alongside large domestic output. Government duty adjustments and border compliance requirements shape landed costs and supplier choices, including import duties on frozen shrimp and prawns (HS 03061790) increasing to 5% in 2025 from 2% in 2024. Industry structure is also shifting toward more formalized, vertically integrated participants that link farming to processing and distribution, with companies such as Zhanjiang Guolian Aquatic Products and Guangdong HAID Group active across processing, logistics, and supply chain coordination. Cold-chain infrastructure increasingly underpins product grading and channel access.
Competitive Landscape
The China shrimp market is fragmented, with the top producers collectively accounting for a small portion of total output. Guangdong HAID Group Co., Ltd. typifies vertical integration, controlling feed mills, SPF hatcheries, contract farms, and processing plants that supply national retail chains. Zhanjiang Guolian Aquatic Products Co., Ltd. e-commerce hub gives it direct access to restaurant chains, capturing distributor margins and shortening payment cycles.
Technology-led entrants deploy genome-editing research and closed-loop RAS to supply premium, antibiotic-free shrimp sought by health-conscious consumers. Blockchain-enabled traceability, wins 15%-20% price premiums in Tier-1 supermarkets. Digital procurement platforms disintermediate traditional wholesalers, forcing incumbents to build direct-sales units or cede margin. Consolidation is projected as stricter environmental rules render sub-scale farms unviable, giving well-capitalized players an acquisition pathway to expand pond inventory without greenfield permits.
White-space opportunities include genome-edited SPF lines projected for commercial availability by 2027 and offshore cage farming supported by 5G telemetry that mitigates land constraints. Firms that secure intellectual property and regulatory approvals early will command a technology moat. Cold-chain expansion into inland Tier-3 cities offers incremental market share gains, while cross-border e-commerce opens limited but lucrative channels for high-end value-added products.
Market Opportunities and Future Outlook
Technology-enabled breeding and biosecurity offer a commercialization pathway as disease pressure and tightening discharge compliance push farms toward higher-control production. A near-term opportunity sits in hatchery, genetics, and digital breeding tools, supported by public and academic initiatives such as the June 2026 launch of BlueOmniBreed 1.0 by the Qingdao Institute of Blue Seed Industry and Ocean University of China, which includes shrimp-specific models. This supports whitespace for genetics services, SPF post-larvae capacity expansion, and farm-side adoption of decision tools that shorten selection cycles and improve survival, particularly for integrated operators focused on more consistent stocking performance.
Value-added processing and export-oriented quality upgrades also remain actionable. Evidence of outbound momentum appears in 2026, with China Customs data showing shrimp exports reached 3,782 tons in April 2026, the highest monthly volume in 2026 up to that point and above pre-Spring Festival levels. In parallel, sector coordination around sustainability and smart aquaculture is being institutionalized via platforms such as the First FAO-CFA Joint International Conference on Sustainable Aquaculture held in Fuzhou in March 2026. This reinforces demand for traceability, green production methods, and standardized supply that can support both domestic premium channels and export compliance requirements.
Recent Industry Developments
- July 2026: Daixiaji opened an industrial integration demonstration base in Rudong, Jiangsu, in partnership with Nantong Hongjie Aquatic Products, covering standardized green farming and primary processing. This expands source-to-processing control and supports more consistent quality for branded shrimp products.
- June 2026: Tongwei Agricultural Development unveiled its shrimp feed microparticle production base in Jiangsu and launched the Tongwei Beyond shrimp fry feed series. The facility and product rollout broaden specialized early-stage nutrition supply, reinforcing the move toward intensive systems that rely on higher-performance feed inputs.
- November 2024: Zhanjiang Guolian Aquatic Products announced an investment of USD 1.52 million in a new marine industry investment fund. This strengthens supply chain influence across farming, processing, and distribution and aligns with the sector shift toward better-coordinated, capital-backed operations.


Research Methodology Framework and Report Scope
Market Definition and Coverage
For this report, the market covers the value of shrimp supplied in China, linked to farmed production and trade flows, and priced at the first point where shrimp is sold into the market (volumes are tracked in metric tons for sense checks).
Scope exclusions: we do not count feed, hatchery inputs, farm equipment, non-shrimp seafood, or cooked meal services that use shrimp as an ingredient.
Segmentation Overview
- By Country
- Production Analysis (Volume)
- Consumption Analysis (Volume and Value)
- Import Analysis (Volume and Value)
- Export Analysis (Volume and Value)
- Price Trend Analysis
Data Sources, Market Sizing, and Validation
Desk Research
We start with desk research to map shrimp supply, trade, and pricing, so the model can be rebuilt and checked using public series. Common starting points include China Customs trade statistics, FAO fishery and aquaculture datasets, and releases from China government agencies that cover fisheries output and food consumption.
We also review technical and market context from peer reviewed aquaculture journals, customs and port bulletins, and trade association publications tied to seafood processing and cold chain handling. To connect the numbers to operating activity, we use company filings, investor presentations, and credible press coverage on import trends and shrimp price movements. In a few places, paid subscriptions for company financials and news, shipment level import export data, and patent databases are used to cross-check scale and timelines, especially where public detail is thin. The desk sources listed here are illustrative, and other public documents were used for validation and clarification during the work.
Primary Interviews and Surveys
Primary work is used to confirm how market value is counted in practice and to stress test assumptions that desk sources do not settle cleanly. We speak with shrimp farmers, processors, importers, distributors, and foodservice oriented buyers, then we validate price spreads, conversion factors, and seasonality patterns across major producing and consuming provinces.
Because trade can shift quickly, we also gather feedback from respondents who track import flows and cold chain throughput, which helps us adjust the model when prices or volumes move faster than annual statistics.
Distribution of primary research fieldwork respondents
| Company type | Respondent position |
|---|---|
| Top tier: 30% | CXOs: 15% |
| Mid tier: 54% | Functional/Unit leaders: 34% |
| Smaller Players: 16% | Managers: 51% |
Market-Sizing & Forecasting
Sizing starts with a top-down build that reconstructs China shrimp value from the demand pool and supply balance, using domestic production plus net trade, then applying market-relevant price series to the usable volume. Where needed, conversion factors are applied so form differences do not inflate totals, and the result is checked against realistic consumption and distribution capacity signals.
We then use a selective bottom-up approximation to confirm the order of magnitude, such as sampled price times volume checks at key channels and a roll-up of larger processors and importers where public disclosures exist. Inputs that commonly move the model include shrimp farming output trends, import volumes and average import values, farmgate and wholesale price movements, disease impact years, and cold chain expansion signals that change distribution reach.
For forecasting, we use scenario analysis supported by light regression on a few drivers that respondents consistently cite, including import price cycles, production recovery patterns after disease events, and household spending sensitivity for seafood. When gaps show up in bottom-up checks, we document the missing coverage and adjust using conservative ranges agreed through interviews, before the final number is set.
Data Validation & Update Cycle
We validate the numbers through triangulation across independent signals, then run anomaly checks on volume value ratios, sudden price jumps, and trade balance shifts. If a data point breaks the expected relationship, we recheck the underlying assumption and, when needed, recontact respondents to confirm what changed on the ground.
Before sign-off, the full model and key assumptions go through a multi-step analyst review so calculation logic, units, and currency timing are consistent. Reports are refreshed annually, and interim updates are made when material events occur, such as sharp import price swings, disease outbreaks, or policy changes affecting aquaculture operations. Right before delivery, we perform a final pass so the view reflects the latest available releases and validated market signals.
Mordor Intelligence's China Shrimp Market Sizing Compared With Other Published Estimates
Published market sizes for China shrimp often differ because studies do not always count the same value point, and they can also use different timing for prices and currency conversion. Differences also come from how trade is handled, since imported shrimp can be reprocessed and sold through multiple channels.
Some estimates lean toward a broader retail style number or use a different base year, which can shift totals even if growth rates look similar. Mordor Intelligence counts shrimp market value using a supply balance plus price approach tied to production and net trade checks, and it avoids double counting from reprocessing passes that can otherwise inflate the value.
Benchmark comparison
| Source | Market Size | Gaps in Research Methodology |
|---|---|---|
| Mordor Intelligence | USD 19.50 B (2025) | |
| Industry Research Publisher A | USD 18.29 B (2024) | Uses a different base year and provides limited clarity on whether values reflect farmgate, wholesale, or retail pricing, which can shift the level when prices moved in 2024. |
| Industry Research Publisher B | USD 24.23 B (2030) | Reports a later forecast year and can embed a more aggressive price progression or demand recovery path, which lifts the 2030 value even if volume growth is moderate. |
The table shows that year selection and the price point applied explain most of the spread across published values. By grounding totals in production, trade, and price consistency checks, we keep the estimate traceable to clear steps that can be repeated when new statistics arrive.


Key Questions Answered in the Report
What is the current value of the China shrimp market?
The market is valued at USD 20.56 billion in 2026 and is on track to hit USD 26.78 billion by 2031.
How fast is the China shrimp market growing?
The market is expanding at a 5.43% CAGR through 2031, supported by technology upgrades and rising consumer demand.
Which province leads shrimp production in China?
Guangdong tops the list, contributing about 34.70% of national output thanks to its long coastline and warm climate.
Why are recirculating aquaculture systems important?
Recirculating Aquaculture Systems (RAS) units boost stocking density up to five-fold and cut water use 90%, helping farms meet strict discharge rules while raising yields.
Page last updated on:


 Your data is secure and never sold or shared.


