
China Sensors Market Size and Share
Market Overview
| Study Period | 2020 - 2031 |
|---|---|
| Forecast Data Period | 2026 - 2031 |
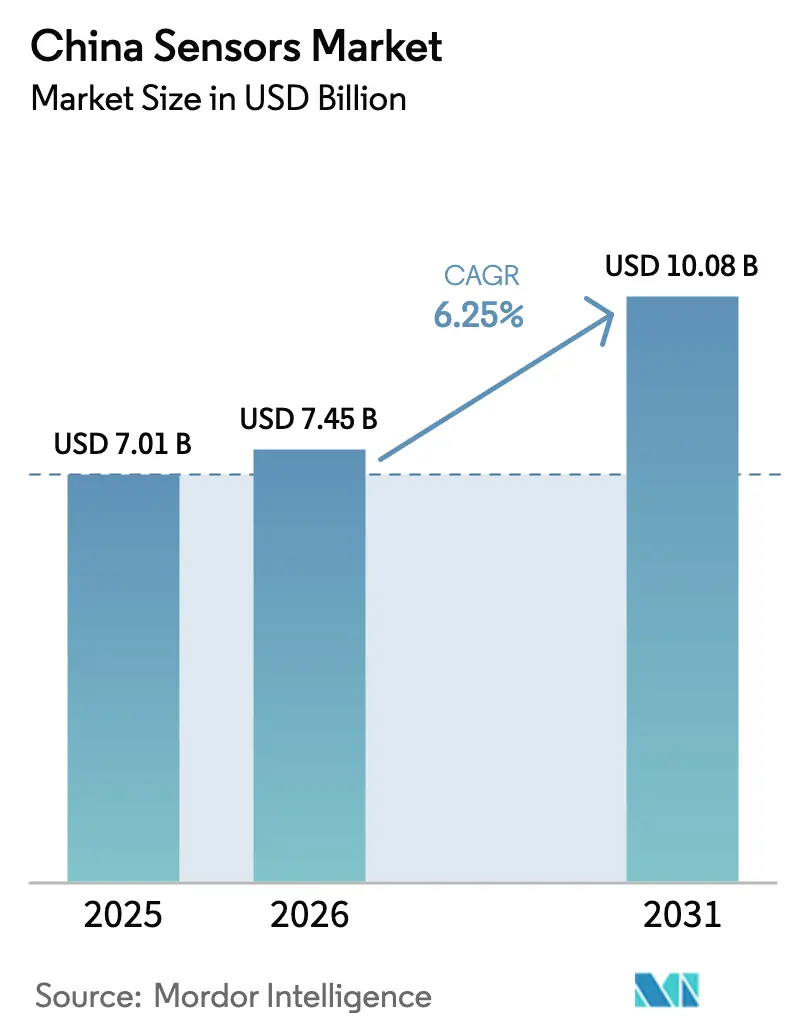
| Base Year Market Size (2025) | USD 7.01 Billion |
| Market Size (2026) | USD 7.45 Billion |
| Market Size (2031) | USD 10.08 Billion |
| Growth Rate (2026 - 2031) | 6.25% CAGR |
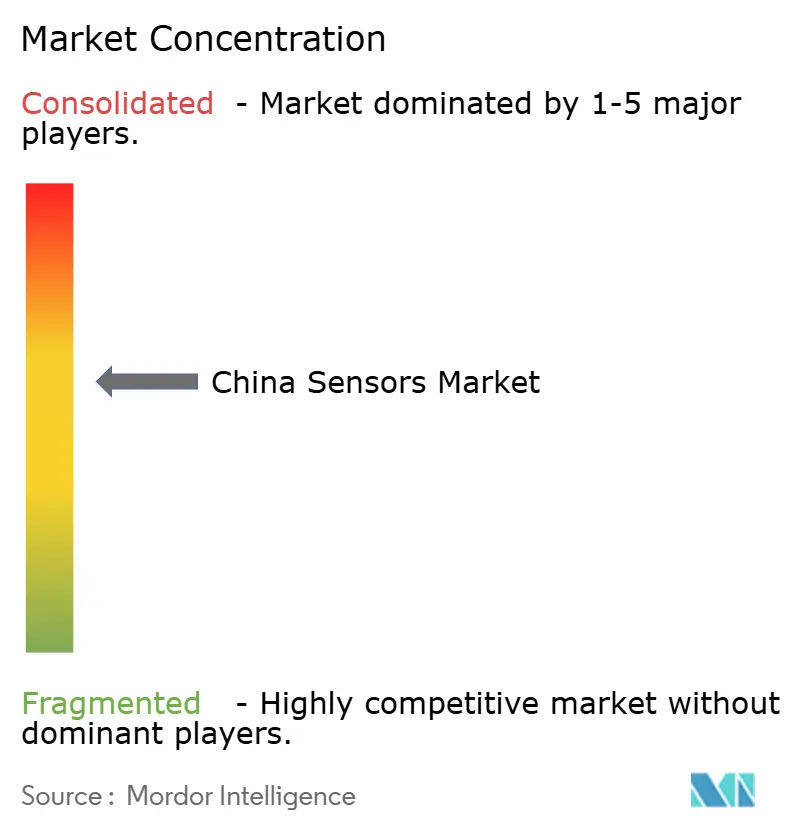
| Market Concentration | Medium |
Major Players *Disclaimer: Major Players sorted in no particular order Image © Mordor Intelligence. Reuse requires attribution under CC BY 4.0. | |
China Sensors Market Analysis by Mordor Intelligence
China sensors market size in 2026 is estimated at USD 7.45 billion, growing from 2025 value of USD 7.01 billion with 2031 projections showing USD 10.08 billion, growing at 6.25% CAGR over 2026-2031. Unit shipments are projected to climb from 14.59 billion to 27.68 billion units over the same period, a 13.66% volume CAGR that underscores intensifying price pressure as production scales. Policy-driven localization, rapid electric-vehicle (EV) build-out, and large-scale consumer-electronics manufacturing continued to stimulate demand, while falling 8-inch MEMS wafer costs widened addressable end-markets. Competitive dynamics shifted as domestic suppliers leveraged government incentives, wafer cost advantages, and proximity to downstream assemblers to close technology gaps with multinational incumbents. Geographically, Pearl River Delta consumer-electronics clusters, Yangtze River Delta smart-manufacturing hubs, and Beijing-Tianjin-Hebei research corridors remained the three principal engines of growth.
Key Report Takeaways
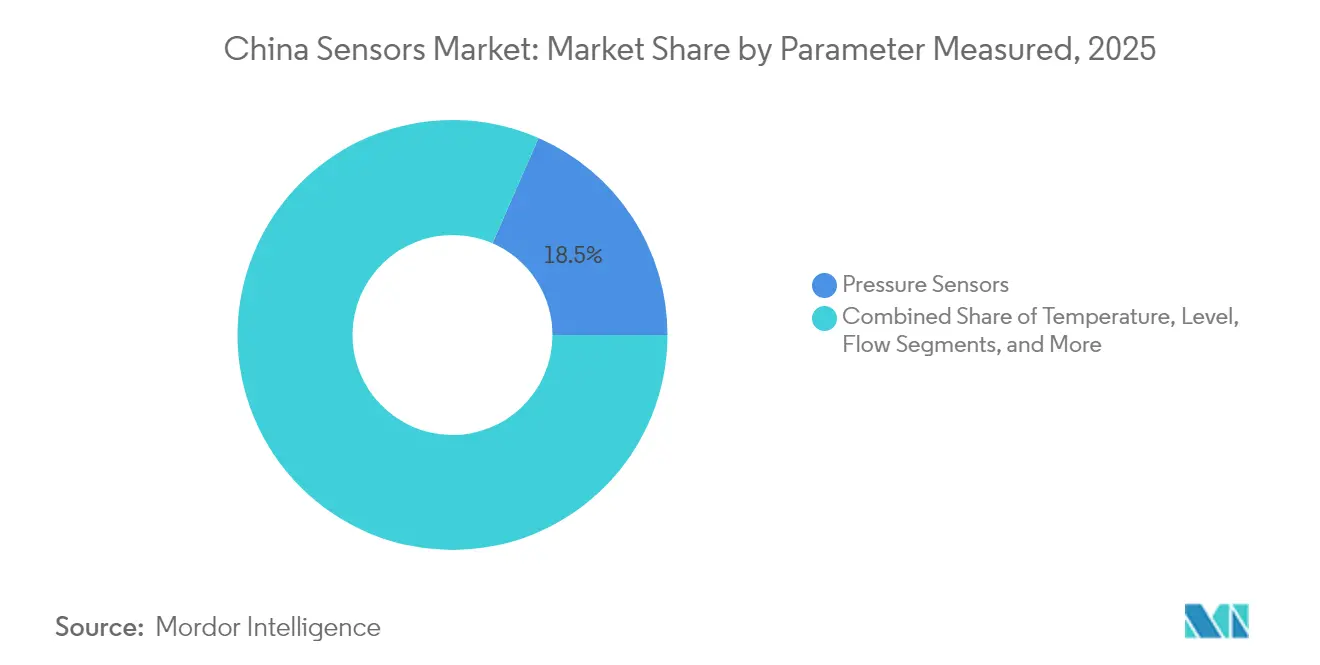
- By parameter measured, pressure sensors led with 18.45% of China sensors market share in 2025, whereas environmental sensors are on track for a 16.59% CAGR to 2031.
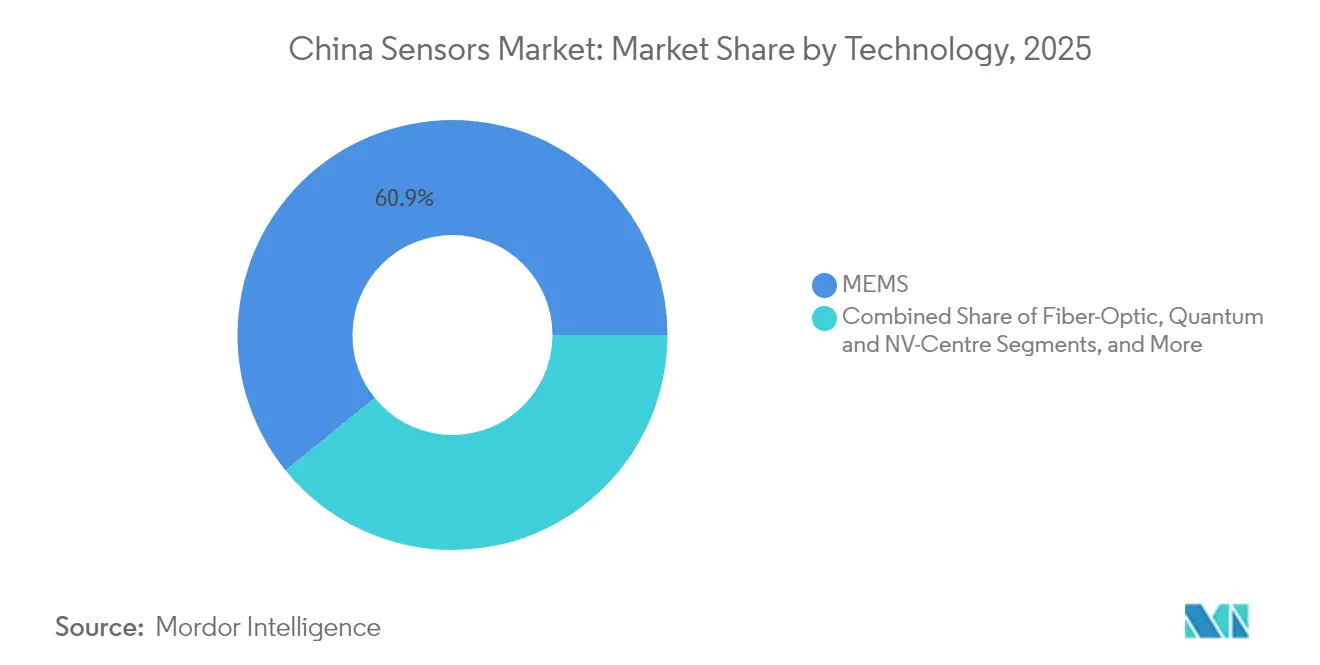
- By technology, MEMS held 60.85% of the China sensors market share in 2025, while quantum sensors are forecast to expand at 27.5% CAGR between 2026–2031.
- By mode of operation, piezoresistive devices commanded 31.75% of the China sensors market size in 2025; LiDAR is projected to grow at 21.53% CAGR through 2031.
- By end-user industry, consumer electronics captured 34.55% of the China sensors market size in 2025; automotive is the fastest-growing segment at 12.71% CAGR to 2031.
Note: Market size and forecast figures in this report are generated using Mordor Intelligence’s proprietary estimation framework, updated with the latest available data and insights as of 2026.
China contributes to a system defined not by any single country or region but by the interaction of many. The global sensors market data by Mordor Intelligence represents that combined structure.
China Sensors Market Trends and Insights
Drivers Impact Analysis*
| Driver | (~) % Impact on CAGR Forecast | Geographic Relevance | Impact Timeline |
|---|---|---|---|
| Government-led "Made in China 2025" localisation push for sensor supply chains | 1.8% | National, with a concentration in manufacturing hubs of Shenzhen, Shanghai, and Beijing | Long term (≥ 4 years) |
| EV production surge boosting demand for high-temperature, pressure, and current sensors | 1.5% | National, with a concentration in automotive manufacturing centres | Medium term (2-4 years) |
| Mass-manufacturing of smartphones and IoT wearables clustering in Guangdong raises MEMS volumes | 1.2% | Guangdong province, with spillover to Jiangsu and Zhejiang | Medium term (2-4 years) |
| Smart-factory retrofits across the Yangtze River Delta are accelerating industrial sensor uptake | 0.9% | Yangtze River Delta (Shanghai, Jiangsu, Zhejiang) | Medium term (2-4 years) |
| Rising adoption of remote patient monitoring and digital health platforms is driving the medical sensors market | 0.7% | Tier-1 and Tier-2 cities nationwide | Long term (≥ 4 years) |
| Falling 8-inch MEMS wafer costs from domestic foundries are widening sensor addressable markets | 0.6% | National, with a concentration in semiconductor manufacturing hubs | Short term (≤ 2 years) |
| Source: Mordor Intelligence | |||
Government-led “Made in China 2025” localization push
Large-scale fiscal incentives and mandated procurement preferences lifted domestic content in core sensor components toward 70% by 2025, compared with about 40% in 2020.[1]Molnar et al., “China’s Manufacturing Innovation Centers,” National Institute of Standards and Technology, nist.gov More than 33 Manufacturing Innovation Centres had been launched by early 2025, anchoring joint R&D between universities and enterprises. Preferential financing, expedited certification, and IP support further reduced entry barriers for local firms, fostering a vertically integrated value chain that now rivals overseas suppliers in pressure, environmental, and inertial categories.
EV production surge boosting demand for high-temperature, pressure, and current sensors
EV sales exceeded 3.5 million units in 2024, sustaining a triple-digit expansion from pre-2023 levels and lifting per-vehicle sensor content at an 8–10% annual pace. BYD bundled its ‘God’s Eye’ smart-driving platform across the full model line without extra cost, normalizing advanced thermal-management, battery-pressure, and current-measurement arrays even in mass-market cars. The trend strengthened order books for domestic MEMS and shunt-based current-sensor makers positioned closest to major assembly hubs.
Mass manufacturing of smartphones and IoT wearables clustering in Guangdong
Handset and wearable factories in Guangdong averaged 11–14 and 6–8 sensors per unit, respectively, in 2024, pushing annual MEMS output into the multi-billion range and lowering unit costs through shared tooling and logistics. Proximity between sensor fabs, module houses, and final assemblers accelerated engineering cycles, enabling rapid incorporation of novel barometric, optical, and inertial elements. The cluster effect also encouraged foreign OEMs to dual-source from local fabs, reinforcing regional economies of scale.
Smart-factory retrofits across the Yangtze River Delta are accelerating industrial sensor uptake
The 14th Five-Year Plan prioritized digitalization, prompting factories to install dense sensor networks for asset tracking, energy optimization, and predictive maintenance. Industrial sensor deployments in Shanghai-Jiangsu-Zhejiang grew at 15–18% annually in 2024, nearly double the global average, aided by provincial subsidies for retrofit projects. Customizable modules that interface with legacy PLCs offered local vendors a differentiation avenue versus imported turnkey systems.
Restraints Impact Analysis*
| Restraint | (~) % Impact on CAGR Forecast | Geographic Relevance | Impact Timeline |
|---|---|---|---|
| Dependence on imported specialty wafers creates supply-chain risk | -0.9% | National, with the highest impact on advanced sensor manufacturing | Medium term (2-4 years) |
| A fragmented IP landscape is triggering cross-licensing disputes with incumbents | -0.7% | Global, affecting Chinese manufacturers' export capabilities | Medium term (2-4 years) |
| Price wars among local vendors are eroding R&D budgets | -0.6% | National, particularly affecting smaller domestic manufacturers | Short term (≤ 2 years) |
| China's Cybersecurity Law complicates the deployment of cloud-connected industrial sensors | -0.4% | National, with particular impact on foreign vendors | Short term (≤ 2 years) |
| Source: Mordor Intelligence | |||
Dependence on imported specialty wafers creates supply-chain risk
Despite domestic fabs adding mature-node capacity, China still relied on overseas suppliers for SOI, SiC, and GaN wafers used in high-temperature and photonic sensors. Renewed export-control measures on advanced substrates in 2024 heightened procurement uncertainty and forced buffer-stock policies, increasing working-capital needs. Resulting lead-time volatility constrained the production of cutting-edge automotive and medical devices.
Fragmented IP landscape triggering cross-licensing disputes
Accelerated patent filings by Chinese sensor firms collided with legacy portfolios held by established multinationals, leading to a rise in SEP-related arbitration when exporting to Europe and North America. License fees and litigation added overheads that smaller entrants struggled to absorb, while uncertainty around cross-jurisdiction enforcement slowed time-to-market for novel connected-sensor modules.
*Our forecasts treat driver/restraint impacts as directional, not additive. The impact forecasts reflect baseline growth, mix effects, and variable interactions.
Segment Analysis
By Parameter Measured: Environmental sensors surged amid regulatory push
Pressure sensors accounted for 18.45% of China's sensor market share in 2025, reflecting established automotive, industrial, and handset integration footprints. Environmental sensors represented a smaller base yet posted the fastest 16.59% CAGR forecast, propelled by stricter National Ambient Air Quality Standards and municipal PM2.5 monitoring mandates.
Rapid air-quality site build-outs in Tier-1 cities stimulated demand for micro-precision gas and particulate sensors, pushing the China sensors market size for environmental categories at a significant rate during the forecast period. Consumer IoT air-purifiers and smart-home devices further broadened volume. Meanwhile, flow and level sensors advanced steadily in chemical processing and water-utilities projects, while vibration and magnetic devices gained traction in structural health and autonomous navigation use cases.


By Mode of Operation: LiDAR revolutionized automotive safety systems
Piezoresistive components retained a 31.75% revenue share in 2025, anchored by mature packaging lines and well-established design IP. LiDAR units, however, are projected for a 21.53% CAGR through 2031 as ADAS penetration in mid-range EVs climbs. Hesai and RoboSense jointly shipped more than 520,000 automotive LiDARs in 2024, equal to one-third of global deliveries.
The China sensors market size for LiDAR is expected to approach USD 1.42 billion by 2031 on the strength of national standards such as GB/T 45500-2025 that codify performance metrics. Complementary radar, capacitive-touch, and optical imagers sustained double-digit growth, serving consumer devices and industrial robots that require multi-modal perception arrays.
By Technology: Quantum sensors emerged as a disruptive force
MEMS retained a dominant 60.85% share of the China sensors market size in 2025, helped by falling 8-inch wafer costs and mature-process expansions at SMIC and HuaHong. Quantum devices using nitrogen-vacancy centres in diamond are forecast to scale at 27.5% CAGR, aided by heteroepitaxial growth breakthroughs that allow wafer-level production.
First commercial deployments target EV battery diagnostics and precision navigation. CMOS/IC, thin-film, and fiber-optic platforms expanded in applications ranging from flexible wearables to distributed infrastructure monitoring, further diversifying supply-chain demand inside the China sensors market.
By End-user Industry: The Automotive sector drove an innovation wave
Consumer electronics absorbed 34.55% of 2025 sales through high-volume phones and wearables. The automotive vertical is anticipated to generate the highest incremental revenue, rising at 12.71% CAGR as sensor content per EV surpasses 250 units. The China sensors market size for automotive applications is expected to grow at a rapid rate by 2031, supported by mandatory ADAS regulations and export ambitions of Chinese OEMs.
Industrial, medical, and energy segments each logged double-digit gains as factories digitized operations, health systems embraced continuous monitoring, and utilities rolled out smart-grid hardware. Aerospace and defense procurement remained steady, underpinned by long-cycle programs in civil aviation and satellite remote-sensing.
Geography Analysis
The Pearl River Delta accounted for the major national production value in 2024, giving the region a significant market share thanks to Guangzhou-Shenzhen consumer-electronics clusters that consumed the bulk of MEMS output. Robust handset and wearable demand pushed the local China sensors market size for pressure, proximity, and ambient-light devices at a prominent rate in 2025, and Honeywell’s 2024 decision to expand its Guangdong plant reinforced the zone’s importance to multinational supply chains. Short design-iteration loops, dense subcontractor networks, and export-oriented logistics lowered time-to-market for domestic startups, allowing Guangdong vendors to win follow-on orders from foreign smartphone brands. Provincial incentives that reimburse up to 15% of capital expenditures on new sensing lines further cemented the Pearl River Delta’s leadership position.
The Yangtze River Delta is another prominent region in China's sensors market, as Shanghai, Jiangsu, and Zhejiang factories are retrofitting with smart-manufacturing sensor suites. Mature-node foundries such as SMIC and HuaHong ramped 8-inch MEMS capacity in 2025, slashing die costs and lifting regional shipments of pressure and inertial parts. Local governments offered subsidies that covered 20% of automation-equipment purchases, accelerating edge-connected sensor deployments on legacy production lines. The region also houses leading automotive-electronics campuses, which pulled in high-temperature and current-measurement devices for EV platforms assembled in nearby Ningbo and Changzhou.
The Beijing-Tianjin-Hebei corridor captured nominal share of 2024 revenue yet punched above its weight in R&D, spearheading quantum-sensor breakthroughs that aim to commercialize nitrogen-vacancy diamond devices for navigation and battery diagnostics. Government laboratories in Beijing partnered with universities to secure national-science grants that finance pilot fabrication lines, while Tianjin aerospace suppliers validated radiation-hardened MEMS for satellite constellations. Policy proximity enabled rapid alignment with “Made in China 2025” localization quotas, ensuring preferential procurement for locally developed high-end sensors. The corridor’s focus on early-stage innovation complements high-volume production in the southern deltas, rounding out China’s full-stack sensing ecosystem.
The sensors market is analyzed by Mordor Intelligence across multiple other geographies, with in-depth regional assessments available for Asia and Europe. This is complemented by country-specific insights for South Korea, Taiwan, Japan, and United States, reflecting various localized market behavior and policy environments' coverage.
Regulatory Landscape
China's sensor market operates under a tightening set of product access, data, and export-control frameworks that affect connected and automotive-grade sensing deployments. The Personal Information Protection Law (PIPL) and the Data Security Law continue to shape how industrial, medical, and autonomous systems collect, store, and transmit sensor data, which raises compliance requirements for cloud-connected and cross-border data workflows.
In 2025-2026, compliance anchors widened through both certification and trade-control updates. China Compulsory Certification (CCC) scope expansions for gas detection and fire protection products (July 2025) and charging-related equipment (including electric bike charging devices in November 2025 and EV power charging equipment in August 2026) increased testing and documentation demands for sensor-enabled equipment vendors. Separately, China updated its Dual-Use Catalogue in April 2026 by adding a large set of new entries, including items tied to infrared and LiDAR-relevant materials, which raises licensing diligence for upstream materials and for suppliers with export-oriented programs.
Value Chain Analysis
The China sensors value chain runs from design (sensor ICs, algorithms, and modules) through wafer fabrication (MEMS and mixed-signal on 8-inch lines), packaging and test, module assembly, and then system integration into end equipment across automotive, consumer electronics, industrial automation, and energy. Localization deepened as mature-node foundries expanded 8-inch MEMS output, while downstream clusters in the Pearl River Delta and Yangtze River Delta shortened design-to-ramp cycles through proximity between fabs, OSAT, and high-volume assemblers.
Recent supply-chain actions point to a China-for-China manufacturing posture across adjacent silicon that supports sensor systems. STMicroelectronics initiated volume production of China-manufactured STM32 microcontrollers with Huahong as a local wafer manufacturing partner, improving local availability of the control and interface silicon used across sensor nodes. Bengbu's China Sensor Valley has also been positioned as a full-chain cluster, covering chip design, wafer manufacturing, packaging and testing, and materials, which supports faster supplier qualification loops for domestic OEMs and tier-1s.
Competitive Landscape
The competitive structure of the China sensors market blended concentrated leadership in emerging niches with fragmentation in mature categories. International firms such as Bosch, STMicroelectronics, and Honeywell preserved strong positions in high-precision pressure, temperature, and industrial sensors by leveraging decades of process know-how. Domestic champions Goertek, AAC Technologies, MEMSensing, Hesai, and RoboSense narrowed technology gaps through state incentives, cooperative R&D, and proximity to downstream assemblers.
Strategic positioning diverged between volume-driven players focused on smartphone MEMS and specialists targeting premium automotive or quantum segments. Hesai secured a critical standards advantage in May 2025 by leading the drafting of GB/T 45500-2025 for automotive LiDAR, locking its design parameters into national procurement frameworks.[4]Auto Tech News, “Hesai Leads Development of China’s Automotive LiDAR Standard GB/T 45500-2025,” auto-tech-news.com Mercedes-Benz formalized a partnership with Hesai the following month to co-develop global smart-car platforms, validating Chinese LiDAR technology for export markets. RoboSense built scale by shipping 519,800 automotive LiDAR units in 2024 and captured 26% of the global passenger-car segment, highlighting the speed at which local suppliers can reach international volume leaders. BYD’s choice to bundle its ‘God’s Eye’ sensor suite across all vehicle trims without a premium forced tier-1 vendors to reprice ADAS hardware and stimulated downstream demand.
Cost leadership remained pivotal, with domestic fabs cutting 8-inch MEMS wafer pricing and permitting vertical integration from wafer to module assembly. Bosch reacted by forming a joint venture with Element Six in April 2025 to accelerate commercialization of diamond-based quantum sensors, aiming to differentiate on performance rather than cost. Honeywell’s sensing division returned to growth in late 2024 after expanding local production, demonstrating that multinational incumbents can still compete on scale and service when they localize manufacturing. Even so, a fragmented intellectual-property landscape and escalating cross-licensing costs continued to siphon resources from R&D and posed a barrier for smaller sensor startups seeking export certifications.
China Sensors Industry Leaders
Bosch Sensortec GmbH
STMicroelectronics NV
Honeywell International Inc.
Will Semiconductor Co. Ltd.
Omron Corporation
- *Disclaimer: Major Players sorted in no particular order

Market Opportunities and Future Outlook
White-space is concentrated in higher-value sensor modules and sensor-plus-compute subsystems that meet automotive and industrial localization targets while operating within tighter data and certification requirements. In automotive, domestic substitution of automotive sensing chips reportedly moved above 40% in 2026, creating room for local vendors to progress from discrete components into qualified modules (for example, battery thermal management, pressure and current measurement arrays, and multi-sensor ADAS perception stacks) that domestic OEMs can procure at scale.
Cluster-led capacity and application build-outs also support new program ramp-ups. Bengbu's China Sensor Valley is expanding as a full industrial chain hub, with Huaxin Micro-Nano Integrated Circuit Co. operating an 8-inch MEMS wafer line cited at 30,000 wafers per month, which improves access to mature-node MEMS supply for consumer and industrial deployments. On the demand side, robotics and smart manufacturing are driving new multi-modal sensing requirements at the edge; Bosch's establishment of the Bosch Robotics Center China in 2026 signals active productization efforts around robotics that intensify requirements for perception, inertial, force, and environmental sensing modules sourced and supported locally.
Recent Industry Developments
- June 2026: Bosch establishes the Bosch Robotics Center China (BROC) and signs strategic cooperation with Spirit AI for robot data and component development. The collaboration advances robotics and embodied AI sensor applications in China. Strengthens China as an innovation hub, while accelerating co-development of sensor-enabled robotics and AI-enabled sensing ecosystems.
- April 2026: Honeywell signs strategic cooperation with Zhejiang Chunhui Intelligent Control to collaborate on intelligent diagnosis, measurement management, and digital operation of gas industry infrastructure. The initiative enhances industrial gas sensing and automation in China. Deepens local sensing and digital operation capabilities in critical infrastructure, and expands local sensor ecosystem participation.
- March 2026: STMicroelectronics begins volume production of STM32 microcontrollers in China with foundry partner Huahong, with further localization planned for end-2026. The localized MCU supply supports sensors and automotive applications in China. It advances China-for-China semiconductor manufacturing and autosensorization, while strengthening domestic supply chain resilience.


Research Methodology Framework and Report Scope
Market Definition and Coverage
For this study, the China sensors market is defined as revenues generated from sensor components and modules sold into China across major end uses, counted in USD at the point they are supplied into the domestic value chain.
Scope exclusions: We exclude downstream systems integration, software-only analytics, and services that sit on top of sensing hardware.
Segmentation Overview
- By Parameter Measured
- Temperature
- Pressure
- Level
- Flow
- Proximity
- Environmental (Air-quality, Gas)
- Chemical
- Inertial (Accel/Gyro)
- Magnetic
- Vibration
- Other Parameters
- By Mode of Operation
- Optical
- Electrical Resistance
- Biosensors
- Piezoresistive
- Image
- Capacitive
- Piezoelectric
- LiDAR
- Radar
- Other Modes
- By Technology
- MEMS
- CMOS / IC Sensors
- Fiber-Optic
- Quantum and NV-Centre
- Others (O-NEMS, Thin-Film)
- By End-user Industry
- Automotive
- Consumer Electronics
- Smartphones
- Tablets, Laptops and PCs
- Wearables
- Smart Home Devices
- Other Consumer Electronics
- Energy (Generation and Storage)
- Industrial and Manufacturing
- Medical and Wellness
- Construction, Agriculture and Mining
- Aerospace and Defense
Data Sources, Market Sizing, and Validation
Desk Research
Desk work starts with building a clear demand map by end industry and then attaching the right sensor intensity to it. We reference public series such as China customs trade statistics, National Bureau of Statistics of China industrial output indicators, MIIT policy and industry releases, and standards catalogs from bodies such as SAC, because these help explain production trends and adoption requirements.
To keep assumptions grounded, we also use company annual reports, audited financial statements, and investor presentations to understand product mix and realized pricing ranges. Patent databases are reviewed to see where sensing technologies are moving (for example, MEMS and automotive-grade designs), and shipment level import and export databases are used selectively to sanity check flows where official totals look delayed. The desk sources listed here are illustrative only, and many other public documents were also used for data collection, cross-checks, and clarification.
Primary Interviews and Surveys
Primary work is used to pressure test the desk assumptions, especially around average selling price movement, local sourcing share, and where demand is shifting across consumer electronics, automotive, and factory automation. We speak with a mix of manufacturers, channel participants, and large user industries across China, and then we re-check any wide gaps with follow-up questions so the model inputs stay consistent.
Distribution of primary research fieldwork respondents
| Company type | Respondent position | Region |
|---|---|---|
| Top tier: 37% | CXOs: 14% | |
| Mid tier: 49% | Functional/Unit leaders: 42% | |
| Smaller Players: 14% | Managers: 44% |
Market-Sizing & Forecasting
The core sizing is built using a top-down demand pool reconstruction where China end-industry output and device builds are translated into sensor units per application, which are then multiplied by category-level pricing to reach value. To keep it realistic, we corroborate the totals with selective bottom-up approximations from supplier revenue disclosures, sampled ASP x shipment checks for high-volume sensor families, and channel checks on mix shifts.
Inputs that matter in this market include smartphone and consumer electronics build cycles, EV and ADAS installation rates, factory automation investment patterns, import substitution progress for key components, and observed unit shipment growth (which helps explain pricing pressure when volumes rise faster than value). For forecasting, scenario analysis is used around macro demand and localization pace, followed by an exponential smoothing pass on pricing so rapid ASP drops do not get overstated in later years. When a bottom-up cross-check is missing for a niche category, we fill the gap using adjacent application ratios validated through interviews, and then the totals are rebalanced back to the demand pool.
Data Validation & Update Cycle
Outputs are validated through multiple checks so the final number is not dependent on one series. We compare implied sensor units against independent indicators like device production, trade flows, and capacity announcements, and then investigate outliers before locking assumptions.
A second analyst review is completed to test whether the same result holds when key inputs like ASP bands or adoption rates are shifted within reasonable ranges. The report is refreshed annually, and interim updates are triggered when there are material changes such as policy moves, large pricing resets, or sharp demand swings. Before delivery, an analyst performs a fresh pass on recent data so clients receive the latest updated view.
Mordor Intelligence's China Sensors Market Estimate Compared With Other Published Estimates
Published market values for sensors in China can look far apart because different authors choose different sensor boundaries, price points, and even the year and currency timing used for conversion. The spread is usually larger when unit growth is rapid, since small changes in ASP assumptions can swing the final value by billions.
In this market, the biggest gap drivers tend to be whether estimates blend components with fully integrated sensing systems, how they treat imports versus locally made sensors, and whether older shipment ratios are carried forward without re-checking. By refreshing ASP bands and FX timing around the latest annual cycle, and then re-validating the implied unit math against device builds, the estimate stays consistent, which is the refresh-led difference applied by Mordor Intelligence.
Benchmark comparison
| Source | Market Size | Gaps in Research Methodology |
|---|---|---|
| Mordor Intelligence | USD 7.01 B (2025) | |
| Industry Association A | USD 43.30 B (2022) | Uses an RMB total for a broad sensor industry view and does not clarify whether it reflects factory gate components only or also includes wider system value, which can inflate the market versus component revenue sizing. |
| Trade Journal B | USD 59.00 B (2024) | States a single China value with limited detail on scope, and the conversion and pricing basis is unclear, which can overstate value when high-volume sensors face fast ASP declines. |
The table mainly shows that scope and timing decisions, not arithmetic mistakes, explain the range across published numbers. When the market is tied back to a repeatable demand pool, with unit and price logic checked against observable production and trade signals, it becomes easier for us to explain what is counted and what is not.


Key Questions Answered in the Report
What is the current value of the China sensors market?
The market was valued at USD 7.45 billion in 2026 and is projected to reach USD 10.08 billion by 2031.
Which segment holds the largest China sensors market share by parameter measured?
Pressure sensors led with an 18.45% share in 2025.
How fast is LiDAR growing inside the China sensors market?
LiDAR revenue is forecast to expand at a 21.53% CAGR between 2026 and 2031.
Why are MEMS devices dominant in the China sensors market?
Mature 8-inch wafer lines, falling fabrication costs, and high consumer-electronics volumes kept MEMS at 60.85% of 2025 revenue.
Page last updated on:






