
Market Overview
| Study Period | 2020 - 2031 |
|---|---|
| Forecast Data Period | 2026 - 2031 |
| Base Year Market Size (2025) | USD 6.92 Billion |
| Market Size (2026) | USD 7.28 Billion |
| Market Size (2031) | USD 9.37 Billion |
| Growth Rate (2026 - 2031) | 5.17 % |
| Market Concentration | Medium |
Major Players *Disclaimer: Major Players sorted in no particular order Image © Mordor Intelligence. Reuse requires attribution under CC BY 4.0. | |
China POS Terminals Market Analysis by Mordor Intelligence
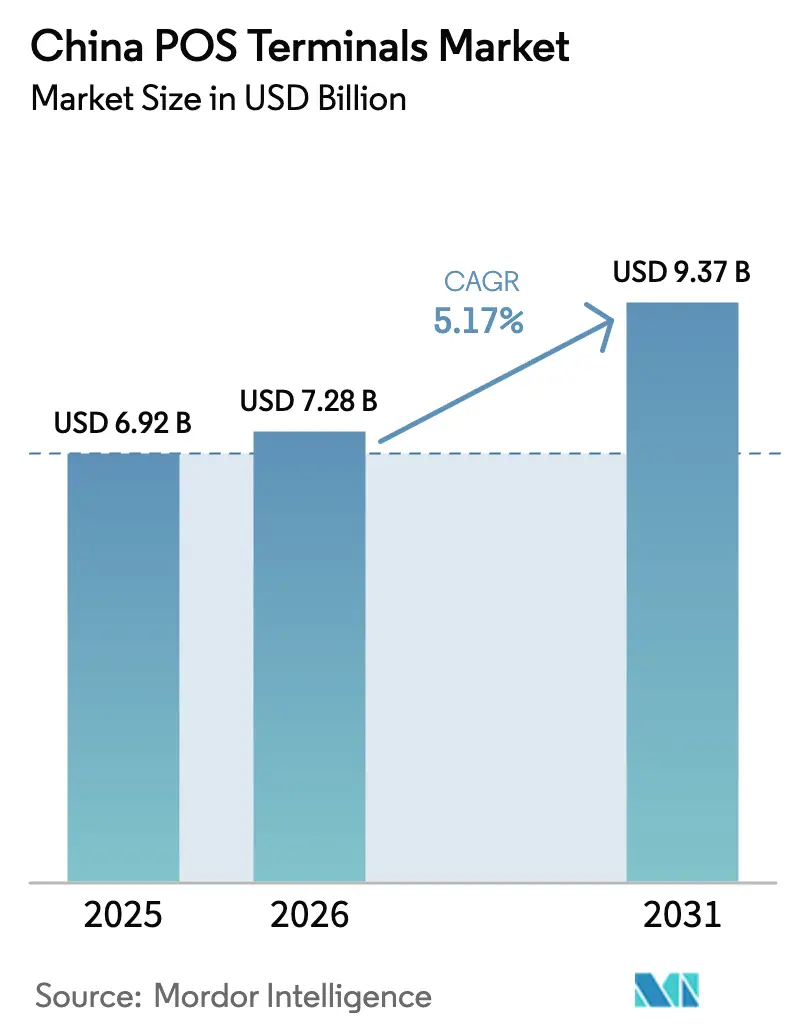
The China POS Terminals Market size was valued at USD 6.92 billion in 2025 and estimated to grow from USD 7.28 billion in 2026 to reach USD 9.37 billion by 2031, at a CAGR of 5.17% during the forecast period (2026-2031). The upward trajectory reflects Beijing’s cash-lite policy push, Digital-Yuan pilots, and compulsory EMV-L3 certification in transit systems. Contactless payment acceptance, wider smartphone penetration, and quick-response regulation from the People’s Bank of China are propelling demand for NFC-ready devices. Consolidation among payment enterprises, stricter data-localization laws, and rising AI-powered fraud detection adoption are reshaping vendor strategies. Meanwhile, SoftPOS growth, semiconductor supply-chain volatility, and heightened cybersecurity risks continue to pressure margins yet open new service niches for agile players.
Key Report Takeaways
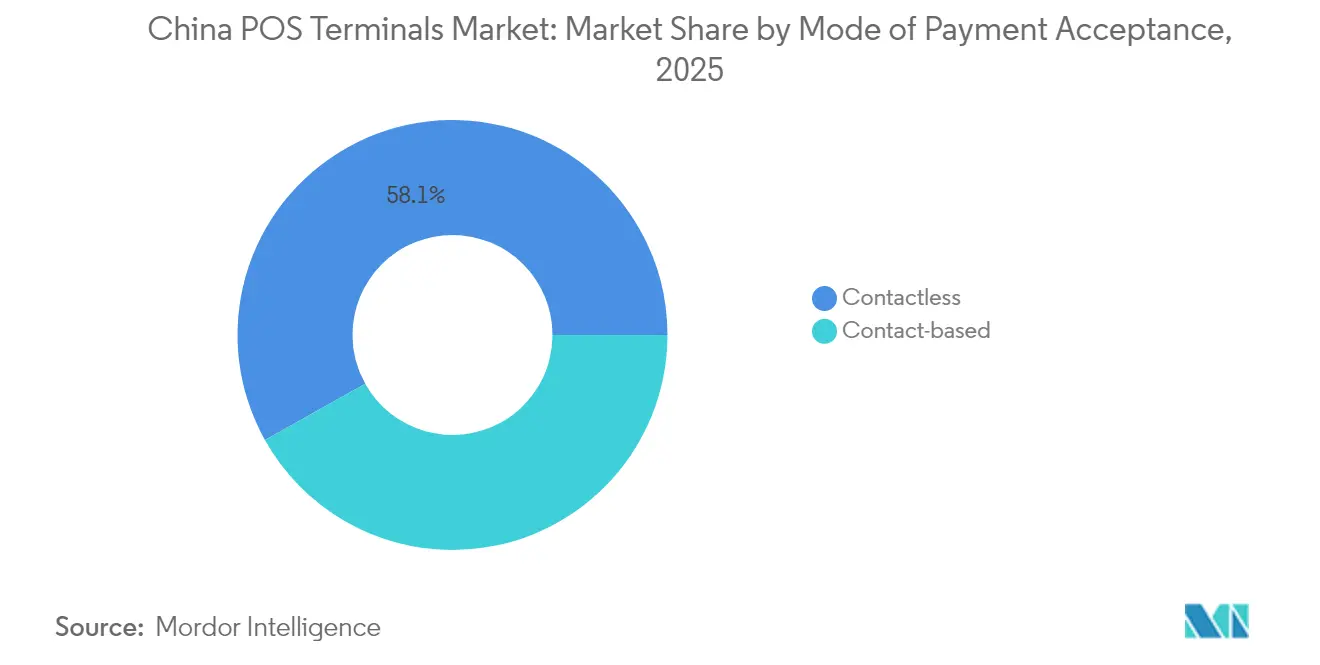
- By mode of payment, contactless solutions led with 58.12% of the China POS terminals market share in 2025 and are expanding at a 6.71% CAGR through 2031.
- By POS type, mobile and portable devices accounted for 63.10% of the China POS terminals market size in 2025 and will post a 6.79% CAGR during 2026-2031.
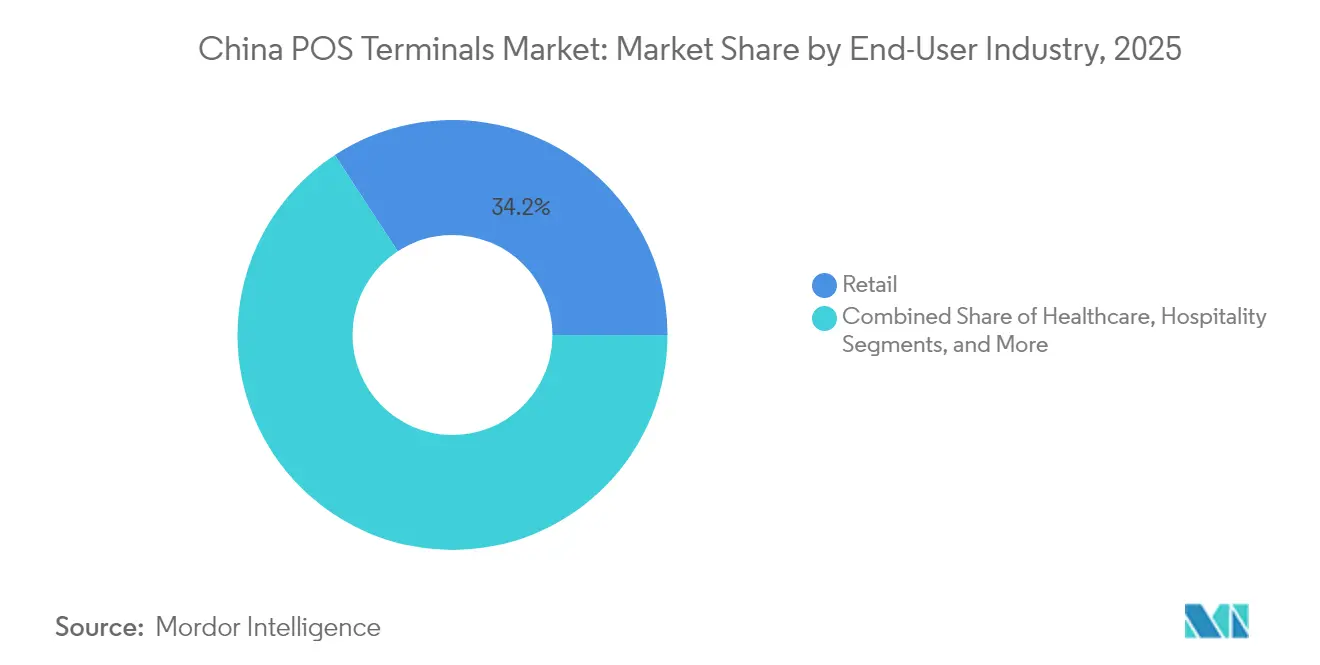
- By end-user, retail captured 34.22% revenue share in 2025 in the China POS terminals market, whereas healthcare registers the highest forecast CAGR at 6.12% through 2031.
Note: Market size and forecast figures in this report are generated using Mordor Intelligence’s proprietary estimation framework, updated with the latest available data and insights as of 2026.
China POS Terminals Market Trends and Insights
Drivers Impact Analysis*
| Driver | (~) % Impact on CAGR Forecast | Geographic Relevance | Impact Timeline |
|---|---|---|---|
| Government Push for Cashless Economy via Digital-Yuan Pilots | +1.2% | National, with early gains in major cities and pilot zones | Medium term (2-4 years) |
| Rapid Expansion of Mobile-Wallet-Ready NFC POS | +1.8% | National, accelerated in tier-1 and tier-2 cities | Short term (≤ 2 years) |
| Increasing Adoption by SMEs and QSRs | +1.1% | National, concentrated in urban commercial districts | Medium term (2-4 years) |
| Integration of AI-Powered Fraud-Detection Chips | +0.7% | National, priority in high-transaction venues | Long term (≥ 4 years) |
| Rise of Unattended Smart POS in Tier-3 Cities | +0.9% | Rural and tier-3 cities, expanding to county-level markets | Medium term (2-4 years) |
| Mandated EMV-L3 Certification for Transit POS | +0.6% | National transportation hubs, metro systems | Short term (≤ 2 years) |
| Source: Mordor Intelligence | |||
Government Push for Cashless Economy via Digital-Yuan Pilots
Expanded digital-currency pilots now allow foreign visitors to top up wallets with single-transaction limits of USD 5,000 and annual caps of USD 50,000, stimulating demand for dual-acceptance terminals capable of processing Digital Yuan and international card schemes. Tourist-facing venues must deploy multi-scheme hardware, while cryptography regulations enforce on-device encryption modules. Established vendors with deep regulatory expertise benefit from the resulting certification complexity.
Rapid Expansion of Mobile-Wallet-Ready NFC POS
Alipay’s “Tap-to-Pay” campaign and the rollout of 1.12 billion medical-insurance QR codes across 800,000 healthcare sites accelerate NFC terminal orders. QSR chains leverage biometric NFC devices, and Beijing Metro’s acceptance of foreign bank cards underscores the shift toward multi-wallet tap solutions. Terminal specifications now encompass social-insurance system links and biometric ID checks.
Increasing Adoption by SMEs and QSRs
State Council directives compel SMEs to accept multiple cash-lite methods, heightening POS demand in tier-3 cities. Merchant preferences lean toward all-in-one Android terminals bundling payment, CRM, and inventory functions. Yet SoftPOS platforms entice price-sensitive micro-merchants, challenging hardware margins.
Integration of AI-Powered Fraud-Detection Chips
UnionPay’s “Eagle Eye” and ICBC’s analytics programs illustrate rising AI deployment in POS risk control. Chip-level machine-learning cuts latency, aligns with China’s data-localization laws, and differentiates domestic suppliers like PAX Technology, whose HarmonyOS devices embed on-board AI.
Restraints Impact Analysis*
| Restraint | (~) % Impact on CAGR Forecast | Geographic Relevance | Impact Timeline |
|---|---|---|---|
| Rising Cyber-attacks Targeting POS Networks | -0.8% | National, concentrated in high-transaction urban areas | Short term (≤ 2 years) |
| Price Pressure from SoftPOS Smartphone Apps | -1.2% | National, accelerated in SME and micro-merchant segments | Medium term (2-4 years) |
| Semiconductor Supply-Chain Volatility | -0.6% | National, affecting all terminal manufacturers | Short term (≤ 2 years) |
| Data-Localization Compliance Cost Spike | -0.4% | National, regulatory compliance requirements | Long term (≥ 4 years) |
| Source: Mordor Intelligence | |||
Rising Cyber-attacks Targeting POS Networks
Sophisticated breaches now target firmware and cloud gateways, inflating compliance budgets under the Personal Information Protection Law. Smaller acquirers struggle with 24/7 monitoring and may exit the market if license revocation risks escalate.
Price Pressure from SoftPOS Smartphone Apps
Lakala’s PCI-MPoC-certified SoftPOS attracted 350,000 users, highlighting a shift toward low-capex smartphone acceptance. Hardware vendors confront margin erosion and must pivot to hybrid models or embedded software offerings to sustain competitiveness.
*Our forecasts treat driver/restraint impacts as directional, not additive. The impact forecasts reflect baseline growth, mix effects, and variable interactions.
Segment Analysis
By Mode of Payment Acceptance: Contactless Dominance Accelerates
Contactless systems captured 58.12% of the China POS terminals market share in 2025 and will grow at a 6.71% CAGR through 2031 as tap-and-go convenience aligns with hygiene preferences. The segment enjoys support from government rules lifting single-transaction caps for foreign visitors, spurring merchant upgrades to dual-scheme NFC terminals.
Biometric authentication layers, from facial recognition to fingerprint sensors, now accompany contactless flows, deepening solution complexity. Chip-and-PIN remains for high-value and cross-border transactions, preserving niche relevance. Beijing Metro’s multi-wallet acceptance proves that contactless devices can merge transport, retail, and international use cases under one chassis.

By POS Type: Mobile Solutions Drive Market Evolution
Mobile devices commanded 63.10% of the China POS terminals market size in 2025 and are set to clock a 6.79% CAGR through 2031, buoyed by SME mobility needs and unattended kiosk rollouts. Extended battery life, 5G modules, and cloud analytics elevate value propositions, while hybrid form factors blend printer docks with handhelds for QSR table-side service.
Fixed terminals persist in high-throughput venues demanding receipt printers, cash drawers, and multi-terminal synchronization. Yet transaction share concentration, up to 50% for the top five processors by March 2024, gives scaled acquirers bargaining leverage on hardware procurement. Vendors therefore pursue differentiated firmware, AI fraud modules, and service bundles to protect average selling prices.
By End-User Industry: Healthcare Emerges as Growth Engine
Retail remained the largest vertical with 34.22% revenue in 2025, benefitting from omnichannel payment consolidation mandates. However, healthcare leads growth at a 6.12% CAGR as 800,000 institutions integrate medical-insurance QR settlement, driving specialized Android terminals with insurance network APIs.
Hospitals require tight linkage to HIS platforms, co-payment splits, and PIPL-compliant patient data handling, setting entry barriers. Transportation, hospitality, and government services increasingly install certified terminals to meet foreign-visitor acceptance quotas, expanding addressable demand for multi-scheme hardware.
Geography Analysis
Tier-1 hubs, Beijing, Shanghai, Guangzhou, Shenzhen, anchor advanced deployments. Beijing’s Central Axis demonstration zone showcases foreigners’ tap-to-ride capability, while Shanghai outfitted 36,000 international-card-ready POS in commerce and tourism venues. These cities pilot AI risk controls, biometric layers, and Digital-Yuan cashier modes that cascade nationwide.
Tier-2 and tier-3 cities deliver the fastest shipment growth as rural modernization funds propel unattended smart POS across agriculture markets, bus depots, and government service halls. Vendors tailor ruggedized casings, solar power inputs, and simplified UIs to variable telecom conditions, capturing loyalty in price-sensitive clusters.
Cross-border gateways like the Greater Bay Area demand multi-currency settlement. UnionPay’s Project Excellence raised acceptance to 93.4% across 41 cities, recording 85.2% annual growth in foreign-card volumes by May 2024. Terminals must juggle UnionPay, Visa, Mastercard, JCB, and e-wallet QR codes while conforming to both PBOC and global scheme standards.
Regulatory Landscape
The People’s Bank of China (PBOC) is a primary regulator for payment terminal governance, with rules focused on tighter terminal onboarding, monitoring, and traceability. Under terminal life-cycle management requirements referenced in Yinfa No. 259, acquirers and related entities must maintain a mapped linkage of key identifiers (including terminal serial number and merchant unified social credit code) and perform real-time location monitoring for physical merchant terminals to validate geo-consistency with registered merchant addresses, which increases compliance and platform-integration requirements for POS deployments.
For technical specifications, barcode and mobile-payment acceptance terminals follow PBOC trial specifications and related industry standards such as T/BFIA 032-2024 (Mobile Payment - Acceptance Terminal Technical Requirements). The market also continues to align with international payment security and interoperability regimes used in procurement and certifications (for example, EMVCo and PCI requirements), which supports demand for terminals and software stacks that can complete multilayer testing while meeting China’s data-localization and security expectations.
Value Chain Analysis
The China POS terminal value chain starts with upstream electronic components, including processors, secure elements, memory, NFC modules, displays, printers, and communications modules. From there, ODM/OEM manufacturing and system integration feed into acquirer, wallet, and merchant ecosystems. Terminal OEMs such as PAX Global and Newland NPT increasingly bring industrial design, OS and payment-kernel development, device management, and security features in-house, then move through required certification pathways (for example, PCI PTS and EMVCo) to satisfy bank, scheme, and acquirer onboarding criteria.
Downstream, distributors and payment service providers or acquirers bundle terminals with acquiring, QR/NFC acceptance, merchant apps (inventory, CRM), and managed services such as remote device management, patching, and risk monitoring. Independent labs and conformity bodies (for example, SGS and Elitt, used in security and radio-related certification programs) act as gating steps for commercialization, while component-cost volatility, including memory-chip dynamics and broader semiconductor pricing, influences OEM sourcing strategy, product mix, and pricing discipline.
Competitive Landscape
Industry concentration intensified as POS transaction share of the top five processors climbed from 43% to 50% between June 2022 and March 2024, while licensed acquirers shrank to roughly 50 entities. PAX Technology posted USD 778 million revenue in 2024, scaling new Huizhou production to meet AI terminal demand.[3] Newland Global Technology secured Luxembourg, Hong Kong, and U.S. regulatory clearances, expanding export breadth.
Competition pivots on vertical integration, overseas diversification, and compliance mastery. SoftPOS disrupts entry-level hardware, exemplified by Lakala’s 350,000-user base, yet hardware vendors counter with hybrid soft-hardware stacks delivering on-device security chips. HarmonyOS adoption reduces reliance on foreign OS kernels and optimizes domestic protocol handling.
White-space niches include healthcare insurance settlement, cross-border tourism sectors, and county-level unattended kiosks. Companies offering turnkey cyber-secure, AI-enabled, multi-scheme terminals aligned with local regulations command premium contracts despite price aggression from smartphone-based entrants.
China POS Terminals Industry Leaders
-
Fujian Newland Payment Technology Co., Ltd.
-
Verifone Systems LLC
-
Ingenico Group SA
-
PAX Global Technology Limited
-
New POS Technology Limited
- *Disclaimer: Major Players sorted in no particular order

Market Opportunities and Future Outlook
Healthcare and public-service settlement remain the most defined white-space areas, since terminals need close integration with sector-specific platforms and compliance requirements. National-scale medical insurance digitization, reflected in deployments across large numbers of healthcare sites referenced in the market context, supports demand for Android smart POS and specialized service terminals that handle medical insurance workflows and related APIs. In these segments, vendors with established integrations, such as Newland offerings positioned for medical insurance service terminal use cases, have a clearer route to standardized rollouts where software certification and interoperability matter as much as the hardware.
Another opportunity set is forming around multi-scheme acceptance plus security modernization. Evidence of higher foreign-card usage and targeted acceptance programs in major cities, together with the PBOC’s tighter terminal life-cycle and location-monitoring requirements, supports demand for managed terminal fleets, secure on-device encryption, and AI-enabled fraud controls that reduce dependence on cloud processing under data-localization constraints. At the same time, SoftPOS adoption in the market context, including the user counts disclosed by Lakala, pressures entry-level hardware, creating space for hybrid approaches in which OEMs monetize device management, risk services, and value-added merchant applications rather than relying only on terminal ASPs.
Recent Industry Developments
- May 2026: Newland NPT announced LOA to go live with Fiserv as integrated partner in North America, following TSYS Sierra platform L3 certification. The collaboration broadens bundled POS solutions and SaaS services for banks and merchants, expanding market reach in North America.
- March 2026: PAX Global Technology published 2025 audited results noting semiconductor supply/demand shifts and memory-chip cost headwinds. Industry-wide cost pressures impacting POS hardware margins are evident, shaping pricing strategies and product mix for 2026-2031.
- January 2026: Verifone NRF 2026 announcement of Victa device portfolio expansion and new ecosystem partnerships. The expansion of hardware portfolio and partner ecosystem supports a broader, integrated platform strategy in China-ready and global markets.
Research Methodology Framework and Report Scope
Market Definition and Coverage
This market covers the revenues generated from POS terminal hardware sold and deployed in China for merchant payments acceptance in physical environments, including fixed countertop systems and mobile or portable terminals used across major merchant locations.
Scope exclusions: We exclude pure software-only acceptance on consumer smartphones, payment gateway services, and merchant acquiring fees that are not tied to POS terminal device revenues.
Segmentation Overview
- By Mode of Payment Acceptance
- Contact-based
- Contactless
- By POS Type
- Fixed Point-of-Sale Systems
- Mobile / Portable Point-of-Sale Systems
- By End-User Industry
- Retail
- Hospitality
- Healthcare
- Transportation and Logistics
- Other End-User Industries
Data Sources, Market Sizing, and Validation
Desk Research
Desk research was used to set the factual base for the model, especially on China payments regulation and acceptance infrastructure trends, and then to build a clean view of what counts as a terminal sale versus an adjacent service. Public sources were reviewed to understand merchant digitization, card and contactless usage direction, and the pace of retail and hospitality outlet additions.
The sources referenced included official and non-paywalled materials such as the People's Bank of China releases, the National Bureau of Statistics of China for retail and services indicators, China's Ministry of Industry and Information Technology for electronics and telecom context, and China Customs statistics for import and export signals where applicable, along with academic papers and patents that clarify technology shifts like NFC and EMV. We also used company filings, investor presentations, reputable press, and industry association websites for product positioning, distribution approaches, and pricing signals. In addition, approved paid subscriptions for company financials and intelligence, news and financials, and patent databases were used selectively to cross-check timelines and normalize fragmented disclosures. These desk sources are not exhaustive, and other references were used during data collection, validation, and clarification steps.
Primary Interviews and Surveys
Primary work was used to convert the desk inputs into workable sizing assumptions, especially where public data does not clearly separate POS device revenues from bundled installation, warranty, or adjacent merchant services. We spoke with ecosystem participants such as device channel partners, payment acceptance solution providers, large merchants, and technical specialists who track certification and rollout patterns, and then rechecked the assumptions across the main demand pockets in China.
Distribution of primary research fieldwork respondents
| Company type | Respondent position |
|---|---|
| Top tier: 35% | CXOs: 16% |
| Mid tier: 43% | Functional/Unit leaders: 26% |
| Smaller Players: 22% | Managers: 58% |
Market-Sizing & Forecasting
Market sizing was built using a top-down and bottom-up logic, where demand is first reconstructed from the merchant acceptance base in China and the expected refresh and replacement cycle of deployed terminals, and then it is cross-checked through supplier and channel signals. In practice, we start by estimating the installed base, new merchant additions, and replacement needs, followed by applying adoption and mix assumptions for fixed versus mobile units and contact-based versus contactless acceptance.
The model uses market fingerprints that are practical to validate, such as the pace of new store openings and retail sales activity, contactless and card acceptance push in key urban clusters, public certification and compliance direction that influences terminal upgrades, and typical device ASP ranges seen by channel partners. We also consider electronics supply conditions that can impact unit availability and near-term pricing. Forecasts are created using scenario analysis supported by expert inputs, so the base case reflects what respondents expect for merchant capex, rollout plans, and technology migration (for example, shifts toward NFC-ready devices). Where bottom-up inputs have gaps, sampled ASP timing is used to expand unit estimates carefully using observable channel coverage factors, and totals are adjusted only after they align with independent demand signals.
Data Validation & Update Cycle
Validation is done through repeated cross-checks between the model output and independent indicators, followed by analyst review of any spikes that do not match the operating reality described by respondents. If a variance is found, the assumptions are revisited in steps, starting with unit volumes, then device mix, and finally ASP progression and currency timing so the reason for movement is clear.
Before sign-off, the numbers are reviewed by another analyst to check calculation logic and consistency across years, and re-contact is triggered when a key assumption shifts materially or when new policy or rollout news affects adoption. Reports are refreshed annually, and interim updates are made when material events occur that can change terminal shipment direction or pricing. Before delivery, a final pass is completed so clients receive the latest updated view rather than an older snapshot.
Mordor Intelligence's China Pos Terminal Market Sizing Compared With Other Published Estimates
Published market values for China POS terminals can look far apart because each publisher sets its own scope for what is counted, and then uses different unit, pricing, and replacement assumptions to build the total. The timing of currency conversion and the year of the base data also affect the number, particularly when device mix shifts quickly toward newer contactless-ready models.
Some external estimates are broader and fold in payment acceptance software, merchant acquiring, or services attached to deployments, and they may also assume faster nationwide refresh cycles across merchant types. In Mordor Intelligence, the market count is limited to POS terminal device revenues in China, and adjacent fees and pure software-only acceptance are kept outside the total so the sizing stays tied to measurable shipment and pricing signals.
Benchmark comparison
| Source | Market Size | Gaps in Research Methodology |
|---|---|---|
| Mordor Intelligence | USD 6.92 B (2025) | |
| Global Consultancy A | USD 8.10 B (2025) | Uses a wider payments acceptance scope that can include deployment services and software bundles, and applies a higher assumed upgrade rate for contactless adoption, which lifts the total. |
| Industry Association B | USD 5.70 B (2025) | Leans on a narrower device definition that undercounts mobile and portable terminals in smaller cities, and it also applies conservative ASP assumptions without rechecking channel pricing shifts. |
The comparison indicates that the spread is driven mainly by what gets included beyond the device, and by how replacement volumes and ASP changes are modeled. By keeping the inputs tied to installed base, refresh needs, and observable price bands that can be rechecked with interviews, the final number becomes easier to trace and repeat across update cycles.
Key Questions Answered in the Report
What is the forecast value of the China POS terminals market by 2031?
The market is projected to reach 9.37 billion USD by 2031.
Which payment mode is growing fastest in China’s POS ecosystem?
Contactless transactions, driven by NFC and biometric enhancements, are advancing at a 6.71% CAGR through 2031.
Why is healthcare a key opportunity for POS vendors in China?
Over 800,000 medical institutions now integrate insurance QR codes, pushing healthcare POS demand to a 6.12% CAGR.
How are SoftPOS apps affecting traditional POS hardware sales?
Smartphone-based acceptance solutions cut deployment costs, drawing 350,000 merchants and pressuring hardware margins.
What regulations most influence POS terminal design in China?
Digital-Yuan pilot rules, EMV-L3 transit standards, and strict data-localization laws shape hardware and software specifications.