
China Optoelectronics Market Size and Share
Market Overview
| Study Period | 2020 - 2031 |
|---|---|
| Forecast Data Period | 2026 - 2031 |
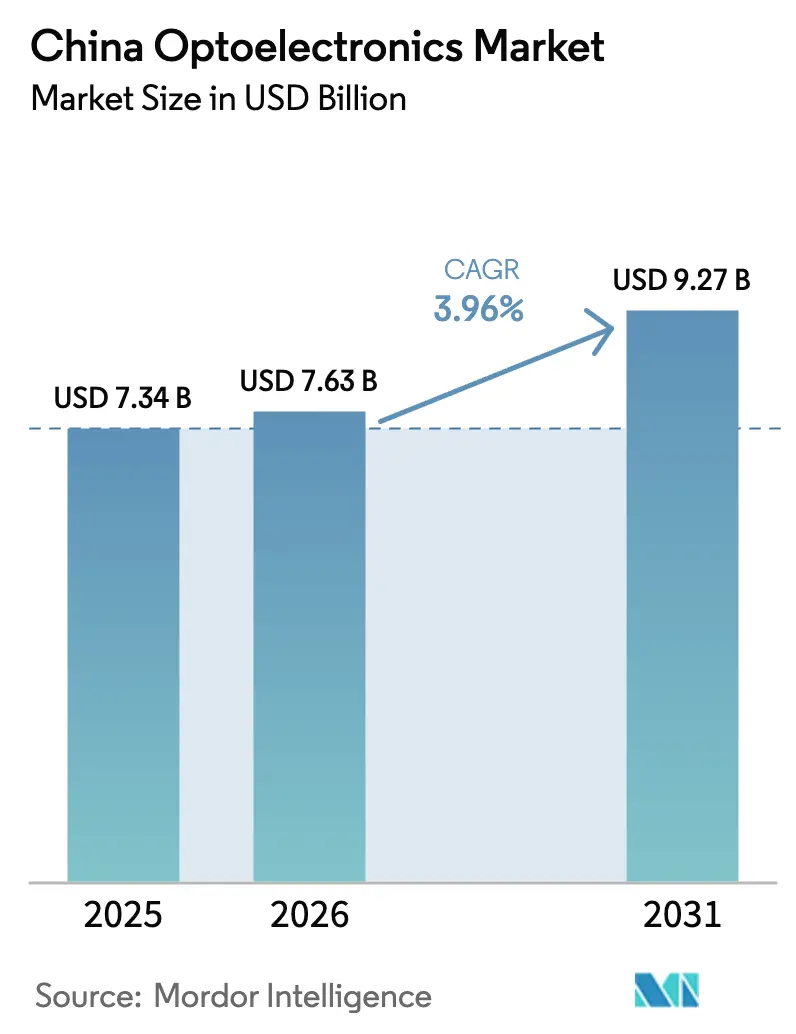
| Base Year Market Size (2025) | USD 7.34 Billion |
| Market Size (2026) | USD 7.63 Billion |
| Market Size (2031) | USD 9.27 Billion |
| Growth Rate (2026 - 2031) | 3.96 % |
| Market Concentration | Medium |
Major Players *Disclaimer: Major Players sorted in no particular order Image © Mordor Intelligence. Reuse requires attribution under CC BY 4.0. | |
China Optoelectronics Market Analysis by Mordor Intelligence
The China optoelectronics market size is expected to grow from USD 7.34 billion in 2025 to USD 7.63 billion in 2026 and is forecast to reach USD 9.27 billion by 2031 at 3.96% CAGR over 2026-2031. The measured growth pace signals a maturing competitive landscape as state-backed initiatives shift capital from volume-driven LED lighting toward compound semiconductors, laser diodes, and advanced packaging. Policy-mandated localization requirements, combined with a widening 5G and data-center build-out, continue to redirect demand from commodity illumination to higher-margin optical communication and sensing solutions. Upstream, gallium nitride and silicon carbide wafer capabilities gain priority funding, while downstream players pursue vertical integration to mitigate U.S. export-control risks. Consolidation accelerates among domestic champions that leverage government incentives, but capital intensity and talent shortages keep entry barriers high for smaller firms.
Key Report Takeaways
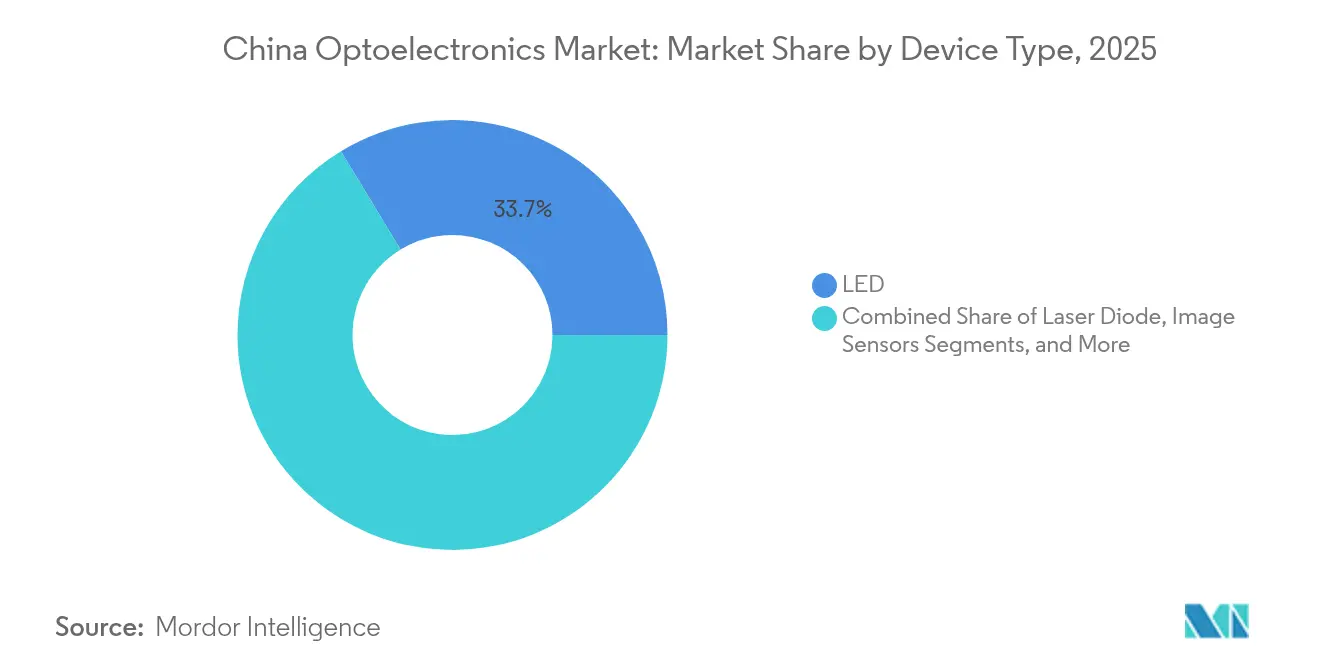
- By device type, LED components led with a 33.68% revenue share in 2025, whereas laser diodes are forecast to post the fastest growth at a 4.86% CAGR to 2031.
- By material, gallium nitride dominated with a 41.75% China optoelectronics market share in 2025, while silicon carbide is on course for a 4.45% CAGR through 2031.
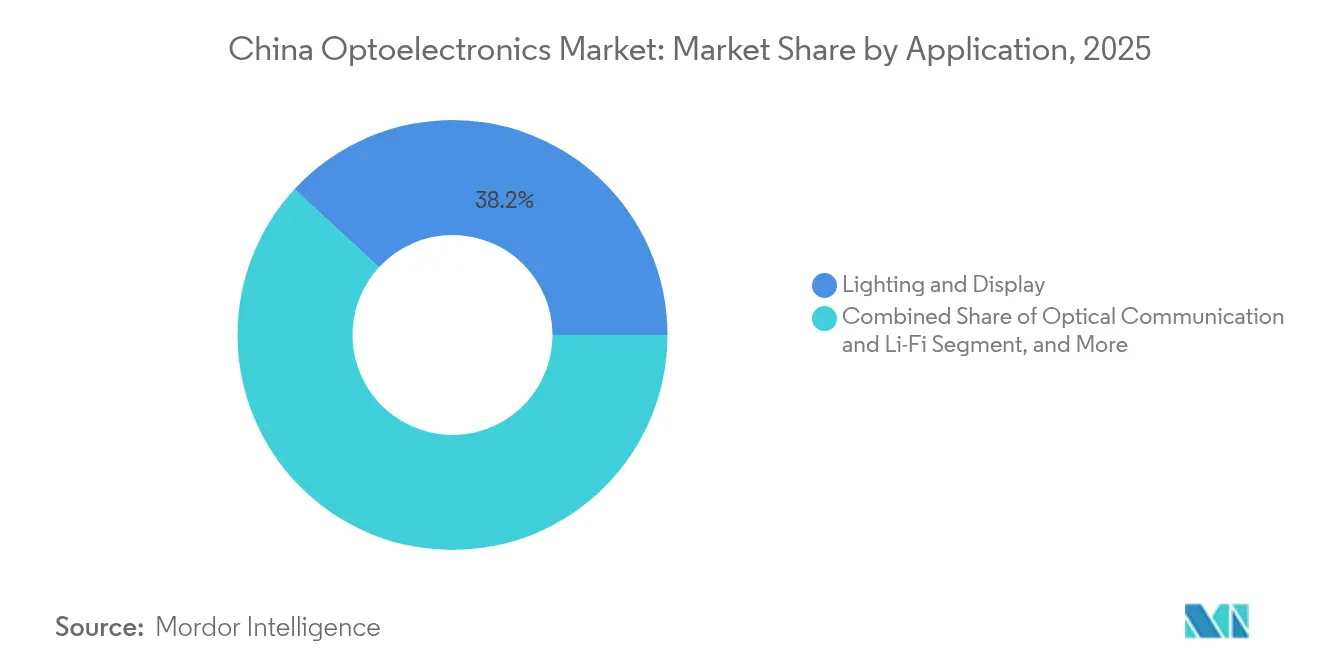
- By application, lighting and displays retained a 38.15% share in 2025; however, optical communication and Li-Fi are projected to expand at a 5.14% CAGR through 2031.
- By end user, consumer electronics accounted for 42.64% of the China optoelectronics market size in 2025, whereas automotive applications carried the strongest 5.72% CAGR outlook.
Note: Market size and forecast figures in this report are generated using Mordor Intelligence’s proprietary estimation framework, updated with the latest available data and insights as of 2026.
China Optoelectronics Market Trends and Insights
Drivers Impact Analysis*
| Driver | (~) % Impact on CAGR Forecast | Geographic Relevance | Impact Timeline |
|---|---|---|---|
| Government push for domestic semiconductor supply chains | +0.8% | National, centered in Beijing, Shanghai, Shenzhen | Medium term (2-4 years) |
| Rapid LED mini- and micro-LED commercialization | +1.2% | Guangdong and Jiangsu | Short term (≤ 2 years) |
| 5G- and data-center-driven optical-transceiver demand | +0.9% | Tier-1 cities and industrial clusters | Medium term (2-4 years) |
| Electric-vehicle LiDAR integration | +0.7% | Early adoption in Beijing, Shanghai, Shenzhen | Long term (≥ 4 years) |
| Carbon-neutral policies accelerating photovoltaic adoption | +0.6% | Western provinces | Long term (≥ 4 years) |
| Emerging quantum-dot image-sensor start-ups | +0.3% | Beijing, Shanghai, Shenzhen | Long term (≥ 4 years) |
| Source: Mordor Intelligence | |||
Government Push for Domestic Semiconductor Supply Chains
The third phase of the National Integrated Circuit Industry Investment Fund injected more than USD 40 billion in 2024, with a clear mandate to scale compound-semiconductor capacity critical for optoelectronic devices. Subsidized fab projects lower effective capital costs, lock in bank financing, and guarantee procurement channels through local-content rules. Collectively, these measures tilt purchasing toward domestic LED, laser diode, and sensor vendors, creating a baseline floor for the China optoelectronics market even during cyclical slowdowns. The policy also shortens technology-learning curves by financing joint pilot lines with university partners. Over the medium term, the localization agenda should close process-technology gaps in metal-organic chemical vapor deposition and ion implantation.
Rapid LED Mini and Micro-LED Commercialization
BOE Technology transitioned from pilot to volume mini-LED backlighting for premium smartphones and tablets in 2024, validating mass-transfer processes that reduce die-bonding cycle times by 35%.[1] Unit-cost compression widens the addressable tier-two handset and TV segments, accelerating revenue capture for domestic substrate, driver-IC, and packaging firms. Color gamut and lifetime advantages over OLED win OEM design slots, while trade policy dynamics render overseas supply less competitive on landed cost. Rapid-qualifier programs at Shenzhen-based contract assemblers enable six-month design-win cycles, compared with nine months or more for foreign rivals. As a result, the China optoelectronics market benefits from higher average selling prices and lower churn risk versus commoditized LED lighting.
5G- and Data-Center-Driven Optical Transceiver Demand
China surpassed 3.6 million installed 5G macro sites by end-2024, each requiring multiple 25G-plus optical modules for fronthaul and backhaul links. Hyperscale cloud providers simultaneously ramp 400G and 800G optics to feed AI training clusters. Local transceiver makers, supported by procurement preferences, translate proximity into faster design iterations and reduced field-failure rates. Supply-chain localization also mitigates geopolitical risk for cloud operators hosting critical workloads. Demand visibility extends into the medium term as deployment roadmaps move toward 6G testbeds, reinforcing a multi-year revenue stream for optical-component vendors within the China optoelectronics market.
Electric Vehicle LiDAR Integration
BYD, NIO, and other domestic OEMs introduced solid-state LiDAR on mid-tier models in 2024, advancing the sensor from luxury niche to mass option packages. Cost decline stems from in-house laser diode and photodetector fabrication, coupled with ASIC-level signal-processing integration. Transition toward 1550 nm architectures raises demand for indium phosphide wafers, catalyzing new epitaxy investments. Over the long term, wider LiDAR adoption is expected to double automotive laser-diode unit volumes, diversifying revenue away from saturated handset 3D-sensing applications and driving incremental growth for the China optoelectronics market.
Restraints Impact Analysis*
| Restraint | (~) % Impact on CAGR Forecast | Geographic Relevance | Impact Timeline |
|---|---|---|---|
| US-China tech export controls | -0.9% | Advanced fabs nationwide | Short term (≤ 2 years) |
| Talent shortage in compound-semiconductor processing | -0.4% | Beijing, Shanghai, Shenzhen, Wuhan | Medium term (2-4 years) |
| High CAPEX for 8-inch GaN and SiC fabrication | -0.5% | Leading semiconductor hubs | Medium term (2-4 years) |
| Price erosion in LED backlighting | -0.3% | Guangdong and Jiangsu | Short term (≤ 2 years) |
| Source: Mordor Intelligence | |||
US-China Tech Export Controls
The October 2024 revision of U.S. regulations curtailed shipments of advanced gallium-nitride and silicon-carbide equipment, lengthening tool-procurement lead times to more than 18 months. Domestic fabs either run older-node reactors or accelerate in-house tool designs, both scenarios depressing initial yields and raising cost per wafer. Multinational suppliers postpone local service-center expansion, further delaying ramp schedules. Consequently, near-term wafer output lags demand from EV and 5G segments, trimming the China optoelectronics market CAGR during the first two forecast years.
High CAPEX for 8-inch GaN and SiC Fabrication
A single 8-inch GaN line surpasses USD 500 million in base investment, while SiC fabs can breach USD 700 million after substrate prep and high-temperature furnaces. Financing such outlays stresses even well-capitalized firms when coupled with protracted payback cycles. Smaller entrants default to 6-inch retrofits, which suffer from inferior die economies, leaving the supply-base highly concentrated. Without fresh equity or state subsidies, wafer shortages could persist, limiting downstream module scale and tempering the China optoelectronics market growth curve.
*Our forecasts treat driver/restraint impacts as directional, not additive. The impact forecasts reflect baseline growth, mix effects, and variable interactions.
Segment Analysis
By Device Type: Laser Diodes Drive Premium Applications
Laser diodes are expected to contribute a 4.86% CAGR through 2031, outperforming the broader China optoelectronics market despite LEDs retaining a 33.68% revenue lead in 2025. Rising LiDAR attach rates and data-center optics create resilient demand buffers that cushion cyclical swings in handset VCSEL volumes. The price elasticity of LEDs erodes margins, prompting vendors to migrate capacity to coherent-light products where ASPs exceed USD 20 per unit. Industrial laser arrays for metal cutting and additive manufacturing further widen addressable revenue pools, while optocouplers maintain utility in power-conversion isolation despite slower growth.
In parallel, photovoltaic cells wrestle with overcapacity-led price compression yet still benefit from grid-parity projects under carbon-neutral mandates. Image-sensor volumes climb on dual- and triple-camera smartphone designs, but value capture shifts toward stacked-pixel architectures that embed logic under photodiodes. Collectively, these shifts raise the blended ASP across device categories, helping the China optoelectronics market offset slower unit expansion.

By Device Material: Silicon Carbide Gains Traction
Silicon carbide posted the fastest 4.45% CAGR, nibbling at gallium nitride’s 41.75% revenue dominance in 2025. EV traction inverters and 5G base-station PA modules value SiC’s superior thermal conductivity, enabling higher power density and reduced cooling overhead. Tianjin Zhonghuan’s 200 mm SiC substrate breakthrough cut defect density by 40%, narrowing the cost delta with GaN and supporting wider adoption. GaN retains an edge in fast-switching chargers and RF front-ends, while indium phosphide rises for 1550 nm automotive LiDAR lasers. The shift toward compound semiconductors magnifies equipment-qualification hurdles but unlocks premium pricing that smooths gross-margin volatility across the China optoelectronics market.
Traditional silicon and gallium arsenide remain relevant in mid-power LED lamps and handset P-As but face secular share drift to higher-performance alternatives. Process-yield improvements and localized substrate supply are strategic for sustaining competitive cost structures as the China optoelectronics industry advances.
By Application: Optical Communication Accelerates
Optical communication and Li-Fi registered a 5.14% CAGR, eclipsing lighting’s 38.15% share benchmark in 2025. AI server clusters demand 800G links at rack-scale, driving multi-mode VCSEL and single-mode EML proliferation. Telecom operators fast-track fiber-deep 5G backhaul, deploying coherent transceivers that rely on narrow-line-width lasers and modulators. The convergence of datacom and telecom architectures amplifies unit demand and intensifies design-win competition within the China optoelectronics market.
Sensing and imaging expand through factory automation and autonomous mobility, but price erosion in LED backlight panels compresses legacy revenues. Defense and security verticals remain protected niches, insulated from pricing cycles by stringent qualification protocols yet capped by export-license controls that limit volume scale.
By End-User Industry: Automotive Transformation Accelerates
Automotive applications are set to deliver the highest 5.72% CAGR, challenging consumer electronics’ 42.64% 2025 share lead. Battery-electric platforms incorporate matrix LED headlights, ambient-lighting strips, and multi-sensor ADAS suites, each embedding photonics content multiple times that of internal-combustion predecessors. Domestic Tier-1 suppliers partner directly with LED and laser fabs to co-develop automotive-grade packages, locking in multi-year volume contracts. As government subsidy tapering shifts value perception to safety and connectivity, optoelectronic-content growth cushions any EV sales plateau, reinforcing the China optoelectronics market trajectory.
Telecom and cloud data-center operators sustain double-digit demand for high-speed optics, while healthcare upgrades to high-resolution endoscopes and diagnostic scanners. Industrial automation adds machine-vision nodes, and aerospace implements fiber-optic gyros, contributing incremental diversity to the China optoelectronics industry revenue mix.
Geography Analysis
Regional clusters drove roughly 74.68% of China optoelectronics market value in 2025, with the Yangtze River Delta leading due to Shanghai’s R&D and Jiangsu’s packaging scale. Vertical-integration models flourish here; BOE Technology and Sanan Optoelectronics co-locate substrate, epi, and module lines to streamline logistics and tap a deep engineering talent base. The Pearl River Delta follows, with Shenzhen anchoring consumer electronics-oriented supply chains and benefiting from Hong Kong’s trade and finance ecosystem.
Beijing’s Zhongguancun Science Park houses quantum-dot and silicon-photonic start-ups that spin out of Tsinghua and Peking Universities, leveraging proximity to venture funding and state labs. Wuhan’s “Optics Valley” specializes in laser-tech clusters, capitalizing on Huazhong University’s photonics faculty and attracting more than 300 enterprises by 2024. These inland hubs diversify geographic risk and alleviate coastal wage inflation, aligning with central government regional development mandates. Second-tier cities such as Xi’an, Chengdu, and Hefei offer tax holidays and lower land rates that entice capacity-expansion projects, including BOE’s 2025 micro-LED fab announcement in Hefei. The dispersion strategy aims to foster complementary skill pools and ensure redundancy against localized supply-chain shocks, collectively sustaining the nationwide China optoelectronics market growth engine.
Regulatory Landscape
China's optoelectronics sector is guided mainly by the Ministry of Industry and Information Technology (MIIT) and the National Development and Reform Commission (NDRC), with industrial priorities reflected in national planning and industrial catalogues. The Catalog for Guiding Industry Restructuring (2024 version), effective February 2024, includes optoelectronic device manufacturing and optical transmission systems (100Gb/s and above) as encouraged categories, which supports permitting and investment alignment toward higher-speed optical links and advanced device production.
On the demand side, MIIT's January 2025 Notice on launching pilot work for 10-gigabit optical networks promotes 50G-PON and optical-AI integration, reinforcing telecom and datacom pull for lasers, photonics integration, and optical modules. Cross-border regulatory scrutiny also affects corporate strategy. On April 17, 2026, Sanan Optoelectronics terminated its planned acquisition of Lumileds Holding B.V. after a negative ruling by the U.S. Committee on Foreign Investment in the United States (CFIUS), highlighting how external reviews can shape M&A and technology access decisions.
Value Chain Analysis
The China optoelectronics value chain covers upstream compound-semiconductor materials and equipment (GaN, SiC, InP substrates and epitaxy), midstream device fabrication and packaging (LEDs, laser diodes, image sensors, optical components, and module assembly), and downstream deployment across consumer electronics, telecom and data centers, automotive, industrial automation, and emerging sensing applications. Policy-backed localization, including the 2024 emphasis on encouraged optoelectronic manufacturing in the industrial restructuring catalog, reinforces domestic sourcing across substrates, epitaxy, and packaging. Export-control frictions also contribute by elevating tool lead times and increasing the premium for locally qualified equipment and process know-how.
Midstream and downstream players increasingly combine display and sensing capabilities with module integration to shorten design cycles and stabilize supply. Regional cluster ecosystems in East China and Wuhan support co-location of R&D, packaging, and end-application integration. Large integrators such as BOE Technology Group continue to fund display manufacturing and adjacent sensing domains (including medical imaging and bio-detection) through 2025 into 2026, reflecting a shift from pure capacity additions toward quality improvements, standard-setting, and consolidation across existing facilities to improve yields and reliability for higher-margin optical communication and automotive-grade products.
Competitive Landscape
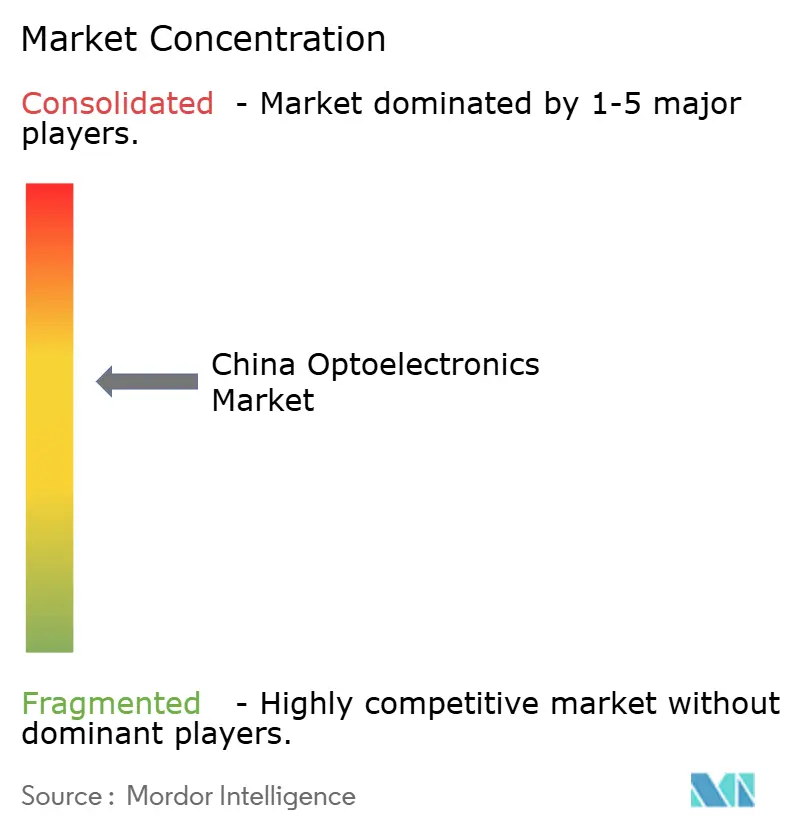
Top-10 suppliers controlled roughly 45% of 2024 revenue, signaling moderate concentration within the China optoelectronics market. Market leaders adopt end-to-end integration, spanning substrate fabrication to final module assembly, to secure scale benefits and lower bill-of-materials volatility. BOE Technology’s acquisition of U.S. micro-LED innovator Rohinni granted it proprietary mass-transfer IP, fast-tracking next-gen display roadmaps. Sanan Optoelectronics expanded its playbook by acquiring a German compound-semiconductor equipment manufacturer in 2025 to mitigate export-control exposure.
Patent-application volumes in compound-semiconductor processing climbed 35% year-on-year in 2024, underscoring a race for defensible technology positions. Emerging challengers specialize in high-value niches such as quantum-dot sensors and SiC MOSFETs, leveraging agility to out-innovate incumbents in narrow domains. Strategic alliances with foreign automotive Tier-1 Suppliers, highlighted by HC Semitek’s 2024 partnership with Continental and its 2025 supply deal with Tesla, validate its quality credentials and open export pathways.
Financing dynamics favor firms able to secure central-government seed funds or local-government land grants, yet continued CAPEX escalation may accelerate future mergers as smaller players seek economies of scale. The net effect sustains a mid-level concentration that balances innovation diversity with adequate scale economies, keeping the China optoelectronics industry competitively vigorous.
China Optoelectronics Industry Leaders
-
BOE Technology Group Co., Ltd.
-
Shenzhen China Star Optoelectronics Technology Co., Ltd.
-
Sanan Optoelectronics Co., Ltd.
-
HC Semitek Corporation
-
Leyard Optoelectronic Co., Ltd.
- *Disclaimer: Major Players sorted in no particular order
Market Opportunities and Future Outlook
A near-term opportunity sits where national industrial priorities intersect with network upgrades. MIIT's January 2025 10-gigabit optical-network pilots (50G-PON and optical-AI integration) provide an implementation pathway for higher-speed optical access and transport, which increases requirements for lasers, modulators, and optical-module supply chains located in China. The 15th Five-Year Plan framework commencing in 2026 also emphasizes manufacturing stabilization and AI-plus-industry integration, creating whitespace for vendors that can translate photonics into deployable AI-data-center and industrial connectivity solutions, including co-packaged optics and optical interconnect approaches that address power and bandwidth bottlenecks.
On the supply-and-trade side, the Encouraging Catalog (2025 version), effective February 1, 2026, classifies optoelectronic devices and optical communication equipment as encouraged industries, supporting new project formation and partnerships where permitted. Export tax rebate adjustments as of June 2026, including an increase from 13% to 16% for high-value-added intelligent lighting modules, improve economics for specialized, higher value products versus commodity LED backlighting, supporting a pathway to move up the mix. Company actions also point to where investment is concentrating. BOE's continued IoT-oriented transformation and ongoing investment posture through 2025-2026 suggest sustained capital allocation toward higher-end display and related optoelectronic capabilities, not purely volume-oriented legacy segments.
Recent Industry Developments
- July 2026: BOE Technology Group formed dedicated project teams focused on Micro LED optical interconnects and glass-core-substrate co-packaged optics (CPO) technologies. The initiative points to stronger R&D and engineering emphasis on high-bandwidth optical integration, linked to advanced displays and AI-era interconnect requirements. It also tightens alignment between display manufacturing and photonics capabilities.
- April 2026: Sanan Optoelectronics announced the termination of its planned acquisition of Lumileds Holding B.V. after it failed to secure required regulatory approvals, including a negative CFIUS outcome cited in the decision. Ending the transaction highlighted practical constraints on cross-border technology access and reinforced a need to prioritize domestic capability building and alternative partnerships.
- October 2025: BOE Technology committed USD 2.1 billion to build a mass-production micro-LED fab in Hefei, targeting smartphone and automotive displays. The investment supports scale-up of next-generation display devices and strengthens downstream pull for upstream materials, mass-transfer processes, and advanced packaging within China.
Research Methodology Framework and Report Scope
Market Definition and Coverage
For this methodology, the China optoelectronics market covers optoelectronic components and devices produced and sold for use in China, where electrical signals are converted to light, or light is converted to electrical signals.
Scope exclusions: We do not count downstream finished systems and services (for example, full lighting fixtures, assembled display end-products, or installation and maintenance services) unless the device value is separately identified.
Segmentation Overview
- By Device Type
- LED
- Laser Diode
- Image Sensors
- Optocouplers
- Photovoltaic Cells
- Other Device Types
- By Device Material
- Gallium Nitride (GaN)
- Gallium Arsenide (GaAs)
- Silicon Carbide (SiC)
- Indium Phosphide (InP)
- Silicon and Other Device Materials
- By Application
- Lighting and Display
- Optical Communication and Li-Fi
- Sensing and Imaging
- Power Conversion and Photovoltaics
- Other Applications
- By End-user Industry
- Consumer Electronics
- Automotive
- Information Technology and Telecom
- Healthcare and Life-Sciences
- Aerospace and Defense
- Industrial Automation
- Other End-user Industries
Data Sources, Market Sizing, and Validation
Desk Research
Desk research starts with building a clean demand and supply picture for China across major optoelectronic device families, and then aligning it with reported industry performance. We mainly refer to public sources such as the National Bureau of Statistics of China for industrial output indicators, China Customs trade statistics for import and export signals, and the Ministry of Industry and Information Technology for policy direction and production trends.
To anchor technology and use-case shifts, we also review sources such as IEEE and other peer reviewed journals for device adoption and efficiency progress, patent databases for activity by material and device type, and association or conference publications such as those from photonics and LED industry bodies. Company annual reports, investor presentations, and earnings releases are used to cross-check revenue mix and pricing direction. Where public disclosures are thin, we use paid subscriptions for company financials and shipment-level trade intelligence selectively. These desk research sources are illustrative and not exhaustive, since many other references are used for data collection, cross-checks, and clarification.
Primary Interviews and Surveys
Primary work is done through expert interviews and structured surveys with device makers, component suppliers, channel participants, and large end users across consumer electronics, automotive, telecom, and industrial demand. The respondent input is used to confirm what is actually being shipped, how average selling prices are moving by device class, and where inventory corrections or policy changes are affecting near-term demand in different parts of China.
Distribution of primary research fieldwork respondents
| Company type | Respondent position |
|---|---|
| Top tier: 30% | CXOs: 15% |
| Mid tier: 49% | Functional/Unit leaders: 37% |
| Smaller Players: 21% | Managers: 48% |
Market-Sizing & Forecasting
Our sizing starts with a top-down build that reconstructs China demand using a device-led demand pool, where production and trade signals are linked to application uptake in lighting, displays, optical communication, and sensing. We corroborate this with selective bottom-up approximations, including supplier roll-ups for key device categories and sampled ASP times volume checks by end use. These checks are used to fine-tune totals when a category looks overstated.
Inputs are chosen to match how optoelectronics is bought and priced in practice. We track indicators such as unit shipment trends for LEDs, laser diodes, and image sensors, mix shifts toward higher value devices, utilization and capacity additions where they show up in public disclosures, import and export movements for relevant components, and ASP progression by device type when price pressure is evident. Where a bottom-up view cannot be completed due to limited disclosure, the gap is handled through conservative penetration assumptions that are tested again in interviews.
Forecasting is done using scenario analysis, supported by simple time series smoothing on the variables that show stable seasonality. It is then adjusted using expert consensus on near term pricing and adoption. This keeps the forecast explainable while still reflecting changes in policy, substitution between device materials, and cycles in consumer electronics and telecom spending.
Data Validation & Update Cycle
Validation is handled through multiple checks so the final totals do not rely on a single data stream. Analysts compare model outputs against independent signals such as trade values, reported revenue mixes, and device shipment direction, and then large variances are reworked until the drivers are clear.
Before sign-off, assumptions are reviewed in steps, first at the device level and then at the application level. This is followed by a final review of currency conversion timing and price trends. Reports are refreshed annually, and interim updates are made when there are material events like major policy changes, supply disruptions, or sharp price corrections. Right before delivery, a fresh validation pass is completed so clients receive the latest updated view.
Mordor Intelligence's China Optoelectronics Market Sizing Compared With Other Published Estimates
Published market sizes for China optoelectronics often do not match because each publisher sets its own boundary for what counts as optoelectronics revenue, and then updates pricing and currency assumptions on a different schedule. Differences also show up when one estimate leans on production value only, while another uses demand-side consumption with trade adjustments.
The refresh cadence and the month used for USD conversion can move results in a market where ASPs for mature devices trend down, even when volumes rise. The table below shows the spread. By re-validating device level ASP steps and rechecking the implied revenue per shipped unit during each update cycle, the estimate stays tied to current conditions, a discipline applied by Mordor Intelligence.
Benchmark comparison
| Source | Market Size | Gaps in Research Methodology |
|---|---|---|
| Mordor Intelligence | USD 7.34 B (2025) | |
| Industry Association A | USD 8.10 B (2025) | Often reflects a broader optics and photonics revenue pool, and may include more finished module value, which inflates totals when compared to device only counting. |
| Regional Consultancy B | USD 6.85 B (2025) | Typically applies a more conservative ASP decline curve and may freeze FX earlier in the year, which reduces the USD value even if local currency demand is stable. |
Overall, the higher figure is mainly explained by a wider product boundary that pulls in adjacent module and system value, while the lower figure is driven by stricter pricing and currency timing. Using clear device level checks and repeatable assumptions helps keep the market size traceable to practical signals that can be revisited each year.
Key Questions Answered in the Report
What is the current value of the China optoelectronics market?
The China optoelectronics market size stood at USD 7.63 billion in 2026.
How fast will China’s optoelectronics sector grow through 2031?
Aggregate revenue is projected to rise at a 3.96% CAGR, reaching USD 9.27 billion by 2031.
Which device category is expanding the quickest?
Laser diodes lead growth with a 4.86% CAGR, buoyed by LiDAR and optical-network deployments.
What material shows the strongest demand momentum?
Silicon carbide exhibits the highest 4.45% CAGR thanks to electric-vehicle power electronics and 5G amplifiers.
Which end-use segment offers the largest growth opportunity?
Automotive applications are forecast to advance at a 5.72% CAGR as EV and autonomous-driving adoption scales.
How do export controls affect domestic optoelectronics suppliers?
Restricted access to advanced GaN and SiC equipment raises near-term costs and lengthens fab-ramp timelines.