
Market Overview
| Study Period | 2020 - 2031 |
|---|---|
| Forecast Data Period | 2026 - 2031 |
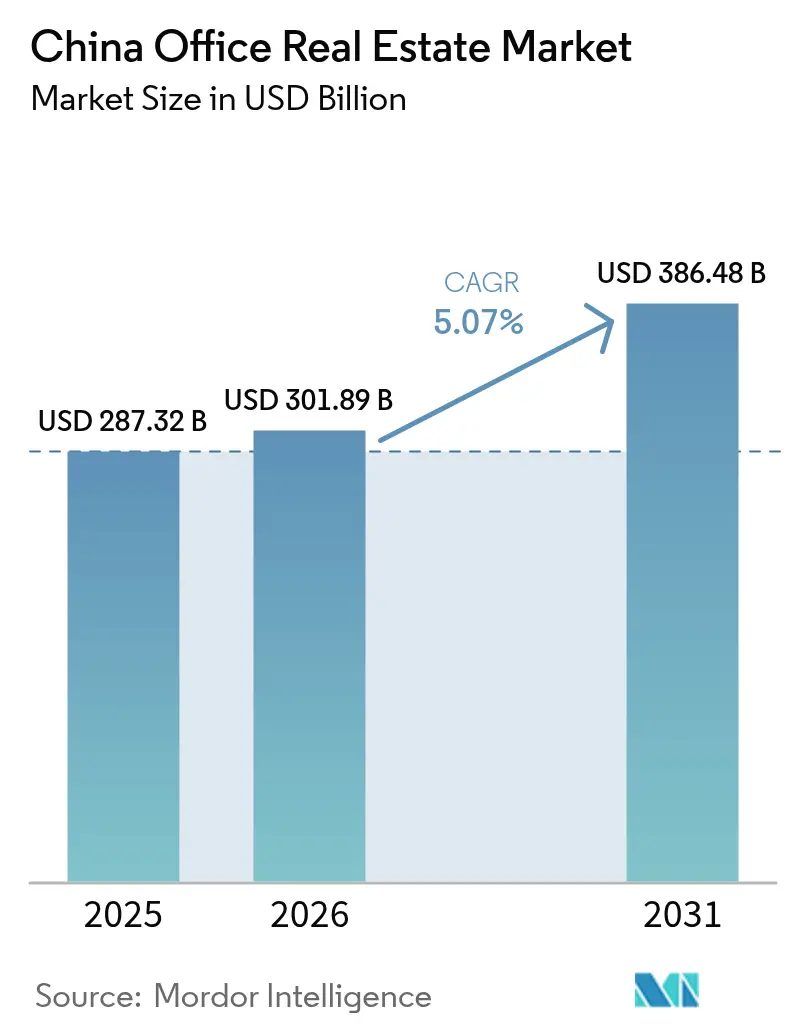
| Base Year Market Size (2025) | USD 287.32 Billion |
| Market Size (2026) | USD 301.89 Billion |
| Market Size (2031) | USD 386.48 Billion |
| Growth Rate (2026 - 2031) | 5.07 % |
| Market Concentration | Medium |
Major Players *Disclaimer: Major Players sorted in no particular order Image © Mordor Intelligence. Reuse requires attribution under CC BY 4.0. | |
China Office Real Estate Market Analysis by Mordor Intelligence
The China Office Real Estate Market size is expected to grow from USD 287.32 billion in 2025 to USD 301.89 billion in 2026 and is forecast to reach USD 386.48 billion by 2031 at 5.07% CAGR over 2026-2031. The market’s near-term stability draws strength from the government’s partial relaxation of the “three red lines” leverage caps, which have unlocked new balance-sheet capacity for distressed-asset purchases. Liquidity has also broadened through the USD 1.5 trillion housing provident fund, which has outpaced banks in mortgage issuance and signaled official resolve to underpin commercial real-estate confidence. Meanwhile, the China Securities Regulatory Commission’s decision to extend the public REIT framework to consumption-linked infrastructure has created a USD 11.9 billion listed platform that channels equity capital directly into the sector. At the demand level, hybrid work has accelerated a flight to quality: Grade A space now captures 51.2% of occupied stock and is expanding fastest at 5.71%, thanks to firms consolidating team hubs to retain talent. Regional policy, notably the “Chengdu 2025 Manufacturing Plan,” is redirecting supply-chain nodes inland and lifting office absorption in interior cities, with Chengdu posting a 6.31% CAGR as the country’s fastest-growing metro market[1]China Real Estate Association, “2024 Annual Office Property Report,” China Real Estate Association, crea.org.cn.
Key Report Takeaways
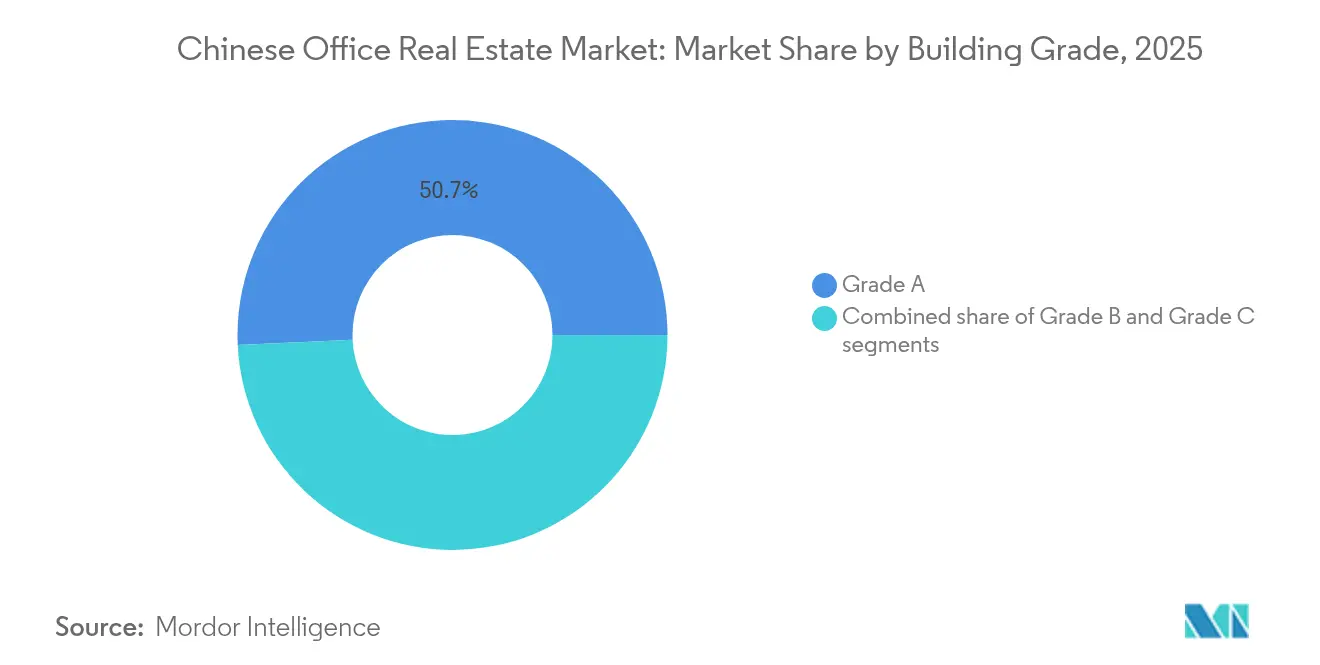
- By building grade, Grade A offices led with 50.74% of China office real estate market share in 2025; Grade A stock is also the fastest-growing segment at a 5.63% CAGR through 2031.
- By transaction type, rentals commanded 70.62% of the China office real estate market size in 2025, while sales transactions are projected to expand at a 5.79% CAGR to 2031.
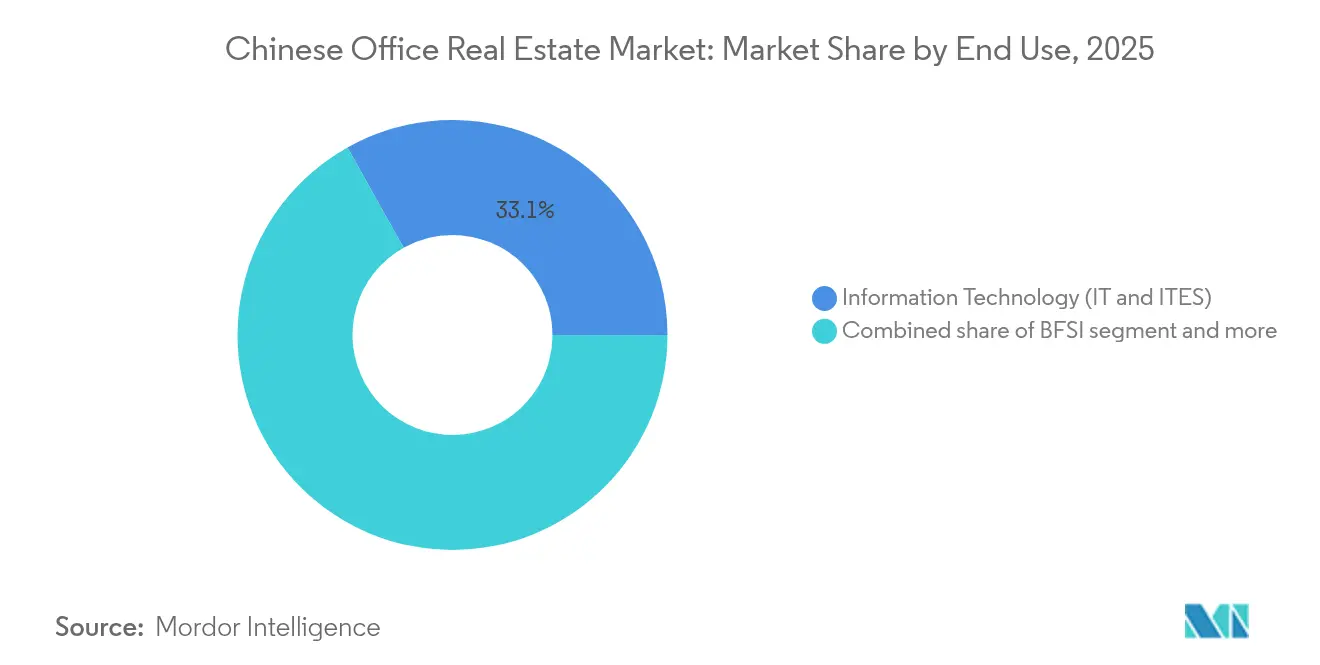
- By end use, the Information Technology segment held 33.12% share of the China office real estate market size in 2025 and is advancing at a 5.96% CAGR through 2031.
- By geography, Shanghai controlled 22.05% of 2025 revenue, whereas Chengdu is forecast to post the quickest 6.21% CAGR to 2031.
Note: Market size and forecast figures in this report are generated using Mordor Intelligence’s proprietary estimation framework, updated with the latest available data and insights as of 2026.
China Office Real Estate Market Trends and Insights
Drivers Impact Analysis*
| Driver | ( ~ ) % Impact on CAGR Forecast | Geographic Relevance | Impact Timeline |
|---|---|---|---|
| Hybrid-work–led flight to quality | +1.2% | Core CBDs in Shanghai, Beijing, Shenzhen | Short term (≤ 2 years) |
| Near-shoring of supply chains to interior cities | +0.9% | Chengdu, Chongqing, Wuhan, Xi’an | Long term (≥ 4 years) |
| Government stimulus for REIT expansion | +0.8% | Tier-1 cities nationwide | Medium term (2-4 years) |
| Digital-services uptake from Gen-AI roll-outs | +0.7% | Beijing Zhongguancun, Shanghai Pudong, Shenzhen Nanshan | Medium term (2-4 years) |
| “Greening” mandates for public buildings | +0.5% | Nationwide, stricter in tier-1 | Long term (≥ 4 years) |
| Growth of corporate innovation centres | +0.6% | Beijing, Shanghai, Shenzhen, Hangzhou | Medium term (2-4 years) |
| Source: Mordor Intelligence | |||
Government Stimulus for REIT Expansion
The broadening of China’s public REIT regime to encompass shopping malls and department stores has transformed how commercial assets secure long-term capital. Allowing investors to trade securitised stakes in stabilized projects tackles the duration mismatch between short-term bank debt and multi-decade real-estate income streams. The timing dovetails with a measured easing of “three red lines” tests for qualified asset takeovers, yielding a coordinated liquidity backstop that supports asset repricing without undermining financial-stability goals. As domestic investors already account for more than 80% of deal flow, the upgraded REIT channel furnishes them with scalable exit routes while giving developers an alternative to on-balance-sheet borrowing. Tier-1 properties stand to benefit first because they offer the cash-flow visibility demanded by institutional allocators.
Hybrid-Work–Led Flight to Quality Demand
Post-pandemic occupancy surveys show that employees are willing to return only to workspaces that improve well-being and collaboration; employers consequently rationalise footprints yet upgrade locations. This pivot has lifted Grade A effective rents by 2.4% since 2023 even as Grade B/C rates slipped 1.2%. Data from Hong Kong indicates 27% of staff would require minimum 6% pay increases to revert to a five-day office week, prompting companies to invest in amenities rather than compensation updates. In Shanghai, premium towers post an 11.5% vacancy rate, far below the city-wide 22.9% figure, underscoring an expanding premium-vs-secondary rent spread. The resulting bifurcation concentrates capital allocation on trophy assets and intensifies pressure on older stock to redevelop or reposition[2]Qian Wang, “Hybrid Work and Office-Space Consolidation in Post-Covid China,” Journal of Real Estate Research, jrer.org.
Near-Shoring of Supply Chains to Interior Cities
Companies are shifting ancillary operations inland to moderate wage bills and diversify geopolitical exposure. Under the “Chengdu 2025 Manufacturing Plan,” office take-up in Chengdu’s Jiaozi Park Financial & Business District has grown alongside the High-tech Zone’s USD 48.5 billion GDP in 2024. The resulting 6.31% CAGR makes Chengdu the fastest-expanding node in the China office real estate market, helped by integrated transport links, a deep graduate pool, and local incentives that lower entry costs for advanced-manufacturing tenants.
Digital-Services Uptake from Gen-AI Roll-Outs
Enterprise Gen-AI programs are fuelling requirements for secure, power-dense workplaces. Huawei’s USD 1.4 billion R&D hub in Shanghai’s Qingpu district exemplifies demand for campus-style environments embedding redundant power feeds and high-capacity cooling. Foreign enterprises boosted on-shore R&D staff to 716,000 in 2024, doubling spending to CNY 338 billion over the past decade, which directly elevates leasing by IT and ITES occupiers.
Restraints Impact Analysis*
| Restraint | ( ~ ) % Impact on CAGR Forecast | Geographic Relevance | Impact Timeline |
|---|---|---|---|
| Oversupply pressure in Tier-2 and Tier-3 cities impacting rental growth | -1.3% | Tier-2 & Tier-3 cities nationwide | Medium term (2-4 years) |
| Economic slowdown and regulatory tightening affecting corporate leasing appetite | -1.1% | National | Short term (≤ 2 years) |
| High vacancy rates in newly developed CBDs delaying absorption | -1.0% | Emerging CBDs in major metros | Medium term (2-4 years) |
| Space rationalization by large occupiers due to hybrid work adoption | -0.8% | National, weighted toward Tier-1 CBDs | Short term (≤ 2 years) |
| Source: Mordor Intelligence | |||
Persistent High Vacancy in Grade B/C Stock
Shanghai’s non-CBD vacancy of 12.2% (versus 11.5% in Grade A core) illustrates how tenants siphon out of secondary assets, forcing landlords to grant concessions of up to 50% to hold occupiers. Beijing mirrors this gap, recording a 21% city-wide vacancy rate in 2024 despite stable demand from state-owned enterprises. Supply risks persist, with 953,000 m² of new Shanghai Grade A completions hitting in 2H 2024, more than double 1H deliveries and compounding shadow stock burdens. Until owners recapitalise and reposition dated premises, structurally weaker cash flows will cap rent growth at the broader market level.
Tighter Developer Financing (“Three Red Lines”)
Although rescue exemptions apply to distressed buy-outs, the core thresholds—liabilities/asset ratio below 70%, net gearing under 100%, and cash/short-term debt above 1—still bind the majority of mid-tier developers[3]National Development and Reform Commission, “14th Five-Year Plan for Building Energy Efficiency and Green Buildings,” National Development and Reform Commission, ndrc.gov.cn. Aggregate financing for the top-100 builders fell 26% in 2024 as cautious banks maintained tighter underwriting. The funding squeeze diverts capital toward residential inventory with faster turnover, constraining the speculative pipeline for new offices and limiting future absorption choices for tenants. Well-capitalised institutions may benefit through discounted asset purchases, but overall deal counts shrink and development diversity narrows.
*Our forecasts treat driver/restraint impacts as directional, not additive. The impact forecasts reflect baseline growth, mix effects, and variable interactions.
Segment Analysis
By Building Grade: Premium Assets Drive Market Bifurcation
Grade A offices held a commanding 50.74% share of the China office real estate market in 2025, far surpassing other tiers. Driven by consolidating occupiers, the segment is forecast to expand at a 5.63% CAGR to 2031, consistently outpacing the broader China office real estate market size. Consolidation enables companies to curtail total square footage while elevating location quality, technology readiness, and ESG credentials. Landlords able to deliver WELL-categorized amenities such as touchless access, enhanced air filtration, and flexible meeting suites are commanding rent premiums of 10%–15% over 2023 pre-lease rates.
Class B assets face prolonged selection pressure, with many towers approaching functional obsolescence. Owners are considering conversions to co-warehousing, life-science incubators, or live-work lofts, yet such projects carry heavy capex. A cohort of investors has begun acquiring Class B/C bundles at discounts exceeding 35% of peak 2018 pricing, betting on urban-renewal benefits. The initiative dovetails with municipal guidance to re-energise dormant footprints, though regulatory permitting for structural retrofits remains a multi-year endeavour.


By Transaction Type: Rentals Underpin Market Stability
Rental agreements accounted for 70.62% of 2025 revenue, anchoring the China office real estate market share as the primary format for corporate occupancy. These contracts offer occupiers risk-mitigated flexibility and allow asset-heavy developers to blend recurring income with capital-event upside. Pure-sale transactions, while smaller, are set to clock the fastest 5.79% CAGR because repricing has drawn in value-oriented domestic groups that missed the previous up-cycle. The accelerated uptake marks a tactical window created by foreign divestments totaling USD 11.2 billion since 2021.
Momentum in the leasing arena is underwritten by state policy that targets a minimum 3% cash yield for professionally managed rental portfolios. Nationwide rent-to-income ratios hover closer to 35% for middle-income households, which caps rent inflation yet secures durable occupancy pipelines for financially disciplined landlords. In parallel, the public REIT platform blends leasehold cash flow with listed-equity liquidity, effectively hybridising the rent-and-sale continuum and deepening market participation.
By End Use: Technology Sector Anchors Digital Transformation
Information Technology and ITES occupiers controlled 33.12% of 2025 demand, the largest slice of China office real estate market size, and are poised to grow at a 5.96% CAGR to 2031. Critical mass stems from Beijing’s S&T‐intensive enterprises and Shenzhen’s hardware ecosystems, each nurturing vertically integrated clusters that prefer high-specification plug-and-play floors. Banking and financial services tenants represent the second-largest category, yet their space usage is flattening as digital channels replace branch-based models.
Life-sciences and energy multinationals add incremental absorption under generous provincial incentive schemes, but retail corporates are net space releasers amid e-commerce disintermediation. The upshot is a widening demand skew in favour of advanced-tech tenants whose budgets allow brownfield customisation. Building owners now embed powered-shell designs capable of 120 W/m² densities, N+1 cooling, and Tier III cloud-connect rooms to future-proof against hardware refresh cycles.
Geography Analysis
Shanghai dominated the 2025 landscape with a 22.05% revenue share, yet its office sector is wrestling with 22.9% vacancies as foreign firms consolidate offshore or relocate to cost-efficient satellite hubs. Effective rents in peripheral submarkets have slipped to USD 41.6 per m² per month, while prime Pudong towers maintain a narrower USD 58.3 rate, illustrating the durability of core Grade A exposure. Shanghai’s policy mix—tax credits for tech exporters and green-retrofit subsidies—seeks to spur absorption, but tenant decision cycles remain elongated.
Beijing, the political nerve centre, logged a 21% vacancy rate in 2024 despite steady state-enterprise commitments. International legal and asset-management brands such as Cleary Gottlieb and BlackRock trimmed central-CBD floorspace, sending Grade A rents down 7.3% year on year to USD 41.3 per m² per month. Local authorities are now pairing tax rebates with three-year rent holidays for AI-startup tenants in Zhongguancun to stabilise net absorption.
Chengdu stands out with a forecast 6.21% CAGR through 2031, catalysed by its manufacturing pivot and Section B Western Financial Innovation Pilot Zone that promotes cross-border RMB settlement. Multinationals such as Intel and Siemens have recently leased 13,000 m² and 9,000 m² respectively in Tianfu New Area, citing lower labour costs and proximity to component suppliers. Land release quotas remain constrained, underpinning landlord pricing power despite rising completions.
Regulatory Landscape
Policy has shifted from incremental expansion to stock-based upgrading, with national agencies tightening new commercial land access while expanding capital-market exits for stabilized assets. In March 2026, the Ministry of Natural Resources introduced a stock-revitalization linkage for construction land, and 2026 policy guidance emphasized controlling new supply and reducing commercial real estate inventory, which has influenced office development pacing in oversupplied submarkets.
On financing and asset circulation, the China Securities Regulatory Commission formalized the commercial REIT pilot in December 2025 (Announcement No. 21), bringing office buildings into the eligible asset set and reinforcing a sell-down and recycle pathway for landlords and developers. Complementing this, the State Council released the Urban Renewal 15th Five-Year Plan (2026-2030) in May 2026, explicitly supporting repurposing underutilized commercial assets, and the People’s Bank of China RMB 300 billion special relending facility for affordable housing (activated in July 2026) strengthened local government capacity to acquire and convert inventory, tightening the link between office vacancy conditions and urban-renewal execution.
Value Chain Analysis
China's office real estate value chain runs from land release and planning approvals through development, construction delivery, leasing and property operations, and then refinancing or exit through asset trades and listed securitization. Upstream, land supply discipline has become a binding input: the 2026 push to restrict new construction land supply for commercial property is redirecting developers toward repositioning and urban-renewal pipelines rather than greenfield office starts.
Downstream, leasing intermediaries and corporate occupiers drive cash-flow stability, which then affects refinancing options and transaction liquidity. The emergence of commercial REITs adds a new distribution and exit layer, with the CSRC approving registration for the first batch on April 24, 2026 and the Shanghai Stock Exchange listing the first batch on June 18, 2026, enabling mature office assets to tap public-market funding and providing a recycling route for capital tied in stabilized buildings. With vacancy elevated across major tracked cities (25.4% in 2025) and Grade A inventory scale reported at 99.2 million sq m across 21 major cities by end-2025, differentiation is increasingly concentrated in asset management, including tenant mix, building upgrades, and energy performance, rather than construction volume alone.
Competitive Landscape
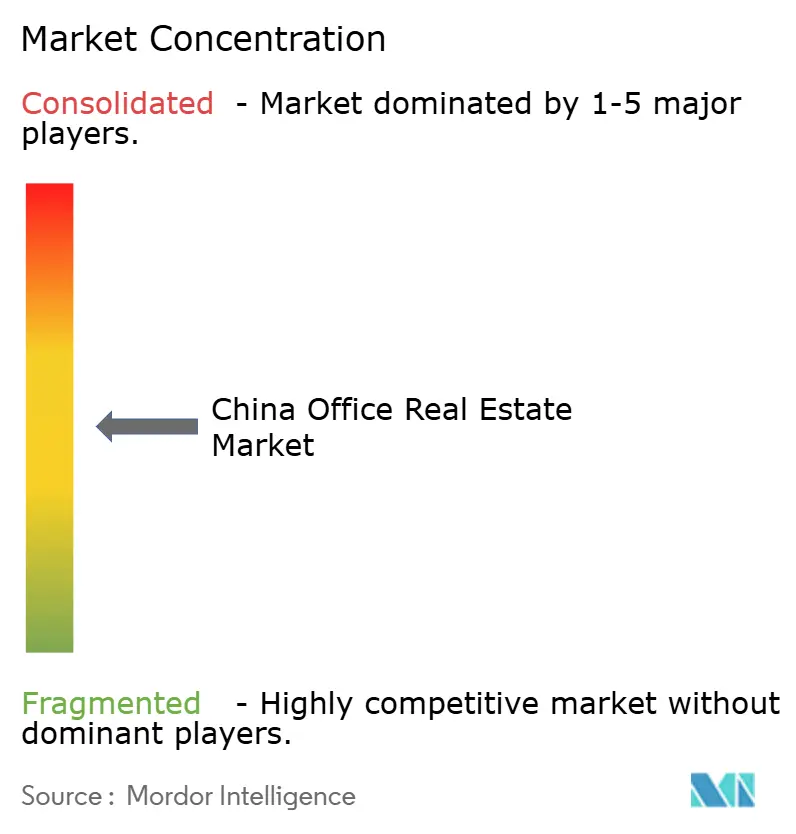
The China office real estate market is moderately concentrated. Foreign funds recorded their fourth consecutive year of net selling in 2024, unloading USD 11.2 billion worth of towers since 2021 and retreating from speculative ground-up ventures. Domestic insurers, securities firms, and local government financing vehicles filled the gap, capturing more than 80% of deal volume, up from 60% five years ago. The shift reflects both global risk-aversion and Beijing’s continuing encouragement for “national team” entities to acquire strategic assets at cyclically advantageous valuations.
Strategically, large-cap developers are trimming non-core holdings to raise liquidity for deleveraging. Shanghai Lujiazui Finance & Trade Zone Development Co. placed 20 buildings valued at USD 4.1 billion on the market, while BlackRock accepted a 30% haircut on a pair of Shanghai towers bought in 2018 to expedite exit. The re-pricing wave is resetting yields closer to 6.2% for Grade A core CBD assets compared with sub-5% peaks in 2019, presenting a total-return upswing for patient capital.
Technology adoption has emerged as a decisive differentiator. CapitaLand Integrated Commercial Trust and Yuexiu REIT each upgraded portfolio towers with smart-metering, digital twin modelling, and app-based wellness services to capture relocation demand from TMT occupiers. Conversely, smaller cash-constrained landlords have struggled to finance retrofits, creating a widening gulf in occupancy performance and investor attention.
China Office Real Estate Industry Leaders
WANDA Group
Country Garden Property Development Co., Ltd
Vanke Co., Ltd.
Sunac China Holdings Limited
Poly Developments & Holdings
- *Disclaimer: Major Players sorted in no particular order

Market Opportunities and Future Outlook
Urban renewal and adaptive reuse are the main opportunity set as national policy steers capital toward revitalizing underutilized commercial stock. The Urban Renewal 15th Five-Year Plan (2026-2030) explicitly promotes repurposing underused commercial office and industrial assets into affordable housing or community infrastructure, while the RMB 300 billion special relending facility from the People’s Bank of China (activated in July 2026) provides a funding channel that supports local acquisition and conversion programs. For office owners, this opens pathways to monetize structurally challenged Grade B/C buildings through conversion, redevelopment partnerships, or disposal into policy-supported buy-and-transform pipelines.
Quality upgrades and green-compliance retrofits also represent a second opportunity area, especially for assets competing for technology and R&D occupiers that prioritize building performance and reliability. The China Association for Engineering Construction Standardization published T/CCIAT 0111-2026 (effective June 1, 2026), reinforcing standardized green construction practices that can be translated into retrofit specifications and procurement criteria for landlords and contractors. In parallel, the commercial REIT channel is operationalized through the first batch's registration approval (April 2026) and listing at the Shanghai Stock Exchange (June 2026), supporting owners that can package stabilized, well-leased Grade A assets into compliant vehicles and recycle proceeds into repositioning or tenant-driven capex. Flagship completions such as Hang Lung Properties Westlake 66 in Hangzhou (opened April 2026, with multiple Grade A office towers) are also raising the bar for amenity, sustainability credentials, and institutional-grade operations, which increases the premium on differentiated assets.
Recent Industry Developments
- July 2026: China Vanke scheduled an extraordinary general meeting for July 31, 2026 to vote on a new board structure and director remuneration. The governance reset occurred alongside continued balance-sheet actions, keeping market focus on execution capacity and asset-management discipline at a major national developer with broad commercial exposure.
- June 2026: Three insurance companies invested about CNY 3 billion to acquire nearly 50% of Beijing Dinghao Plaza, highlighting the role of insurers as a liquidity source for commercial assets. The transaction underscored a shift in buyer mix toward long-duration domestic capital that can hold and reposition office-linked complexes through the cycle.
- December 2025: The China Securities Regulatory Commission issued Announcement No. 21 to launch the commercial REIT pilot program, allowing office buildings among eligible underlying assets. This expanded the public REIT framework from infrastructure into commercial property, strengthening exit optionality for stabilized office owners and linking leasing performance more directly to capital-market access.


Research Methodology Framework and Report Scope
Market Definition and Coverage
For this study, the China office real estate market is sized as the value generated from leasing and outright sale activity of purpose-built office buildings used for corporate occupancy across key Chinese cities.
Scope exclusions: We exclude owner-occupied headquarters expansions, mixed-use assets where offices are under 60% of gross leasable area, and short-term coworking sub-leases.
Segmentation Overview
- By Building Grade
- Grade A
- Grade B
- Grade C
- By Transaction Type
- Rental
- Sales
- By End Use
- Information Technology (IT & ITES)
- BFSI (Banking, Financial Services and Insurance)
- Business Consulting & Professional Services
- Other Services (Retail, Lifescience, Energy, Legal)
- By Major Cities
- Beijing
- Shanghai
- Shenzhen
- Guangzhou
- Chengdu
- Rest of China
Data Sources, Market Sizing, and Validation
Desk Research
We started by building a fact base on supply, demand, and pricing signals that can be checked repeatedly across cycles. Public sources were used for market context and reference series, such as National Bureau of Statistics of China releases, People's Bank of China policy statements, Ministry of Housing and Urban-Rural Development updates, and SAFE or customs statistics where capital flow and construction inputs matter. We also reviewed city-level planning and statistics portals for leading metros, along with peer-reviewed urban economics and real estate journals for how vacancy, net absorption, and rent indices are commonly measured.
On the industry side, we used listed developer and property services filings, exchange announcements, and investor decks to track portfolio area, leasing performance, and disclosed rental yields. News and financial datasets supported timeline checks on major launches and policy changes, and an import/export shipment-level database was used selectively to sense construction material activity when it helped explain supply timing. The desk sources listed here are illustrative, and many additional public documents and datasets were referenced for collection, cross-checking, and clarification.
Primary Interviews and Surveys
To close gaps left by public data, we validated assumptions through interviews and structured surveys with landlords, brokers, occupiers, property managers, valuers, and financing-side stakeholders who track leasing and transactions. These discussions clarified how Grade A, B, and C stock is counted in practice, how incentives change effective rents versus listed rents, and how vacancy and take-up trends vary by city tier and submarket.
Distribution of primary research fieldwork respondents
| Company type | Respondent position |
|---|---|
| Top tier: 39% | CXOs: 16% |
| Mid tier: 44% | Functional/Unit leaders: 40% |
| Smaller Players: 17% | Managers: 44% |
Market-Sizing & Forecasting
The market was modeled using a top-down approach where city-level office stock and commissioning schedules are reconstructed first, and then filtered through occupancy, net absorption, and rent trajectories to estimate the value pool. Because a single headline number can hide swings in effective pricing, we separated face rents from net effective rents by applying incentive and vacancy adjustments that were validated in primary calls.
To keep the model grounded, we used a small set of inputs that have clear real-world meaning, including Grade A/B/C inventory additions, vacancy rate direction, net absorption, rent indices (and incentive depth), and transaction activity as a confidence check on pricing. Forecasts were produced using scenario analysis, where baseline rent and occupancy paths were set city-tier wise and then stress-tested for tighter credit, delayed project delivery, or faster demand recovery. We then corroborated totals with selective bottom-up approximations, such as sampled rents per square meter applied to occupied stock in representative cities, followed by checks against disclosed portfolio performance in filings. Where evidence was limited, we used conservative city-tier proxies until better inputs were available.
Data Validation & Update Cycle
We tested outputs against independent signals, including reported vacancy and absorption trends, rent index direction, and disclosed leasing performance for major portfolios, so obvious mismatches could be flagged early. Outliers were reviewed in more than one step, starting with source reconciliation and unit consistency checks, followed by analyst review of assumptions like incentive rates, commissioning timing, and currency conversion points.
If a material change is observed, such as a large policy move affecting financing or an unexpected supply surge in key cities, the assumptions are revisited and relevant experts are re-contacted. The report is refreshed annually, and interim updates are made when market-moving events require it, followed by a final pre-delivery pass so clients receive the most current view.
Mordor Intelligence's China Office Real Estate Market Size Versus Other Published Estimates
Published market sizes for China office real estate can look far apart, even when the topic name sounds the same. The differences usually come from what is counted as office (pure office versus mixed-use), whether values are based on rents, asset value, or transactions, and how incentives and vacancies are treated in effective pricing.
Vacancy and net absorption trends, together with rent index direction and commissioning pipelines, are the checks that keep Mordor Intelligence's estimate tied to a defined pool of purpose-built office buildings and a consistent effective rent logic. Another frequent gap driver is geography, since some sources cover only Tier 1 cities or only Grade A, and some include coworking sub-leases or owner-occupied space that does not behave like a traded or leased market. Currency timing also matters, because using different RMB-to-USD conversion points can shift the USD total even when local numbers are similar.
Benchmark comparison
| Source | Market Size | Gaps in Research Methodology |
|---|---|---|
| Mordor Intelligence | USD 287.32 B (2025) | |
| Global Brokerage Report A | USD 214.60 B (2025) | Often limited to Grade A inventory in a smaller set of major cities, with market value inferred mainly from prime rents and does not fully normalize incentives into net effective rents. |
| Industry Research Brief B | USD 352.90 B (2025) | Frequently expands scope to mixed-use offices and serviced office sub-leases, and may apply a more aggressive rent recovery path without matching it to vacancy and absorption constraints. |
The spread in published values is mostly explained by scope boundaries and how effective rents are treated when vacancies are elevated. By anchoring the model to observable stock, commissioning, vacancy, and leasing take-up signals, and then validating pricing adjustments through interviews, our number remains traceable to repeatable steps that users can follow.


Key Questions Answered in the Report
What is the current value of the China office real estate market?
The market is valued at USD 301.89 billion in 2026 and is projected to reach USD 386.48 billion by 2031.
Why are Grade A offices outperforming other segments?
Hybrid work encourages firms to consolidate into high-spec locations with better amenities and ESG credentials, pushing Grade A to a 5.63% CAGR.
Which city is the fastest-growing office market in China?
Chengdu leads with a forecast 6.21% CAGR, helped by manufacturing near-shoring and innovation policies.
How does the public REIT program affect office investment?
The expanded REIT framework channels equity capital into stabilized office projects, offering owners alternative exits and investors liquid exposure.
What impact do green-building mandates have on vacancy?
Certified buildings command rent premiums and lower vacancy, while non-compliant stock faces obsolescence and higher leasing risk.
Who are the dominant buyers in China’s office market today?
Domestic institutions now account for more than 80% of transactions, filling the gap left by four straight years of foreign net selling.
Page last updated on:


 Your data is secure and never sold or shared.


