
Market Overview
| Study Period | 2020 - 2031 |
|---|---|
| Forecast Data Period | 2026 - 2031 |
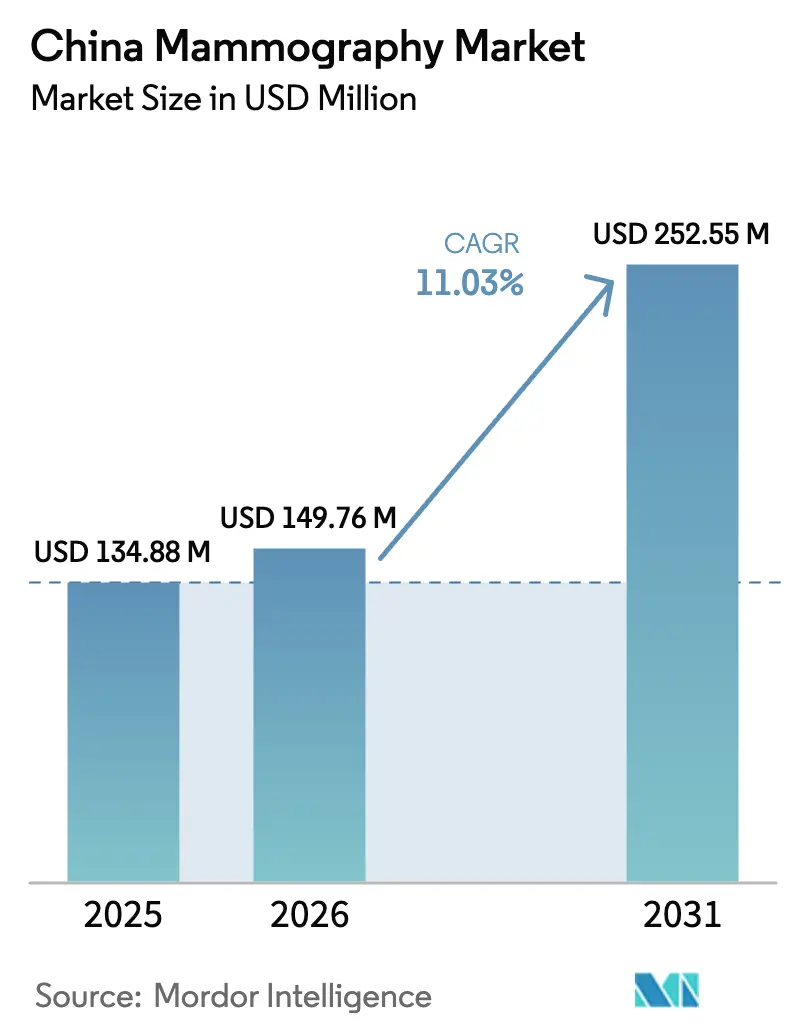
| Base Year Market Size (2025) | USD 134.88 Million |
| Market Size (2026) | USD 149.76 Million |
| Market Size (2031) | USD 252.55 Million |
| Growth Rate (2026 - 2031) | 11.03 % |
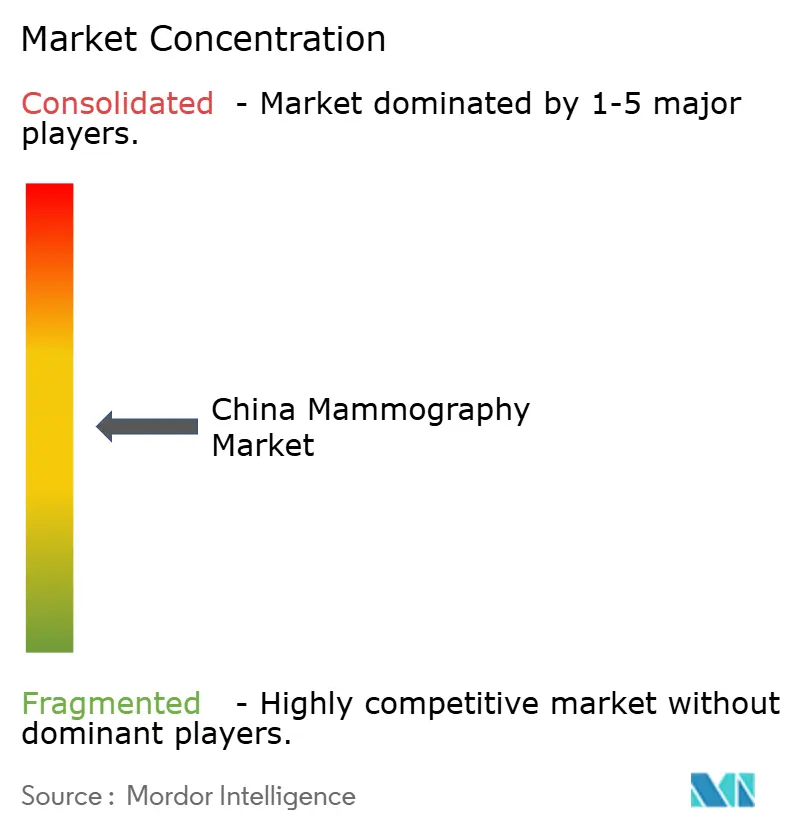
| Market Concentration | Medium |
Major Players *Disclaimer: Major Players sorted in no particular order Image © Mordor Intelligence. Reuse requires attribution under CC BY 4.0. | |
China Mammography Market Analysis by Mordor Intelligence
China Mammography Market size in 2026 is estimated at USD 149.76 million, growing from 2025 value of USD 134.88 million with 2031 projections showing USD 252.55 million, growing at 11.03% CAGR over 2026-2031.
Continued expansion is driven by the government’s “Two-Cancer” screening program, the rising incidence of breast cancer, and accelerated technology upgrades in tertiary hospitals. Hospitals are prioritizing full-field digital and 3-D tomosynthesis systems for sharper images and artificial-intelligence (AI) compatibility, while provincial volume-based procurement (VBP) keeps hardware prices in check, indirectly widening access. Domestic manufacturers leverage cost competitiveness and local procurement preferences to challenge multinational incumbents, yet international vendors retain an edge in high-end AI-enabled modalities. Meanwhile, mobile screening vans and specialty breast clinics extend services into tier 3 and tier 4 counties, closing gaps in rural detection rates. Combined, these forces sustain a balanced growth outlook for the Chinese mammography market through 2030.
Key Report Takeaways
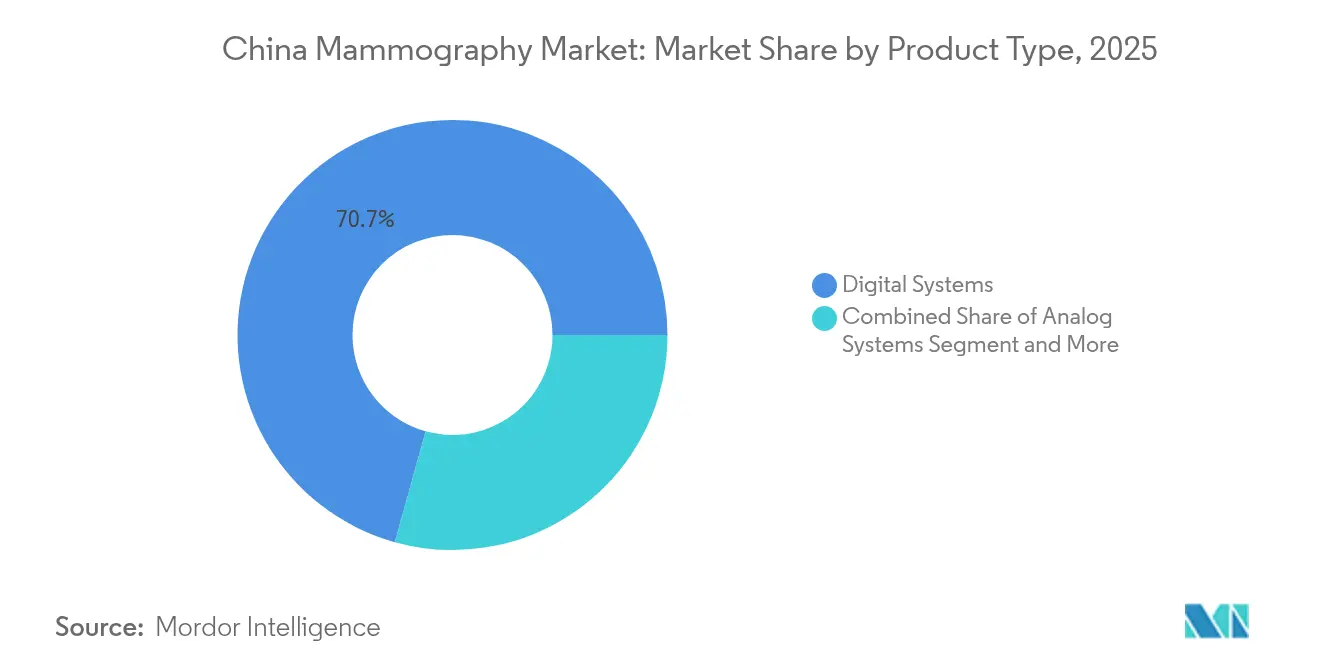
- By product type, digital systems led with 70.68% of the China mammography market share in 2025, while breast tomosynthesis is forecast to expand at an 11.73% CAGR through 2031.
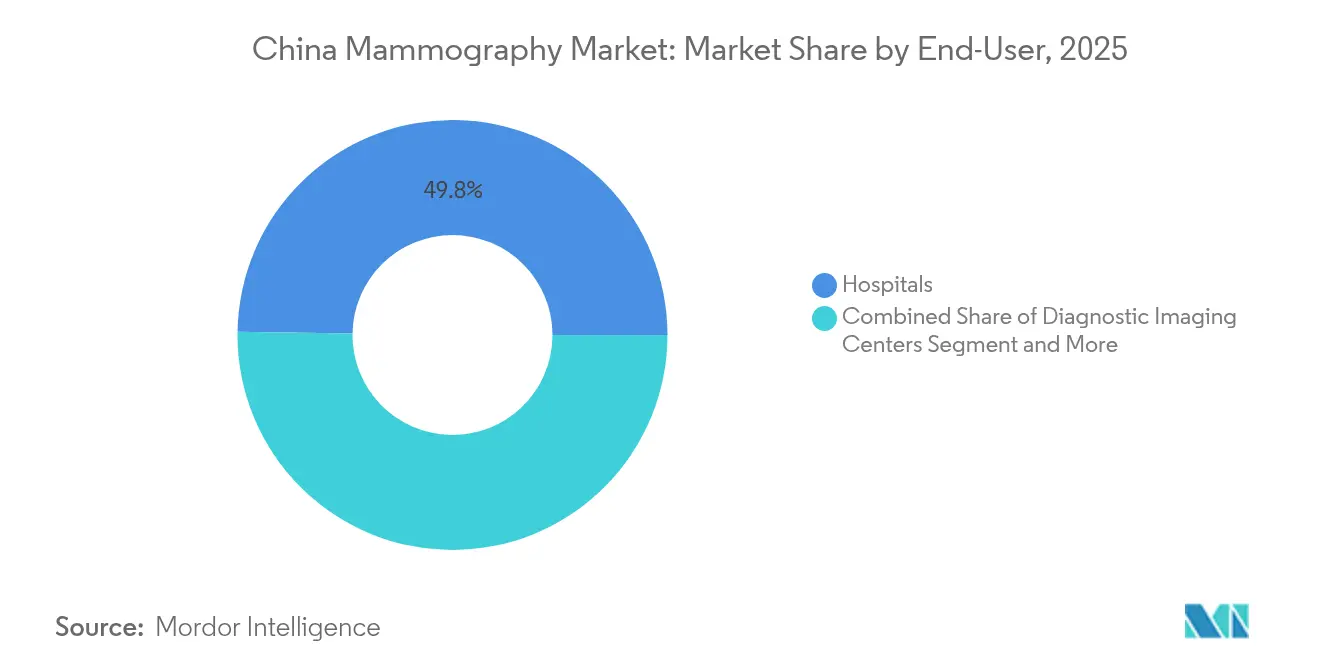
- By end-user, hospitals held 49.76% of the China mammography market size in 2025 and specialty breast clinics are expected to post a 11.99% CAGR to 2031.
Note: Market size and forecast figures in this report are generated using Mordor Intelligence’s proprietary estimation framework, updated with the latest available data and insights as of 2026.
China Mammography Market Trends and Insights
Drivers Impact Analysis*
| Driver | (~) % Impact on CAGR Forecast | Geographic Relevance | Impact Timeline |
|---|---|---|---|
| Growing Burden of Breast Cancer | +2.8% | National, with higher impact in tier-1 cities | Long term (≥ 4 years) |
| Technological Shift to Full-Field Digital & 3-D Tomosynthesis | +2.1% | National, led by Class III hospitals | Medium term (2-4 years) |
| Nation-Wide "Two-Cancer" Screening Expansion | +3.2% | National, with rural focus | Long term (≥ 4 years) |
| AI-Powered CAD Adoption in Class III Hospitals | +1.8% | Tier-1 and tier-2 cities | Short term (≤ 2 years) |
| Provincial Volume-Based Procurement Slashing System Prices | +1.1% | National, provincial variations | Medium term (2-4 years) |
| Mobile Screening Vans Reaching Tier-3/4 Counties | +0.9% | Rural and tier-3/4 cities | Long term (≥ 4 years) |
| Source: Mordor Intelligence | |||
Growing Burden of Breast Cancer
China recorded 357,200 new breast-cancer cases and 75,000 deaths in 2022, the highest incidence in Asia, prompting aggressive screening investments. Incidence peaks among women aged 50-54, aligning with global guidelines and underpinning equipment demand across all province tiers. Urban–rural gaps persist, with incidence rates of 35.45 versus 29.38 per 100,000, respectively, motivating resource allocation toward underserved regions. Long-term demographic shifts and lifestyle changes sustain the upward trajectory of breast-cancer burden, reinforcing a durable need for mammography capacity. Consequently, the China mammography market continues to align public-health imperatives with robust commercial opportunities.
Technological Shift to Full-Field Digital & 3-D Tomosynthesis
Digital breast tomosynthesis (DBT) achieves a sensitivity of 86%, compared to 80% for conventional digital systems, resulting in a significant reduction in false-positive callbacks.[1]Dense breast tissue, present in roughly 70% of Asian women, benefits most, accelerating DBT installations in Class III hospitals. Economic models show incremental cost-effectiveness ratios of USD 5,971.58 per QALY, validating capital outlays. Synthetic 2-D reconstruction further reduces patient radiation exposure without compromising accuracy. AI algorithms integrated into DBT platforms achieve area-under-the-curve scores exceeding 0.93, enhancing lesion detection and positioning high-end systems as the benchmark for the China mammography market.
Nation-Wide “Two-Cancer” Screening Expansion
The “Two-Cancer” program achieved 51.5% coverage of eligible women aged 35-64 in 2024, marking the world’s largest organized breast-cancer screening initiative. Policy makers aim for 70% coverage by 2030, prompting provincial health bureaus to allocate funds for mammography fleets, workforce training, and data infrastructure. Coverage disparities, with urban areas at 65% versus rural areas at 48.2%, drive the procurement of mobile vans and tele-radiology solutions to bridge the gaps. Provinces such as Guangdong are forecasted to have 25,444 new cases in 2023, catalyzing concentrated demand for premium systems in high-burden metropolitan areas. Sustained government funding underpins a stable long-run pipeline for the China mammography market.
AI-Powered CAD Adoption in Class III Hospitals
Clinical studies show AI-assisted CAD achieves 91.5% sensitivity and 96.3% specificity in breast-lesion detection, freeing scarce radiologists for complex reads. Tier-1 hospitals lead the way in deployment because they possess the data-management capacity, PACS integration, and R&D linkages necessary to work with domestic AI vendors. DeepSeek AI now runs in about 100 facilities, demonstrating scalable rollouts that complement existing image-archiving systems. Fast-track NMPA approvals over 60 AI certificates since 2023 shorten commercialization cycles, allowing AI innovators to reach the China mammography market swiftly.
Restraints Impact Analysis*
| Restraint | (~) % Impact on CAGR Forecast | Geographic Relevance | Impact Timeline |
|---|---|---|---|
| Radiation-Exposure Risk Perception | -1.4% | National, higher in rural areas | Medium term (2-4 years) |
| Inadequate Reimbursement Outside Urban Megacities | -2.1% | Rural and tier-3/4 cities | Long term (≥ 4 years) |
| High Capex Versus Ultrasound Alternatives | -1.8% | Tier-2/3 cities and rural hospitals | Medium term (2-4 years) |
| Stringent NMPA Domestic-Content Localisation Quotas | -1.2% | National, affecting international brands | Short term (≤ 2 years) |
| Source: Mordor Intelligence | |||
Radiation-Exposure Risk Perception
Studies reveal radiation fear remains a leading deterrent to screening participation, especially where health literacy is limited. Misinformation on social media amplifies skepticism, necessitating structured educational campaigns that explain low-dose protocols and highlight cumulative safety records. Manufacturers mitigate concerns by promoting synthetic 2-D imaging that halves radiation relative to legacy systems. Continuous professional training for primary-care providers and collaboration with local women’s organizations help normalize mammography in apprehensive communities, steadily improving uptake within the China mammography market.
Inadequate Reimbursement Outside Urban Megacities
Rural residents often bear higher out-of-pocket costs because public insurance schemes prioritize city centers, hampering equipment utilization in lower-tier hospitals.[2] Clinics may struggle to meet volume thresholds that justify mammography investments, thereby slowing penetration in provinces with dispersed populations. National Health-Security Administration reforms propose enhanced subsidies, but rollout timelines remain uncertain. Vendors respond by offering leasing models and pay-per-scan contracts that reduce capital barriers. Yet, structural reimbursement gaps continue to temper growth potential in remote segments of the China mammography market.
*Our forecasts treat driver/restraint impacts as directional, not additive. The impact forecasts reflect baseline growth, mix effects, and variable interactions.
Segment Analysis
By Product Type: Digital Platforms Consolidate Leadership
Digital systems accounted for 70.68% of the China mammography market share in 2025, underscoring the dominance of full-field digital and DBT technology in tertiary and secondary hospitals. Rapid image acquisition, cloud archiving, and seamless integration with AI-based CAD workflows underpin their appeal. Analog units persist only in budget-constrained rural centers but face declining procurement as VBP narrows price differences. Breast tomosynthesis leads growth, posting an 11.73% CAGR projected through 2031, propelled by superior sensitivity in dense-breast populations and favorable cost-effectiveness profiles.
Beyond screening, stereotactic biopsy attachments and contrast-enhanced modules extend platform utility, offering incremental revenue via procedure-based reimbursements. Manufacturers bundle software upgrades as software-as-a-service, ensuring recurring income while customers maintain updated diagnostic functionality. These trends cement digital systems as the cornerstone of the China mammography market size for the foreseeable future.

By End-User: Hospitals Dominate While Specialty Clinics Surge
Hospitals captured 49.76% of the China mammography market size in 2025, reflecting entrenched referral flows, oncology integrations, and qualified radiology staff levels. Class III institutions deploy multi-vendor fleets to balance capacity, redundancy, and research requirements. Conversely, specialty breast clinics register the fastest growth at a 11.99% CAGR to 2031, fueled by demand for same-day diagnostics, personalized care, and boutique patient experiences.
Diagnostic imaging centers bridge gaps in mid-sized cities, offering accessible yet specialized services without hospital wait times. Mobile units, supported by provincial grants, extend reach into frontier counties, where screening volumes were historically too low to justify fixed installations. Collectively, this heterogenous end-user mix broadens overall penetration, supporting the long-run expansion of the China mammography market.
Geography Analysis
Regional patterns mirror China’s economic geography. Tier-1 clusters, including Beijing-Tianjin-Hebei, Yangtze River Delta, and Pearl River Delta, host the majority of high-end digital and DBT units due to their dense patient volumes, strong purchasing power, and academic-clinical collaboration. Urban facilities routinely integrate AI algorithms and participate in multi-center trials, reinforcing technology leadership and shaping procurement benchmarks nationwide.
Central and western provinces experience faster percentage growth, driven by state-funded infrastructure programs and targeted rural health subsidies.Annual device tenders in these regions increased by 74% during the first half of 2025, indicating a geographic rebalancing of demand. Nonetheless, utilization rates remain lower than coastal hubs, suggesting latent capacity that will mature over the forecast period.
Mobile screening strategies mitigate geographic inequities. Government-backed fleets equipped with low-dose digital detectors and cloud-based AI triage travel to townships on rotating schedules, narrowing participation gaps. Early evidence shows detection rates comparable to fixed centers, validating the model’s clinical efficacy. Taken together, geographic dynamics reinforce both concentration in wealthy metros and dispersion in underserved interiors, sustaining diversified growth across the China mammography market.
Regulatory Landscape
Mammography systems in China are regulated by the National Medical Products Administration (NMPA) as medical devices that require registration (typically Class II or Class III, depending on configuration and intended use) and adherence to device-specific technical review expectations, including NMPA guidance used for mammography system registration review. Manufacturers and importers must maintain compliant quality management and post-market obligations to keep products eligible for hospital tenders and screening-program deployment.
Regulatory requirements are tightening around quality systems and standards alignment. NMPA announced a revised Good Manufacturing Practice (GMP) for medical devices that takes effect on November 1, 2026, raising compliance expectations for manufacturers operating in-country. In parallel, the NMPA standards work plan for 2026 includes updates to medical device standards to better align with international ISO standards, which affects type testing and renewal submissions as registration certificates come up for periodic renewal.
Value Chain Analysis
The China mammography value chain spans upstream component sourcing (X-ray tubes, flat-panel detectors, generators, motion and positioning subsystems), midstream system engineering and manufacturing (mechanical integration, shielding, embedded software, calibration, and quality testing), and downstream commercialization through hospital and clinic tenders, channel partners, installation, and long-term service. In practice, localization is common in final assembly, software integration, system calibration, and field-service networks, while certain high-end components still depend on specialized global supply chains.
Downstream, procurement routes include hospital capital equipment budgets and provincially organized purchasing mechanisms, with volume-based procurement (VBP) shaping pricing discipline and vendor selection for standardized configurations. Service and workflow integration (PACS connectivity, AI-CAD deployment, training, and preventive maintenance) has become a core value-capture layer as screening programs scale. NMPA-driven standards updates and the revised GMP effective November 2026 raise documentation and quality-control requirements across manufacturing and service operations.
Competitive Landscape
Competition centers on technology leadership, VBP resilience, and localization compliance. Hologic, Siemens Healthineers, and GE HealthCare maintain premium positioning through advanced AI integration, ergonomic patient design, and global service footprints. Domestic challengers United Imaging Healthcare, Mindray, and Neusoft capitalize on price agility, NMPA fast-track approvals, and government preference for local content.
Strategic alliances intensify differentiation. Hologic and Siemens share detector technologies to accelerate innovation, while Philips partnered with CHISON to co-develop breast-imaging solutions for mid-tier hospitals. AI software vendors, such as Deepwise and RadNet, embed algorithms into OEM hardware, offering turnkey solutions that combine acquisition and interpretation. VBP favors suppliers capable of scaling nationally, thereby enhancing the bargaining position of large domestic brands.
Localization quotas stipulate rising domestic-content ratios, nudging multinationals to expand in-country manufacturing or joint ventures. Those that comply swiftly protect market access; laggards face procurement exclusion. As AI becomes table stakes, differentiation shifts to workflow orchestration, cloud analytics, and lifetime-service economics, shaping the next phase of rivalry within the China mammography market.
China Mammography Industry Leaders
-
Carestream Health Inc.
-
GE Healthcare
-
Siemens Healthineers AG
-
Fujifilm Holdings Corporation
-
Koninklijke Philips NV
- *Disclaimer: Major Players sorted in no particular order
Market Opportunities and Future Outlook
Program-driven screening expansion continues to create openings for capacity additions beyond top-tier coastal hubs. The national "Two-Cancer" screening initiative reached 51.5% coverage of eligible women aged 35-64 in 2024, with a visible gap between urban (65%) and rural (48.2%) participation that supports demand for mobile screening units, standardized digital platforms, and tele-radiology workflows. Procurement data also points to geographic rebalancing, with annual device tenders in central and western regions rising 74% in the first half of 2025, signaling active project pipelines for fixed and mobile deployments.
Technology and compliance shifts are opening upgrade-led opportunities in premium systems and software. AI-enabled workflows are moving from pilots to scaled implementations in higher-tier hospitals, supported by faster authorization pathways for software (over 60 AI certificates since 2023) and a growing installed base of AI tools cited across facilities. On the supply side, NMPA is advancing standards alignment through its 2026 standards revision work and implementing a revised medical device GMP effective November 1, 2026. Together with localization policy signals, this supports in-country manufacturing, type testing, and service capability build-out, and creates selling opportunities around compliant lifecycle management (upgrades, renewals, and quality-system readiness) for both domestic manufacturers and multinationals expanding local footprints.
Recent Industry Developments
- June 2026: Siemens Healthineers announced plans at the China International Supply Chain Expo (CISCE) on June 22 to expand its Wuxi R&D and manufacturing facility in Jiangsu province to increase production capacity for advanced medical equipment. The announcement reinforces in-country supply and localization, which can support competitiveness in provincial tenders and large screening deployments where delivery timelines and service coverage matter.
- April 2026: Yinkang Life introduced its fourth-generation Navigator Advance series digital mammography X-ray system at the 93rd China International Medical Equipment Fair (CMEF). The platform integrates 2D imaging, tomosynthesis, AI-assisted diagnosis, and biopsy-related functions, adding a domestic alternative aimed at hospitals and specialty breast centers seeking multi-function, workflow-oriented upgrades.
- November 2024: GE HealthCare integrated RadNet's Smartmammo AI workflow into the Senographe Pristina platform for distribution across Chinese breast centers. This integration supports bundled hardware-plus-AI offerings, enabling more standardized reading workflows in high-throughput screening settings and raising the bar for AI-ready digital mammography systems.
Research Methodology Framework and Report Scope
Market Definition and Coverage
For this study, the market covers revenue generated in China from mammography systems used for breast imaging and screening, including equipment sold into hospitals, diagnostic imaging centers, and related care settings.
Scope exclusions: We exclude breast ultrasound, breast MRI, biopsy-only devices, general X-ray/DR systems not configured for mammography, and service-only revenue that is not tied to mammography equipment sales.
Segmentation Overview
- By Product Type
- Digital Systems
- Analog Systems
- Breast Tomosynthesis (3-D)
- Others (e.g., stereotactic biopsy units)
- By End-User
- Hospitals
- Specialty Breast Clinics
- Diagnostic Imaging Centers
- Mobile Screening Units
Data Sources, Market Sizing, and Validation
Desk Research
Desk research starts by setting the demand context in China, so we can understand how screening intensity and hospital capacity are moving over time. We referenced public sources such as the National Health Commission policy releases, National Bureau of Statistics health spending and hospital statistics, China Customs import and export statistics for relevant imaging categories, and peer reviewed clinical and epidemiology literature.
We also used manufacturer annual reports, investor presentations, tender announcements from public hospital procurement portals, and reputable press coverage to cross-check pricing direction and upgrade cycles. Where needed, a paid subscription for company financials and news was used to validate shipment signals and public contract wins, and a patent database was checked to understand the pace of technology change. These examples are not exhaustive, and other sources were also consulted to collect data, validate assumptions, and clarify open questions.
Primary Interviews and Surveys
Primary work was used to convert broad screening and procurement signals into practical market inputs, especially where public reporting is not detailed enough at the product level. We spoke with hospital imaging heads, procurement staff, distributors, and service partners across major provinces, and then used the feedback to confirm adoption pace, replacement timing, and typical deal structures.
Distribution of primary research fieldwork respondents
| Company type | Respondent position |
|---|---|
| Top tier: 31% | CXOs: 20% |
| Mid tier: 48% | Functional/Unit leaders: 32% |
| Smaller Players: 21% | Managers: 48% |
Market-Sizing & Forecasting
Market sizing was built using a top-down and bottom-up approach, where the demand pool in China was first reconstructed from imaging capacity and screening activity, then cross-checked against supplier and channel signals. The top-down side used indicators such as the number of facilities offering breast imaging, the pace of equipment upgrades in county and city hospitals, typical replacement cycles, and the split between digital and advanced modalities. These inputs were translated into annual unit needs and value using realistic pricing bands.
To keep the totals grounded, we corroborated the outputs with selective bottom-up approximations, including distributor channel checks, sampled average selling price by system type, and roll-ups from visible public tenders in key provinces, followed by adjustments where gaps were identified. When direct unit visibility was weak (for example, smaller private centers), the model filled the gap using penetration assumptions tied to facility counts and verified utilization patterns.
Forecasts were generated using scenario analysis, where base case volumes and prices were moved based on interview-led consensus on screening program expansion, hospital capex cycles, tender pacing, and technology shift toward higher value systems. The pricing path also considered expected tender-led price normalization and mix changes, so growth is not driven only by units.
Data Validation & Update Cycle
Validation is handled through multiple checks so the final market number stays consistent with real world signals. We compare model outputs with independent metrics like public procurement volumes, facility expansion trends, and reported imaging utilization direction, and then outliers are reviewed before sign-off.
If a variance looks material, analysts re-check the underlying inputs and may re-contact sources to confirm whether the change is caused by timing shifts, policy actions, or price movement. Reports are refreshed annually, with interim updates when major events occur, and a final pre-delivery review is completed so clients receive the most current view available.
Mordor Intelligence's China Mammography Market Size Compared Against Other Published Estimates
Published market sizes for mammography in China can look far apart because authors do not always count the same revenue streams, and they also pick different timing for what they call the base year. Differences often come from whether the estimate is strictly equipment revenue, whether services and software are bundled, and how tender pricing is treated when large public procurements happen.
The key gap drivers usually show up around scope boundaries and pricing logic, where some estimates include adjacent breast imaging modalities or treat the market as a broader breast diagnostics equipment pool. Another common reason is the forecast stance, since some figures assume aggressive screening rollouts in lower tier cities without validating readiness factors like staffing and installed base replacement needs.
Benchmark comparison
| Source | Market Size | Gaps in Research Methodology |
|---|---|---|
| Mordor Intelligence | USD 134.88 M (2025) | |
| Regional Consultancy A | USD 682.50 M (2026) | This figure appears to use a wider definition that likely bundles broader breast imaging or related diagnostic revenue, and it also starts from a later year with a larger assumed demand step-up. |
| Industry Brief B | USD 915.00 M (2025) | This estimate is consistent with a full equipment plus services framing, and it may apply higher tender price baselines and faster mix shift assumptions without separating new installs from replacement demand. |
The table shows a wide spread, and in Mordor Intelligence's model the value is limited to mammography equipment revenue in China, with tender pricing and replacement timing checked against field feedback before totals are finalized. With the scope made explicit and the inputs tied to observable demand and procurement signals, decision-makers can trace what is included and repeat the same steps when they update assumptions.
Key Questions Answered in the Report
How big is the China Mammography Market?
The China Mammography Market size is expected to reach USD 149.76 million in 2026 and grow at a CAGR of 11.03% to reach USD 252.55 million by 2031.
How fast is breast tomosynthesis adoption growing in China?
Breast tomosynthesis systems are projected to post an 11.73% CAGR between 2026 and 2031, the fastest among product categories.
Who are the key players in China Mammography Market?
Carestream Health Inc., GE Healthcare, Siemens Healthineers AG, Fujifilm Holdings Corporation and Koninklijke Philips NV are the major companies operating in the China Mammography Market.
Which end-user segment contributes most to equipment demand?
Hospitals account for 49.76% of annual revenues, driven by integrated oncology services and high patient throughput.