
Market Overview
| Study Period | 2020 - 2031 |
|---|---|
| Forecast Data Period | 2026 - 2031 |
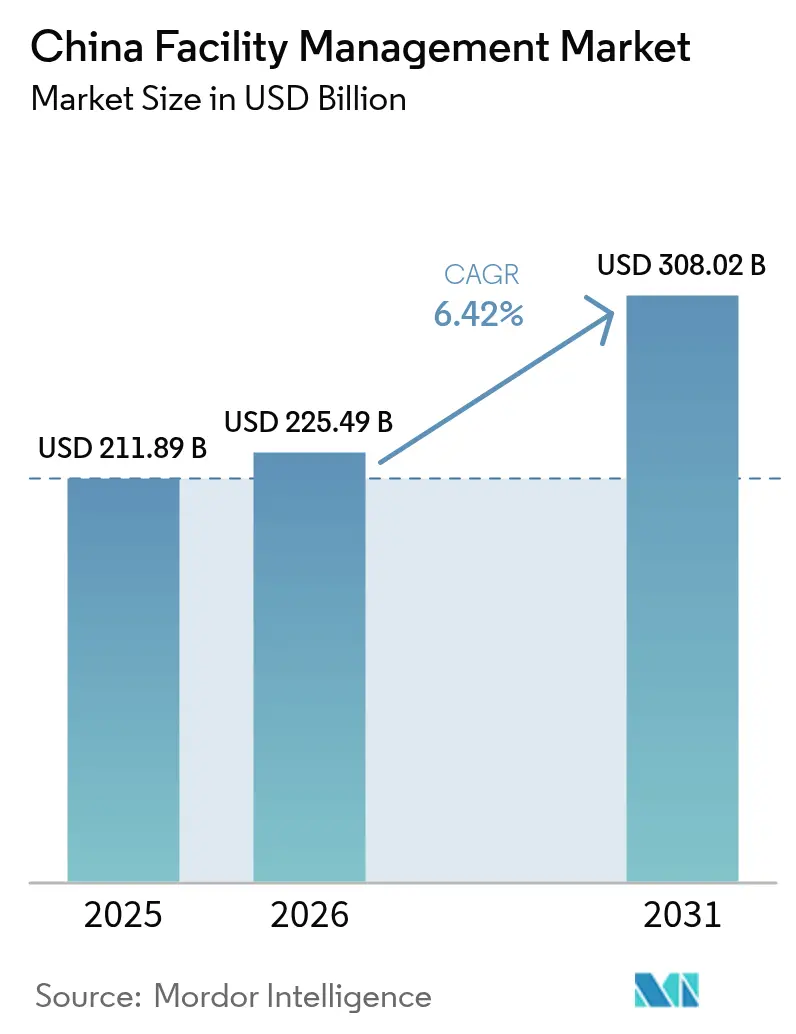
| Base Year Market Size (2025) | USD 211.89 Billion |
| Market Size (2026) | USD 225.49 Billion |
| Market Size (2031) | USD 308.02 Billion |
| Growth Rate (2026 - 2031) | 6.42 % |
| Market Concentration | Medium |
Major Players *Disclaimer: Major Players sorted in no particular order Image © Mordor Intelligence. Reuse requires attribution under CC BY 4.0. | |
China Facility Management Market Analysis by Mordor Intelligence
The China facility management market size is expected to grow from USD 211.89 billion in 2025 to USD 225.49 billion in 2026 and is forecast to reach USD 308.02 billion by 2031 at 6.42% CAGR over 2026-2031. Growth is underpinned by state-owned enterprises (SOEs) accelerating outsourcing, commercial landlords embracing smart-building technologies, and expanding demand for ESG-compliant services. Tier-2 and tier-3 cities are becoming powerful growth nodes, even as the real-estate debt crisis limits new supply in the short term. Bundled and integrated contracts now outpace single-service agreements as clients pursue outcome-based procurement. Technology-enabled, energy-efficient solutions are reshaping competitive positioning, while in-house teams at large tech firms create selective substitution risk. Fragmentation persists, yet the quest for scale and digital capability is nudging the China facility management market toward gradual consolidation.
Key Report Takeaways
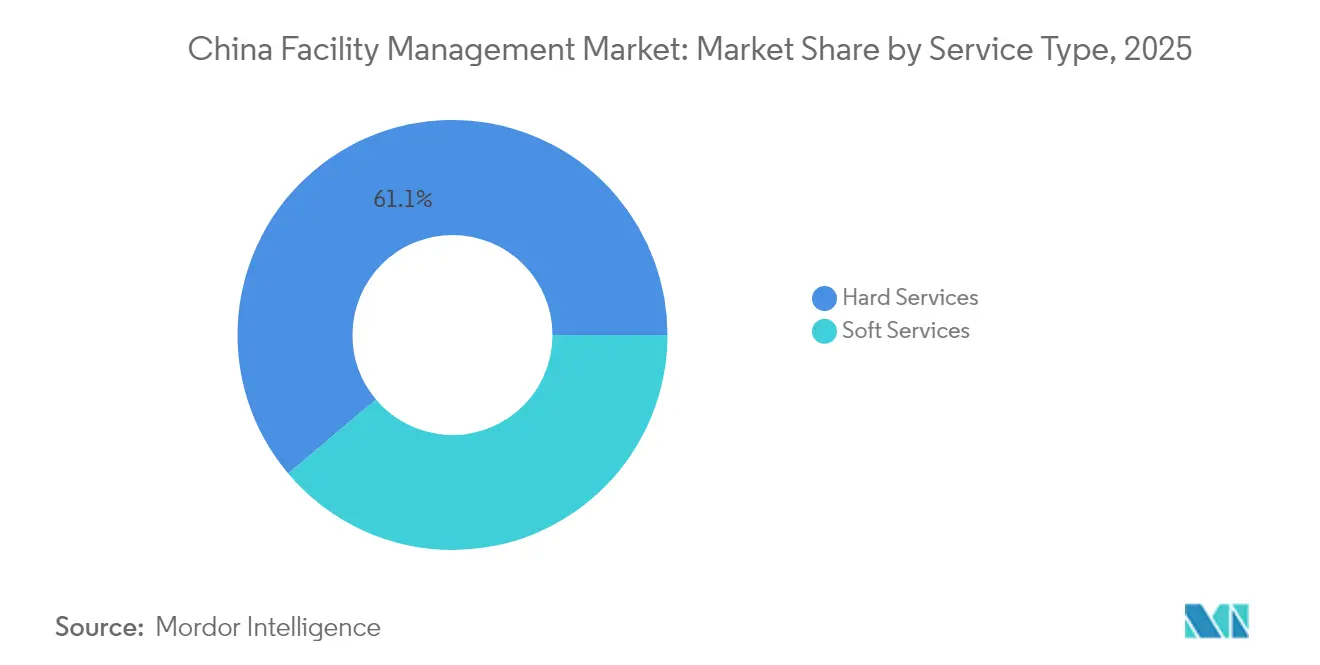
- By service type, hard services led with 61.15% revenue share in 2025; soft services are on track to post a 7.18% CAGR through 2031.
- By offering type, the outsourced segment accounted for 68.25% of the China facility management market share in 2025, while its blended growth is projected at a 6.63% CAGR to 2031.
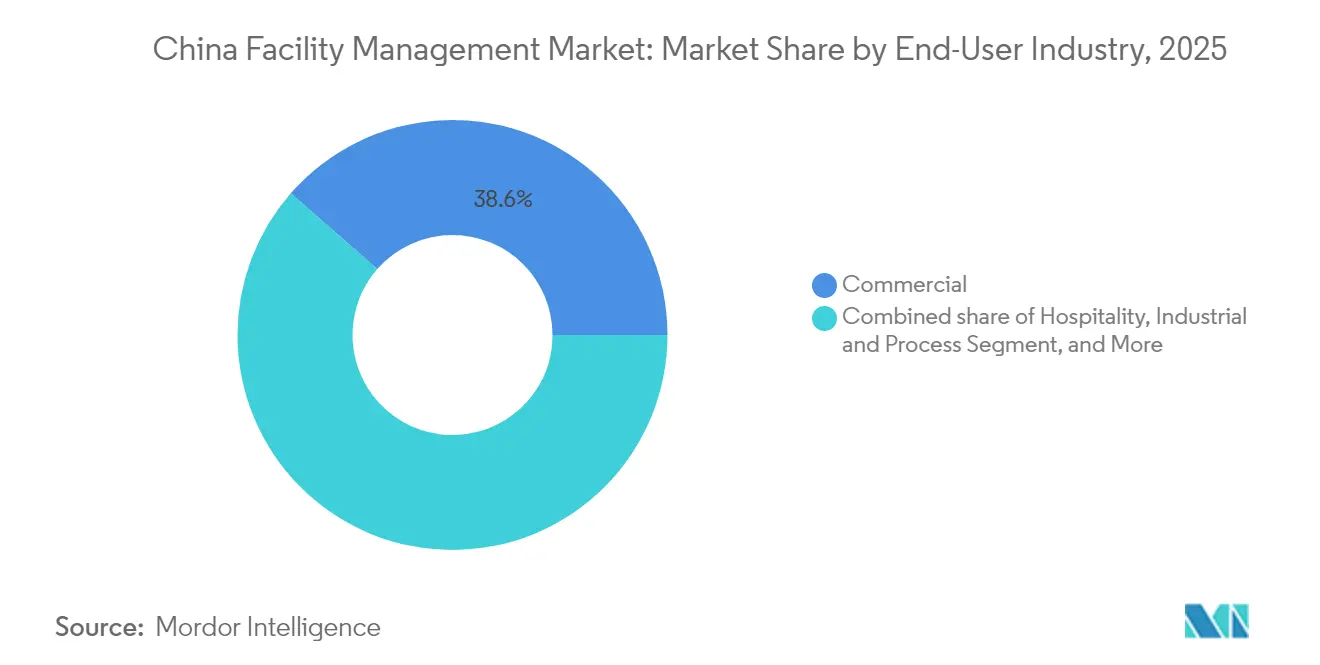
- By end-user industry, commercial facilities captured 38.55% of the China facility management market size in 2025; industrial and process sites are expected to expand at a 7.46% CAGR between 2026-2031.
Note: Market size and forecast figures in this report are generated using Mordor Intelligence’s proprietary estimation framework, updated with the latest available data and insights as of 2026.
Market Trends and Insights
Drivers Impact Analysis of China Facility Management Market*
| Driver | (~) % Impact on CAGR Forecast | Geographic Relevance | Impact Timeline |
|---|---|---|---|
| Outsourcing momentum among SOEs | +1.2% | Beijing, Shanghai, Guangzhou | Medium term (2-4 years) |
| Smart-building and IoT adoption | +1.8% | Tier-1 expanding to tier-2 | Long term (≥ 4 years) |
| Growth in green-certified stock | +1.1% | Nationwide metros | Long term (≥ 4 years) |
| Tier-2 and tier-3 CRE expansion | +0.9% | Central and Western hubs | Medium term (2-4 years) |
| Mixed-ownership reform of public assets | +0.7% | National | Medium term (2-4 years) |
| E-commerce cold-chain logistics | +0.8% | Coastal corridors | Short term (≤ 2 years) |
| Source: Mordor Intelligence | |||
Rising Outsourcing Adoption Among State-Owned Enterprises
Central SOEs booked profits of CNY 2.6 (USD 0.36) trillion and revenue of CNY 39.8 (USD 5.51) trillion in 2024, freeing capital to concentrate on strategic priorities while outsourcing non-core operations. Stock-performance-linked oversight heightened pressure on operational efficiency, prompting a steady flow of bundled contracts to professional providers. The State-owned Assets Supervision and Administration Commission (SASAC) aligns outsourcing policy with national goals, giving the China facility management market a predictable pipeline from SOE portfolios. [1] Medium-term growth is reinforced as more provincial SOEs replicate the central blueprint in transport, energy, and telecom estates.
Integration of Smart Building Technologies and IoT-Driven Predictive FM
AI-enabled building-management systems cut energy use and carbon emissions by up to 30% in large office towers, while IoT diagnostics achieve 97% fault-identification accuracy. Property technology firms deploy more than 10,000 sensors in flagship complexes, slashing labor cost by 62%. Generative AI tools even redesign plant layouts to meet Industry 4.0 workflows, shrinking installation lead-time and downtime. As tenants equate indoor-environment quality with talent retention, the China facility management market sees premium pricing for providers offering end-to-end digital twins, cloud dashboards, and data-driven energy retrofits.
Growth of Green Building Stock Driving Demand for Energy-Efficient FM
China hosts 3,620 LEED-certified projects and over 25,000 domestic Three-Star green buildings, many mandated to meet Basic Grade codes by 2025. [2]Facility operators must deliver measurable resource savings across energy, water, and waste, driving adoption of advanced metering, recommissioning, and renewable micro-grids. ESG-linked financing further rewards landlords that partner with sustainability-focused vendors. The China facility management market therefore prizes certifications such as WELL, RESET, and ISO 14001 as differentiators during tendering.
Expansion of Commercial Real Estate in Tier-2 and Tier-3 Chinese Cities
Urbanization reforms elevate cities like Chengdu (population 20.93 million in 2023) and Chongqing as alternative corporate hubs where grade-A stock is still affordable. [3] Municipal transport upgrades and newly liberalized land-use rules propel office, logistics, and retail construction pipelines. Early movers among facility firms lock in multi-year integrated contracts, positioning cross-selling as occupiers scale. The shift diversifies revenue away from saturated tier-1 markets, mitigating vacancy-rate pressure.
Restraints Impact Analysis of China Facility Management Market*
| Restraint | (~) % Impact on CAGR Forecast | Geographic Relevance | Impact Timeline |
|---|---|---|---|
| Real-estate debt overhang | -0.9% | Nationwide metros | Short term (≤ 2 years) |
| In-house FM at tech majors | -0.6% | Tier-1 tech clusters | Medium term (2-4 years) |
| Fragmented fire-safety codes | -0.4% | Cross-province sites | Long term (≥ 4 years) |
| Carbon-audit cost under ETS | -0.3% | Heavy-industry belts | Medium term (2-4 years) |
| Source: Mordor Intelligence | |||
Real-Estate Debt Crisis Limiting New Facility Supply and Renovation Budgets
Major developers such as China Vanke reported USD 6.2 billion losses, and commercial deals slid to USD 38.6 billion in 2024 from USD 60.3 billion in 2021. Distressed-asset sales at steep discounts divert capital from refurbishment, compressing FM budgets. Providers face intensified price negotiations, especially in offices where vacancies exceed 21% in Beijing. Short-term headwinds will be eased only after balance-sheet repair unlocked construction starts
Rising Competition from In-House FM Teams of Large Technology Conglomerates
Tencent bought 70,601 m² in Beijing for CNY 6.42 (USD 0.86) billion and Alibaba opened a 470,000 m² campus, both staffed by proprietary FM divisions. Tech giants integrate AI building analytics with corporate IT stacks, creating high entry barriers for external vendors. Outsourced specialists respond by focusing on multi-tenant assets and industries where neutrality and compliance outweigh data-sovereignty concerns
*Our forecasts treat driver/restraint impacts as directional, not additive. The impact forecasts reflect baseline growth, mix effects, and variable interactions.
China Facility Management Market Segment Analysis
By Service Type:
Hard Services Retain Scale, Soft Services OutpaceHard services contributed 61.15% of the China facility management market in 2025 due to mandatory life-safety and MEP upkeep under GB 55037-2022 fire code. Demand clusters around HVAC retrofits, asset reliability, and statutory inspections. Soft services, projected at a 7.18% CAGR to 2031, gain from heightened post-pandemic hygiene standards, agile workplace support, and AI-enabled energy stewardship that delivered annual savings of CNY 1.25 million in pilot malls. With ESG disclosures expanding, soft-service vendors now bundle waste diversion and catering carbon-tracking as premium add-ons. As a result, the China facility management market size for soft services is on a steeper trajectory than its hard-services counterpart

By Offering Type:
Outsourced Dominance with Integrated Models AscendingOutsourced contracts captured 68.25% of the China facility management market share in 2025 and are on course for a 6.63% CAGR through 2031, reflecting client focus on core-business differentiation. Single-service agreements still prevail in smaller assets, but bundled and fully integrated FM increasingly win corporate and public-sector tenders where total lifecycle cost of ownership guides procurement. Integrated FM solutions improve governance by consolidating KPIs across safety, sustainability, and occupant experience. Conversely, the in-house share remains 31.75%, held mainly by tech and heavy-industry owners prioritizing data control. The cost-to-serve for advanced analytics favors scale operators, reinforcing future outsourcing momentum in the China facility management market.
By End-User Industry:
Commercial Sector Leads, Industrial Segment AcceleratesCommercial facilities including offices, data centers, and omnichannel retail, accounted for 38.55% of 2025 revenue. Corporate occupiers chase differentiated tenant experience as a lever to reduce high vacancy, especially in Shanghai where speculative grade-A supply keeps rents negotiable. The industrial and process segment is forecast to grow at 7.46% CAGR, propelled by cross-border e-commerce and a cold-chain logistics market already valued at CNY 339.1 billion. Temperature-controlled warehouses, semiconductor fabs, and battery plants rely on stringent GMP-style protocols, offering rich wallet-share for FM specialists versed in ISO 50001 energy management.
Geography Analysis
Eastern provinces remain the revenue anchor, buoyed by Shanghai’s 152,460 m² of net office absorption and 343,500 m² in retail take-up during Q3 2024. Mature infrastructure and multinational tenancy support sophisticated scopes—energy dashboards, WELL-certified fit-outs, and 24/7 command centers—allowing premium fees. South-Central locales led by Chengdu post the highest forward CAGR as population inflow, low real-estate cost, and policy incentives attract head-office relocations. New supply triggers early outsourcing of cleaning, security, and MEP under multi-year contracts, boosting the China facility management market size in interior basins.
The Northwest and Southwest corridors register rapid growth under the Western Development Strategy that funnels public-works capex into photovoltaics, high-speed rail, and logistics hubs. Local authorities embed green-building benchmarks in tenders, benefitting firms armed with ISO 45001 safety credentials and carbon-footprint calculators. North and Northeast markets, although mature, still offer stable demand as political and financial institutions in Beijing uphold quality benchmarks that ripple through vendor selection.
Regulatory Landscape
China facility management operates within an increasingly formal national standards stack aligned to the ISO 41000 series, overseen by national standardization bodies and the Facility Management technical committee (TC581). In 2026, the framework was reinforced by GB/T 47134-2026 (Facility management, development of a facility management strategy, effective May 1, 2026), which sets out how owners and service providers align FM objectives to core business priorities and sustainability requirements.
Compliance expectations are also moving beyond service delivery toward demonstrable management-system maturity and digital operations. The State Administration for Market Regulation issued GB/T 47413-2026 (guidance on evaluation of facility management systems maturity) on March 31, 2026, with implementation from July 1, 2026, providing a reference for audits and tender qualification in large, multi-site portfolios. In parallel, MOHURD-backed digitalization standards such as GB/T 20299.3-2024 for property management digital technical application (effective April 1, 2025), along with local property-service standards for quality and safety evaluation, increase cross-province compliance work, especially for integrated FM contracts spanning multiple cities.
Value Chain Analysis
The value chain begins with upstream inputs that shape service delivery capability: skilled and certified labor (MEP technicians, fire and safety specialists, cleaning and catering staff), OEMs and distributors for building systems (HVAC, BMS, fire systems, security), and software layers that support digital twins, IoT monitoring, and work-order automation. Standards-led digitization, including property-management digital technical application under GB/T 20299.3-2024, is pulling technology vendors and platform integrators deeper into FM bids, shifting purchasing away from ad-hoc tools toward standardized intelligent operations and maintenance platforms.
Midstream, FM providers package these inputs into single, bundled, or integrated FM delivery models, then deliver through regional branches and subcontractor networks for on-site coverage. Downstream demand is moving toward multi-site, outcome-oriented IFM, as shown by GLP Asset Services Platform signing an IFM agreement with Mercedes-Benz Group to manage 300,000 square meters of supply chain and logistics facilities across China (April 2026), and Great Wall Property Group starting IFM services for xFusion (FusionServer) across more than 30 sites nationwide (April 2026). Customers include commercial landlords and industrial occupiers, where centralized command centers, uniform KPIs, and energy-optimization reporting increasingly influence supplier selection and renewal decisions.
Competitive Landscape
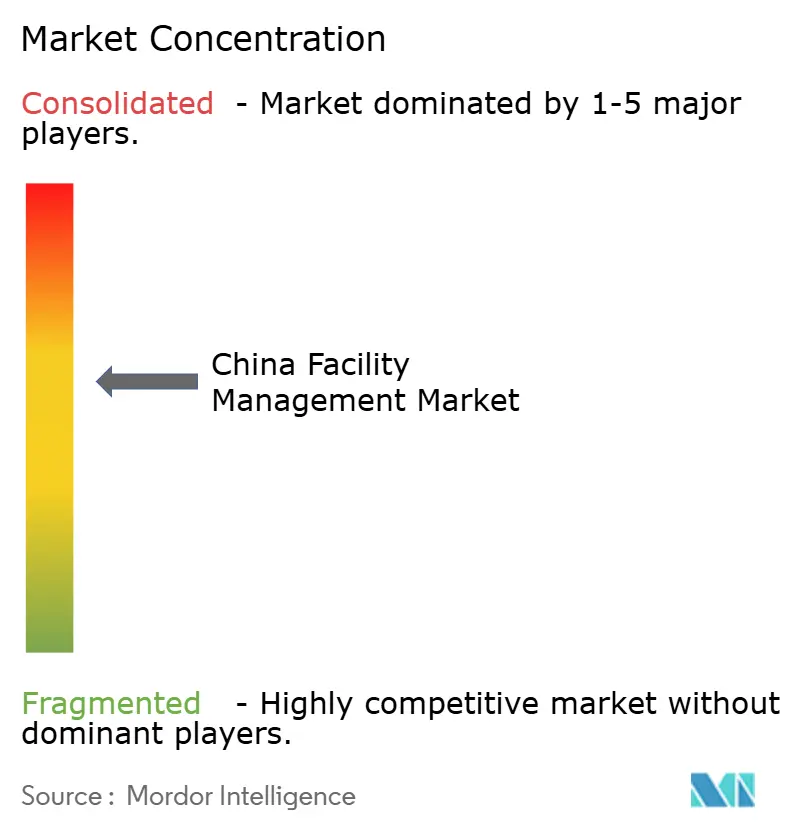
The landscape stays moderately fragmented: the top five players represent under 40% of total revenue, yet concentration is inching upward as clients consolidate supplier panels. Global majors such as CBRE logged 16% year-over-year FM revenue growth in Q1 2025 and deepened their domestic footprint by merging a USD 3 billion project-management arm with Turner & Townsend. [4]Cushman & Wakefield likewise surpassed earnings targets by sharpening sector specialization in data centers and life sciences. Domestic giants Onewo Space-Tech and China Shine leverage cost agility and local-government networks, while ISS and Sodexo pursue tuck-in acquisitions—Sodexo’s 2025 purchase of Compass China businesses expands its food-service-linked integrated FM reach. Success increasingly hinges on IoT platforms, energy-optimization algorithms, and ESG reporting dashboards, differentiating leaders in the China facility management market.
China Facility Management Industry Leaders
-
Leadec Industrial Services (Shanghai) Co., Ltd.
-
Sodexo China
-
ESG Holdings Limited
-
Aeon Delight Co., Ltd.
-
CBRE
- *Disclaimer: Major Players sorted in no particular order
China Facility Management Market Companies Covered in this Report
- Leadec Industrial Services (Shanghai) Co., Ltd.
- Sodexo China
- ESG Holdings Limited
- Aeon Delight Co., Ltd.
- Diversey Holdings LTD
- Serco Group Consultants (Shanghai) Ltd.
- China Shine (EQT Investors)
- ISS Group
- Colliers International Property Services Ltd.
- G4S China
- Aden Group
- Onewo Space-Tech Service Co., Ltd
- CBRE
- Cushman & Wakefield
- Jones Lang LaSalle IP, Inc.
Market Opportunities and Future Outlook
Technology-led integrated FM is an area where standards and customer operating models are converging toward auditable, system-based management. With GB/T 47134-2026 in force from May 1, 2026 and GB/T 47413-2026 implemented from July 1, 2026, providers have a framework to turn strategy development, maturity assessment, and continuous-improvement programs into repeatable offerings for large portfolios, especially for SOEs and national accounts that need comparable governance across provinces.
Industrial automation build-outs and data center infrastructure are also supporting FM demand that can sustain high-uptime operations, power-density upgrades, and integrated maintenance workflows across production, warehousing, and utilities. In 2026, new advanced manufacturing and logistics facilities came online, including an 800,000 square foot micro-precision factory in Xiamen (TDConnex, May 2026) and an intelligent manufacturing and logistics headquarters integrating automated storage and software control layers (FutureTech Data Systems, June 2026), which expands the installed base for predictive maintenance, energy management, and digital O&M platforms. China Telecoms announced in July 2026 an expansion of AI data center footprint across eight hubs, alongside 800G transmission link upgrades, reinforcing a parallel need for specialized FM in high-reliability environments where remote monitoring, preventive maintenance discipline, and compliance documentation drive procurement priorities.
Recent Industry Developments in China Facility Management Market
- April 2026: Leadec closed fiscal year 2025 with sales of EUR 1.35 billion and highlighted decarbonization and circular economy solutions as growth themes. The company also outlined a 2026 focus on digitalization, IIoT, and AI-based maintenance applications, signaling continued investment in technology-enabled hard services for industrial and process sites. This direction increases competitive pressure on providers that do not have scalable predictive maintenance and energy-optimization capabilities.
- June 2025: Aden Services formed a strategic integrated facilities management partnership with TotalEnergies to manage its 35,000 sqm China headquarters. The scope covered cleaning, maintenance, landscaping, and hygiene, supported by Aden's digital twin platform for oversight and performance tracking. The partnership points to rising demand for platform-led IFM delivery in multinational workplace portfolios, where reporting depth and service integration can outweigh single-service pricing.
- January 2024: CBRE confirmed plans to combine its project-management unit with Turner and Townsend, creating a project management platform positioned around large infrastructure and green-energy programs. The move deepens CBREs ability to pair capital project execution with ongoing FM scopes such as commissioning, energy retrofits, and lifecycle asset management. It also raises the bar for integrated providers competing on end-to-end delivery from build or upgrade through operations.
China Facility Management Market Report Scope and Research Methodology
Market Definition and Coverage
For this study, the China facility management market is defined as the annual value of hard and soft services used to operate, maintain, and support buildings and facilities across commercial, institutional, public infrastructure, healthcare, industrial, and similar sites within China.
Scope exclusions: We exclude one-time construction and major retrofit project work that is not part of recurring facility operations and maintenance contracts.
Segments Covered in This Report
- By Service Type
- Hard Services
- Asset Management
- MEP and HVAC Services
- Fire Systems and Safety
- Other Hard FM Services
- Soft Services
- Office Support and Security
- Cleaning Services
- Catering Services
- Other Soft FM Services
- Hard Services
- By Offering Type
- In-house
- Outsourced
- Single FM
- Bundled FM
- Integrated FM
- By End-user Industry
- Commercial (IT and Telecom, Retail and Warehouses, etc.)
- Hospitality (Hotels, Eateries, Large-scale Restaurants)
- Institutional and Public Infrastructure (Govt, Education, Transportation)
- Healthcare (Public and Private Facilities)
- Industrial and Process (Manufacturing, Energy, Mining)
- Other End-user Industries (Multi-housing, Entertainment, Sports and Leisure)
Data Sources, Market Sizing, and Validation
Desk Research
Desk research was used to build the initial demand picture and to set realistic ranges for service intensity by building type. We relied on public sources such as the National Bureau of Statistics of China for macro indicators, the Ministry of Housing and Urban-Rural Development for built-environment context, and the National Development and Reform Commission for infrastructure direction and policy signals.
To make the model measurable, we also reviewed statistics and guidance from sources such as ISO facility management standards publications, UN Comtrade for trade-linked cues on equipment replacement cycles, and peer-reviewed journals that discuss HVAC, MEP upkeep, and building operations practices. Company annual reports, investor presentations, and reputable business press were used to understand outsourcing moves, bundled contract structures, and typical service lines. Where available, we cross-checked select financial and patent records through paid subscriptions for company intelligence and patent databases to confirm which service areas are scaling. The desk sources listed here are illustrative and not exhaustive, since many other references were used for data collection, validation, and clarification.
Primary Interviews and Surveys
Primary interviews and surveys were used to pressure-test the scope and the service mix that sits inside hard and soft FM, and then to adjust assumptions that desk sources do not explain well. We spoke with a mix of outsourced providers, in-house FM leaders, and procurement and operations respondents across major China demand centers. We then compared differences in contract form (single, bundled, and integrated), using follow-up checks to reconcile the service content before finalizing inputs.
Distribution of primary research fieldwork respondents
| Company type | Respondent position |
|---|---|
| Top tier: 28% | CXOs: 12% |
| Mid tier: 54% | Functional/Unit leaders: 28% |
| Smaller Players: 18% | Managers: 60% |
Market-Sizing & Forecasting
Sizing starts from a top-down build that reconstructs the addressable FM spend by linking China's active building and facility base to typical service intensity, then filtering that demand pool by in-house versus outsourced delivery and by contract packaging (single, bundled, and integrated). After this structure was set, we ran selective bottom-up checks using sampled provider revenues, channel checks on common contract values, and simple ASP-per-site style sanity checks, so totals could be corrected when the top-down output drifted.
A few inputs that matter a lot in this market were treated carefully, because small changes can shift the final value. These include the mix of hard services like MEP and HVAC upkeep and fire safety maintenance, the share of soft services such as cleaning and security, the outsourcing penetration by end-user type (commercial, institutional and public infrastructure, healthcare, and industrial sites), and the pace of integrated and bundled contract adoption. We also tracked wage and staffing cost trends for labor-heavy services, and energy management and compliance-driven activities that change service frequency.
Forecasting was run with scenario analysis that uses agreed ranges from primary inputs, where the higher and lower cases mainly reflect outsourcing momentum, contract bundling intensity, and labor-cost pass-through. When bottom-up information was missing for smaller cities or fragmented provider groups, we handled gaps by applying conservative service intensity bands that were validated through interviews and then rechecked against observable building activity signals.
Data Validation & Update Cycle
Validation is done through triangulation across the model layers, followed by variance checks that look for mismatches between service mix, end-user weights, and the implied spend per square meter or per site. When a line item looks too high or too low, the assumptions are reopened, and the same respondent cohort is re-contacted if the difference is material.
Before sign-off, the work is reviewed in steps by another analyst to confirm the math, the logic, and the reasonableness of growth drivers. The dataset and assumptions are refreshed on an annual cycle, and interim updates are triggered when meaningful policy shifts, outsourcing changes, or major contract practices move the market. Right before delivery, we run a final pass to make sure clients receive the most current view supported by updated signals.
Mordor Intelligence's China Facility Management Market Sizing Compared With Other Published Estimates
Published market sizes for facility management in China often appear far apart, even when the topic name seems the same. The biggest reasons usually come down to what services are counted, whether in-house activity is treated as part of the market, and how contracts are converted into a single USD value for a given year.
The main gap comes from mixing property management and broader city services into the same total. Mordor Intelligence counts facility management only when it maps to defined hard and soft FM service lines across in-house and outsourced delivery, which helps avoid inflating the value with adjacent services that are priced and procured differently.
Benchmark comparison
| Source | Market Size | Gaps in Research Methodology |
|---|---|---|
| Mordor Intelligence | USD 211.89 B (2025) | |
| Industry Consultancy A | USD 3.81 B (2024) | Uses a narrower interpretation that appears closer to organized outsourced contracts only, which can leave out in-house delivery and several hard FM lines that still represent real operating spend. |
| Industry Publication B | USD 520.00 B (2024) | Likely folds in broader property management and city service activities, and may also apply different currency timing, which can push totals far above a recurring FM-only spend definition. |
Taken together, the spread in the table is mostly explained by service scope and by whether adjacent property and urban services are added into the same bucket. Our approach keeps the total traceable by tying each service line to a defined demand pool and then checking it against contract packaging, outsourcing penetration, and cost drivers that are observable and repeatable.
Key Questions Answered in the Report
What is the forecast size of the China facility management market by 2031?
The China facility management market size is projected to reach USD 308.02 billion by 2031, reflecting a 6.42% CAGR from 2026.
Which service category is growing fastest?
Soft services—covering cleaning, security, catering, and office support—are forecast to grow at 7.18% CAGR through 2031, outpacing hard-service categories.
Why are tier-2 and tier-3 cities important for facility management providers?
These cities exhibit rapid commercial-real-estate expansion and favorable cost structures, offering early-mover advantages to providers that build local operations.
Who leads the competitive landscape?
Global players including CBRE, Cushman & Wakefield, ISS, and Sodexo hold sizeable shares, while domestic leaders like Onewo Space-Tech and China Shine compete on local networks and cost.