
Market Overview
| Study Period | 2020 - 2031 |
|---|---|
| Forecast Data Period | 2026 - 2031 |
| Base Year Market Size (2025) | USD 11.49 Billion |
| Market Size (2026) | USD 12.19 Billion |
| Market Size (2031) | USD 16.38 Billion |
| Growth Rate (2026 - 2031) | 6.10 % |
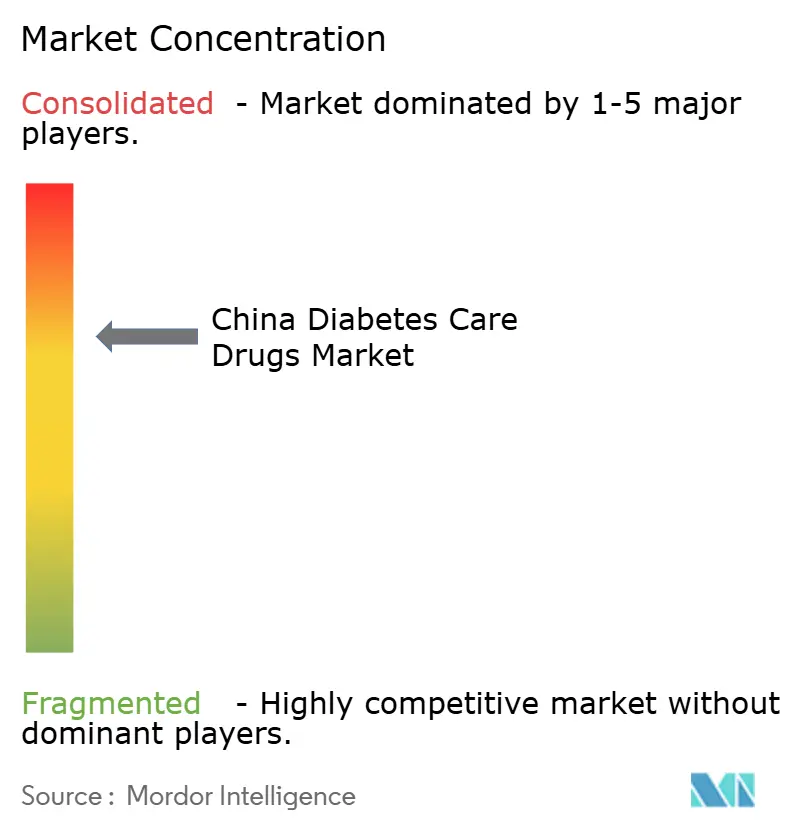
| Market Concentration | Medium |
Major Players *Disclaimer: Major Players sorted in no particular order Image © Mordor Intelligence. Reuse requires attribution under CC BY 4.0. | |
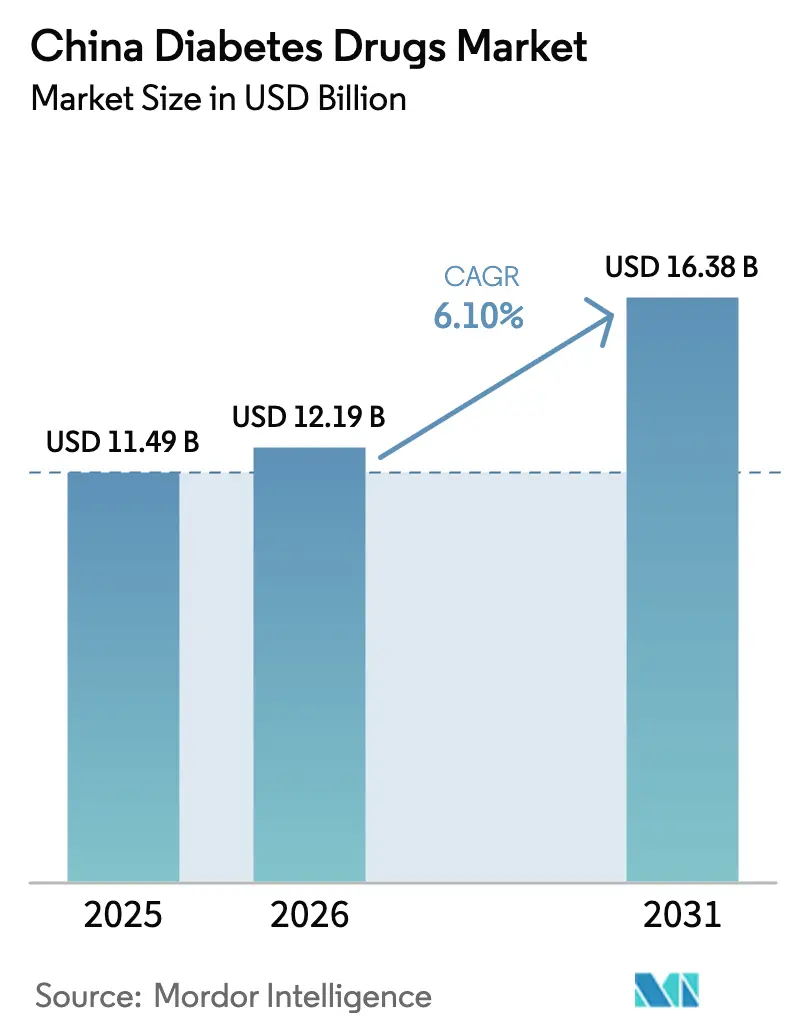
China Diabetes Drugs Market Analysis by Mordor Intelligence
China diabetes drugs market size in 2026 is estimated at USD 12.19 billion, growing from 2025 value of USD 11.49 billion with 2031 projections showing USD 16.38 billion, growing at 6.10% CAGR over 2026-2031. A confluence of population aging, rising obesity, and earlier disease onset is expanding treatment demand, while government reimbursement reforms and domestic manufacturing capacity are redefining pricing power and competitive dynamics. Rapid uptake of next-generation GLP-1 and dual-agonist therapies is eroding insulin exclusivity, and digital prescription channels are redirecting volume away from hospitals toward retail and online outlets. Venture funding in peptide CDMO facilities, coupled with a pipeline of more than fifteen semaglutide biosimilars, underscores how local cost advantages and regulatory support are shaping product launches. Multinational companies respond by in-licensing Chinese assets and investing in local plants, signaling that the China diabetes drugs market will remain a focal point for global strategy.
Key Report Takeaways
- By drug class, insulins led with 46.02% of China diabetes drugs market share in 2025, whereas non-insulin injectables are advancing at a 10.12% CAGR through 2031.
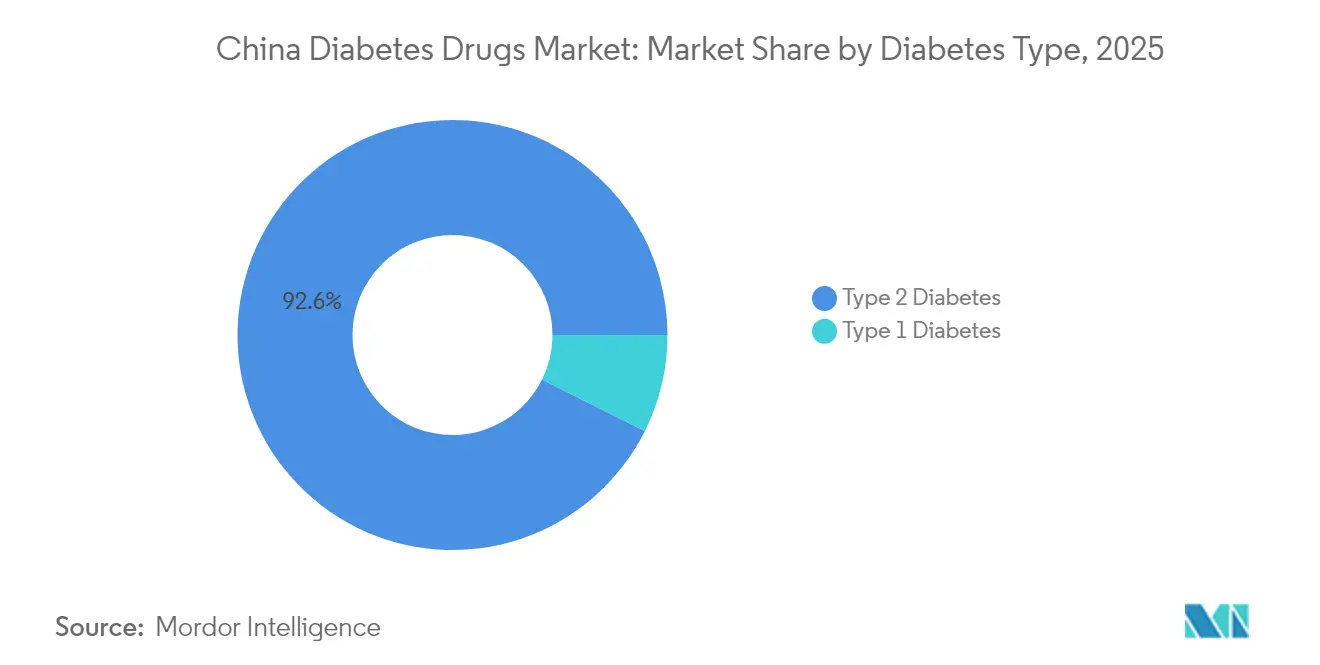
- By diabetes type, Type 2 therapies captured 92.64% of the China diabetes drugs market size in 2025 and are expanding at 7.78% CAGR to 2031.
- By drug origin, branded agents controlled 71.95% of the market in 2025, yet generics and biosimilars are growing at an 8.39% CAGR.
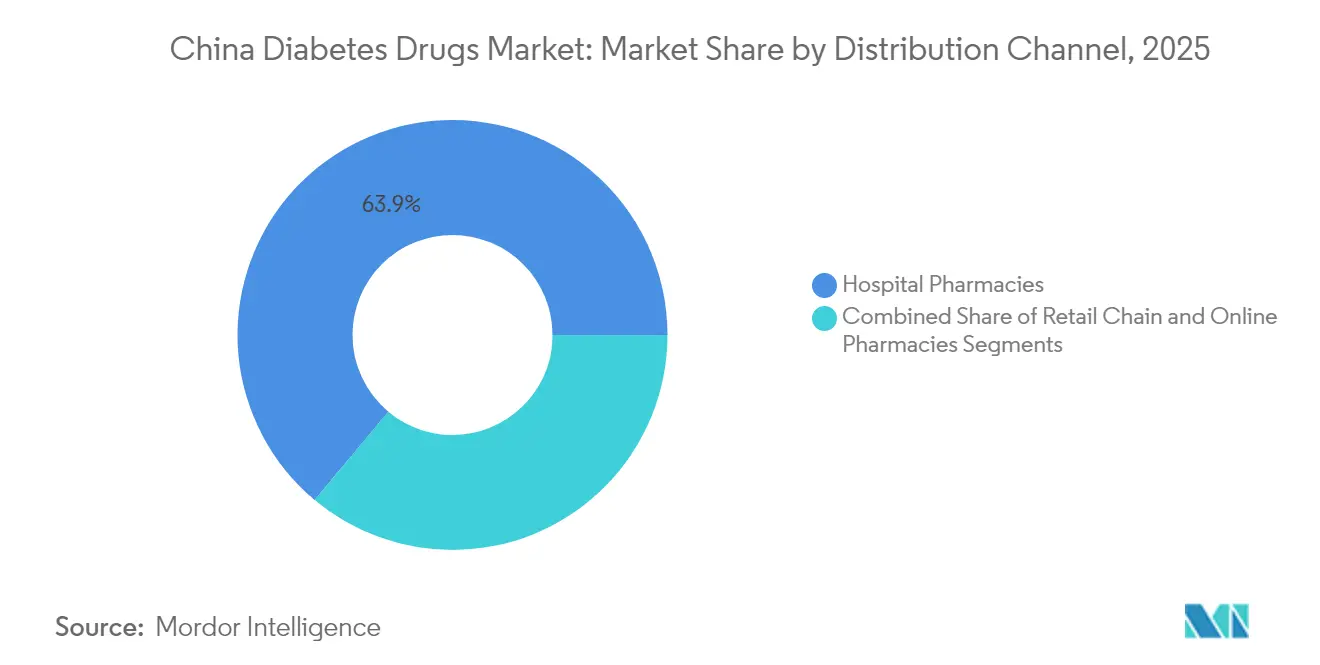
- By distribution channel, hospital pharmacies held 63.92% revenue share in 2025, while online and O2O platforms post the fastest 9.21% CAGR through 2031.
Note: Market size and forecast figures in this report are generated using Mordor Intelligence’s proprietary estimation framework, updated with the latest available data and insights as of 2026.
China Diabetes Drugs Market Trends and Insights
Drivers Impact Analysis*
| Driver | (~) % Impact on CAGR Forecast | Geographic Relevance | Impact Timeline |
|---|---|---|---|
| Rapid Rise in Diabetes prevalence & Earlier disease onset | 1.8% | National, with highest impact in urban centers Beijing, Shanghai, Tianjin | Long term (≥ 4 years) |
| Inclusion of more anti-diabetics in NRDL & volume-based procurement | 1.2% | National, with accelerated adoption in tier-2 and tier-3 cities | Medium term (2-4 years) |
| Surge in GLP-1/Tirzepatide launches and domestic biosimilars | 2.1% | National, with early adoption in major metropolitan areas | Medium term (2-4 years) |
| Hospital-to-retail prescription outflow under "dual-invoice" policy | 0.7% | National, with stronger impact in developed provinces | Short term (≤ 2 years) |
| Internet hospitals & e-pharmacy platforms boosting adherence | 0.9% | National, with higher penetration in digitally advanced regions | Medium term (2-4 years) |
| Venture & PE funding for peptide CDMO capacity in China | 0.5% | Concentrated in pharmaceutical manufacturing hubs Jiangsu, Shanghai, Guangdong | Long term (≥ 4 years) |
| Source: Mordor Intelligence | |||
Rapid rise in diabetes prevalence & earlier disease onset
Prevalence climbed to 15.88% in 2023 and could reach 29.1% by 2050 if current patterns persist.[1]Urban youth are being diagnosed earlier, extending lifetime demand for medicine and reshaping portfolio priorities toward long-term metabolic control. Beijing, Shanghai, and Tianjin report the highest incidence, yet rural enclaves are closing the gap as lifestyle and screening converge. This epidemiological swing forces firms to widen access beyond tertiary hospitals and design patient-support tools that span decades of therapy. Direct medical expenditure has already hit USD 165.3 billion, sharpening payer focus on drugs that deliver durable HbA1c control at sustainable prices.
Inclusion of more anti-diabetics in NRDL & volume-based procurement
The 2024 NRDL talks cleared 117 diabetes drugs with an 84.6% success rate, cutting median insulin prices by 42.08% and shifting share toward cost-effective brands.[2]Standardized reimbursement compresses margins for premium imports but simultaneously drives volume for listed molecules by reducing patient co-pays. Domestic manufacturers benefit disproportionately; 71% of newly listed agents originated from Chinese firms. For multinationals, survival hinges on differentiating via novel mechanisms or fixed-dose combinations that escape bulk-purchase ceilings.
Surge in GLP-1/tirzepatide launches and domestic biosimilars
Tirzepatide obtained NMPA clearance in May 2024 and entered clinics in January 2025 at CNY 1,758 per box . Semaglutide biosimilar filings from Hangzhou Jiuyuan, Boan Biotech, and others signal a rush to capture demand once patents lapse in 2026. Gan & Lee’s GZR18 reduced HbA1c by up to 2.32%, surpassing semaglutide’s 1.60% in head-to-head data. Competitive pricing and local supply chain heft are poised to redirect scripts toward domestic injectables, intensifying innovation cycles for originators.
Hospital-to-retail prescription outflow under dual-invoice policy
Uniform invoicing rules let physicians transmit electronic scripts to external dispensaries, breaking hospitals’ stranglehold on chronic-care prescriptions. Patients increasingly fill orders at chain pharmacies and online storefronts, prompting drug makers to reinforce retail relationships and invest in last-mile logistics. Provinces such as Guangdong and Zhejiang, where medical ecommerce is mature, are witnessing double-digit prescription migration rates. Manufacturers with omnichannel capability enjoy higher refill adherence and broader reach into self-pay segments supported by commercial insurance.
Restraints Impact Analysis*
| Restraint | (~) % Impact on CAGR Forecast | Geographic Relevance | Impact Timeline |
|---|---|---|---|
| Margin squeeze from successive NRDL price cuts | -1.4% | National, with stronger impact on multinational corporations | Medium term (2-4 years) |
| Intensifying safety scrutiny of long-term GLP-1 use | -0.8% | National, with heightened regulatory oversight in major cities | Long term (≥ 4 years) |
| Supply-chain bottlenecks for injectable-grade peptides | -0.6% | Concentrated in manufacturing regions, affecting global supply | Short term (≤ 2 years) |
| Physician inertia toward newer drug classes in lower-tier cities | -0.4% | Rural and lower-tier cities with limited specialist access | Long term (≥ 4 years) |
| Source: Mordor Intelligence | |||
Margin squeeze from successive NRDL price cuts
Repeated reimbursement rounds are driving a race to the bottom, with some imported agents reporting exit discussions due to unsustainable economics. Companies must localize production or innovate out of commoditization by bundling devices, apps, or combination regimens that justify premiums. Smaller firms lacking scale are prime acquisition targets as consolidation accelerates.
Intensifying safety scrutiny of long-term GLP-1 use
Reports of cholestatic hepatitis and pancreatitis have triggered extensive pharmacovigilance audits. NMPA reviewers now request larger real-world evidence packages and longer follow-up, extending time-to-market. Prescribers likewise temper enthusiasm, reserving powerful dual agonists for patients with lower cardiovascular or hepatic risk.
*Our forecasts treat driver/restraint impacts as directional, not additive. The impact forecasts reflect baseline growth, mix effects, and variable interactions.
Segment Analysis
By Drug Class: Non-insulin Injectables Drive Innovation
Non-insulin injectables account for 31.34% of 2025 revenue yet deliver the fastest 10.12% CAGR, reflecting strong payor acceptance once NRDL listing is secured. Insulin still holds the largest 46.02% slice of the China diabetes drugs market share, but its single-digit volume growth contrasts sharply with double-digit uptake of GLP-1 and dual agonists. Tirzepatide’s CNY 1,758 pricing undercuts earlier GLP-1 agents while showing over 20% weight loss efficacy, positioning it for rapid formulary wins. Oral DPP-4 inhibitors and SGLT-2 agents remain important entry therapies, often combined with GLP-1 injectables in advanced cases. Peptide capacity expansions by WuXi STA and Aurisco enable domestic suppliers to lower fill-finish costs, reinforcing competitiveness. Combination pens that co-formulate basal insulin with GLP-1 analogues are entering trials, promising simplified regimens and extended patent life. Because most new biologic approvals originate locally, domestic firms now own significant leverage during NRDL negotiations.
Sequential innovation is shifting clinical practice away from glycemic control alone toward holistic metabolic improvement. Many endocrinologists now start overweight patients on GLP-1 injectables earlier, a practice that could widen the China diabetes drugs market size for non-insulin products by an extra USD 2.62 billion through 2031. Meanwhile, insulin makers reposition ultra-rapid and time-in-range advantages to defend share. The pivot places pressure on production lines to flex between human insulin, analogues, and incretin mimetics to balance risk and sustain utilization.


By Diabetes Type: Type 2 Dominance Intensifies
Type 2 therapies generate 92.64% of 2025 sales and are forecast to expand at a 7.78% CAGR. Younger onset and higher obesity rates extend lifetime drug use, meaning even marginal improvements in adherence translate into substantial incremental revenue. Type 1 patients, though fewer, require complex multi-dose daily regimens and continuous glucose monitoring, fostering demand for sensor-integrated insulin delivery systems. Tonghua Dongbao’s CNY 350 million insulin plant upgrade aims to secure domestic supply for both groups, hedging against import disruptions.
Polypharmacy is common: peripheral neuropathy sufferers consume an average of 4.7 active agents versus 3.77 for uncomplicated patients.Add-on antiplatelet and lipid-lowering drugs often come from the same manufacturers, giving them cross-selling advantages. As complication management rises in profile, companies that bundle cardiometabolic solutions around GLP-1 anchors will broaden their footprint within the China diabetes drugs market. Population-scale remote monitoring pilots in Shanghai suggest HbA1c can be trimmed 0.45% when tele-coaching is offered, improving outcomes for both Type 2 and insulin-dependent cohorts.
By Drug Origin: Biosimilar Momentum Builds
Branded drugs still command 71.95% of spending, yet their volume edge is eroding as biosimilar pipelines mature. The segment holding the largest China diabetes drugs market size is forecast to cede 8-10 percentage points to generics by 2031, especially after semaglutide patents expire. Hangzhou Jiuyuan’s first-to-file semaglutide biosimilar and Boan’s dulaglutide copycat highlight aggressive timelines. Gan & Lee’s GZR18 Phase III win over Ozempic catalyzed investor confidence, and the drug is now positioned for NRDL entry in the 2026 cycle.
Pricing pressure accelerates brand erosion; median discounts for biosimilar insulins sit at 35%, while GLP-1 copies are expected to launch 20–30% below innovator tags. To defend value, originators emphasize device convenience (auto-retracting needles, smaller volumes), real-world cardiovascular data, and potential obesity co-indications. Domestic contenders exploit short supply chains to guarantee stock during NRDL rollouts, securing prescriber trust and patient loyalty. Over time, biosimilar penetration will widen formulary breadth but compress the revenue curve, compelling the China diabetes drugs industry to pivot toward first-in-class assets.
By Distribution Channel: Digital Transformation Accelerates
Hospital pharmacies accounted for 63.92% of 2025 turnover, yet the dual-invoice system and electronic prescription law are enabling retail and online sectors to grow at 9.21% CAGR. In pilot provinces, up to 40% of repeat scripts for GLP-1 analogues are now filled through e-pharmacy platforms that deliver next-day nationwide. Chain pharmacies strengthen their bargaining power by integrating telehealth booths, allowing onsite video consults that convert immediately into pharmacy sales.
Online traffic spikes when new drugs launch but remain excluded from public insurance; self-pay patients often discover products through social media, then purchase via cross-border channels until domestic supply stabilizes. Commercial insurers seize the gap by adding high-profile obesity-adjacent drugs to rider packages, fueling retail volume. For manufacturers, omnichannel success requires coordinated sample distribution, KOL livestreams, and AI-driven adherence reminders. As these elements synchronize, the China diabetes drugs market size derived from non-hospital channels could double from today’s USD 4.15 billion baseline by 2031.
Geography Analysis
Tier-1 municipalities—Beijing, Shanghai, and Tianjin—concentrate one-quarter of national spending, driven by higher disposable income and early adoption of injectables. Provincial bulk procurement equalizes list prices, but hospital formularies in wealthier regions still prioritize novel agents, lifting penetration rates. The eastern seaboard’s digital maturity fosters heavy use of internet hospitals, where up to 60% of follow-up insulin titrations occur virtually. Central and western provinces lag in endocrinologist density, translating into slower uptake of GLP-1 drugs; however, improved 4G coverage and lower device prices are narrowing the gap.
Manufacturing hubs in Jiangsu, Shanghai, and Guangdong give local firms logistical advantages, including reduced cold-chain transit times. Eli Lilly’s USD 212 million Suzhou upgrade and Sanofi’s EUR 1 billion Beijing insulin plant reflect a strategic pivot to “in-China-for-China” production that hedges against geopolitical shocks. API bottlenecks in inland Sichuan briefly constrained peptide yields in 2024, highlighting the need for multi-site redundancy.
Reimbursement pilots differ by region: Zhejiang tests outcome-based contracts that withhold 5% of payment until HbA1c goals are met, whereas Hainan’s Free Trade Port permits accelerated importation of unapproved foreign drugs under medical tourism schemes. These heterogeneities compel marketers to segment launch strategies by province, tailoring educational outreach to local prescriber norms.
Regulatory Landscape
China diabetes drug approvals and lifecycle oversight are handled by the National Medical Products Administration (NMPA), while pricing and access are influenced by the National Healthcare Security Administration (NHSA) through NRDL negotiations and volume-based procurement. The Implementing Regulations of the Drug Administration Law (2026 revisions) were issued on Jan 27, 2026 and took effect May 15, 2026, which reinforces special regulatory pathways (priority review, conditional approval, breakthrough therapy) that matter for first-in-class incretins and longer-acting insulins.
Market access increasingly centers on reimbursement and evidence. In 2026, NHSA advanced a dual-track catalog approach, combining the Basic NRDL with a Commercial Health Insurance Innovative Drug Catalog, and published preliminary results during the year, creating an added route for higher-cost innovative therapies outside standard NRDL price discipline. NMPA also operationalized faster clinical development tools, including a 30-day clinical trial application (IND) mechanism for eligible innovative drugs, and tightened expectations for real-world evidence and pharmacovigilance, which aligns with the heightened safety scrutiny for long-term GLP-1 use noted in the market context.
Value Chain Analysis
The China diabetes drugs value chain runs from discovery and clinical development, to regulatory filing, API and peptide synthesis (for GLP-1 and other injectables), and then drug product manufacturing and fill-finish, including devices for pen injectors. After cold-chain and national distribution, volumes reach patients through hospital pharmacies, retail chains, and online/O2O platforms supported by e-prescriptions. NHSA reimbursement placement through NRDL and related catalog pathways remains the main commercialization gate, with procurement and tendering translating listing status into volume shifts.
Manufacturing localization is a key lever for cost, supply assurance, and tender competitiveness, especially for injectable peptides and delivery devices. Eli Lilly’s USD 3 billion China investment plan is tied to local manufacturing, including oral solid dosage capabilities in Beijing and expansion in Suzhou. Novo Nordisk disclosed an expansion of its Tianjin production base with a CNY 200 million investment in June 2026. These moves reinforce in-China production footprints, reduce lead times for chronic therapies, and support scale-up for newer modalities such as GLP-1 and combination products as procurement and reimbursement compress unit prices.
Competitive Landscape
Competition is moderate but trending toward fragmentation. The top five manufacturers controlled about 48% of 2024 revenue, down from 53% three years earlier. Gan & Lee secured the second-highest insulin tender share by aligning pricing with NRDL ceilings while delivering clinical data superior to imported analogues. United Laboratories licensed UBT251, a triple receptor agonist, to Novo Nordisk for USD 2 billion, showing how domestic innovation is drawing global capital.
Multinationals still dominate R&D pipelines but are partnering locally to de-risk. Merck’s USD 2 billion pact with Hansoh Pharma grants co-development rights for an oral GLP-1 compound that leverages Hansoh’s Haimen plant for end-stage production. Meanwhile, Chinese CDMOs scale up peptide synthesis that supports both branded and biosimilar launches.
Strategic focus is pivoting from standalone drug efficacy to service-oriented ecosystems. Companies bundle glucose meters, apps, and nutritional counseling to differentiate products facing price ceilings. Venture-backed start-ups explore microneedle patches and once-monthly injectables, aiming to leapfrog current weekly standards. Patent cliffs, cost containment, and fast-track regulatory pathways ensure that out-licensing, M&A, and co-marketing deals will remain frequent as firms jockey for share within the China diabetes drugs market.
China Diabetes Drugs Industry Leaders
-
Eli Lilly
-
Sanofi
-
Novo Nordisk
-
Gan & Lee
-
Tonghua Dongbao
- *Disclaimer: Major Players sorted in no particular order
Market Opportunities and Future Outlook
Differentiation opportunities are growing for therapies and services that can hold up under NRDL price pressure, especially in next-generation injectables and fixed-dose combinations that simplify regimens and improve adherence. The 2026 NHSA dual-track approach, pairing the Basic NRDL with a Commercial Health Insurance Innovative Drug Catalog, adds a pathway where commercial reimbursement can absorb part of the affordability burden for higher-cost innovations. This structure creates more room for differentiated GLP-1 and combination products, while broader NRDL negotiations continue to set benchmark pricing.
Supply-side localization and first-launch strategies also open specific execution areas. In June 2026, Novo Nordisk used China for the global first commercial launch of Kyinsu (insulin icodec/semaglutide), pointing to China as an early commercialization venue for novel combination therapies rather than a follow-on market. Announced manufacturing investments, including Eli Lilly’s USD 3 billion plan and Novo Nordisk’s CNY 200 million Tianjin expansion, support faster local availability and strengthen resilience against injectable-grade peptide bottlenecks highlighted in the report context. For domestic players, advancing weekly basal insulin candidates and semaglutide biosimilar programs aligns with the observed shift from insulin dominance toward newer injectables, and it strengthens position in province-level tenders where localized supply and price terms drive outcomes.
Recent Industry Developments
- June 2026: Gan & Lee Pharmaceuticals reported positive results from the Phase III SUPER-3 clinical trial for its ultra-long-acting once-weekly basal insulin analog, Insulin Ludefen (GZR4), in China. The development strengthens domestic insulin leadership and may influence pricing and NRDL considerations.
- June 2026: Novo Nordisk announced the global first commercial launch of Kyinsu (insulin icodec + semaglutide) in China for adults with type 2 diabetes. The launch expands high-value combination therapy options and could enhance NRDL negotiation leverage in China.
- March 2026: Novo Nordisk received NMPA approval for Kyinsu (insulin icodec/semaglutide) for type 2 diabetes. The approval supports rapid scale-up and competitive differentiation against monotherapies and rivals.
Research Methodology Framework and Report Scope
Market Definition and Coverage
This market covers the value of prescription therapies used to manage diabetes in China, captured as manufacturer level revenue and then mapped across the main demand channels used by patients.
Scope exclusions: We exclude diabetes devices, diagnostics, and purely wellness supplements that are not used as regulated drug therapy.
Segmentation Overview
- By Drug Class
- Insulins
- Oral Anti-diabetic Drugs
- Non-Insulin Injectables (GLP-1, Amylin, GIP/GLP-1)
- Combination Drugs
- By Diabetes Type
- Type 1 Diabetes
- Type 2 Diabetes
- By Drug Origin
- Branded
- Generic / Biosimilar
- By Distribution Channel
- Hospital Pharmacies
- Retail Chain Pharmacies
- Online Pharmacies & O2O Platforms
Data Sources, Market Sizing, and Validation
Desk Research
Desk research is used to set the starting structure for the model and to make sure the demand story fits China specific realities, including treatment pathways, access rules, and pricing controls. We typically review public disease burden and treatment context from sources such as the International Diabetes Federation (IDF), the World Health Organization (WHO), and peer-reviewed articles indexed on PubMed.
For policy and supply-side checks, we refer to sources such as China NMPA announcements, National Healthcare Security Administration (NHSA) reimbursement and procurement releases, and China customs trade statistics for pharmaceutical products where relevant. We also use company annual reports, regulatory filings, investor presentations, and reputable news coverage, and then we complement gaps using paid subscriptions for company financials and intelligence, patents, and shipment-level import or export signals when needed. These desk sources are illustrative only, and we also reviewed other public datasets and documents to collect data, validate assumptions, and clarify open questions.
Primary Interviews and Surveys
Primary work is used to stress test the desk inputs and convert them into sizing assumptions that match how diabetes drugs are actually prescribed, stocked, and paid for in China. We speak with a mix of stakeholders such as clinicians, hospital pharmacy and procurement teams, distributors, retail and online channel participants, and industry experts who track therapy adoption, tender outcomes, and price erosion.
Coverage is built to include different parts of China and different patient access settings, so assumptions on channel split, branded versus generic or biosimilar uptake, and therapy switching can be validated and then applied consistently in the model.
Distribution of primary research fieldwork respondents
| Company type | Respondent position |
|---|---|
| Top tier: 34% | CXOs: 12% |
| Mid tier: 51% | Functional/Unit leaders: 28% |
| Smaller Players: 15% | Managers: 60% |
Market-Sizing & Forecasting
Market size is built using a top-down and bottom-up combination. We reconstruct the treated demand pool in China from diabetes prevalence signals, diagnosis and treatment rates, and the therapy mix used in routine care. Those demand pools are then converted into value by applying class-level pricing and access realities that can be observed through reimbursement changes and procurement outcomes.
To make sure totals do not drift away from real-world sales, results are corroborated with selective bottom-up approximations, such as sampled volume and price checks for key therapy classes and distribution channel splits, followed by adjustments where the implied per patient spend looks inconsistent. The variables most often used as practical inputs include the Type 2 share in the treated cohort, insulin versus non-insulin mix, uptake speed for GLP-1 and other newer injectables, tender-driven price resets, and channel migration from hospital to retail and online.
Forecasting is done using scenario analysis supported by expert views on policy direction and the pace of switching to newer classes, and then translated into class-wise growth paths that roll up to the total market. Where clean roll-ups are not possible for smaller classes or newer launches, we apply conservative proxy assumptions anchored to observed adoption curves and then validate them again through follow-up expert checks.
Data Validation & Update Cycle
Outputs are validated through triangulation across independent signals, including demand-pool logic, pricing change events, and channel behavior. We then review for unusual jumps that do not match policy timing or therapy adoption patterns. We also run variance checks across historical years to keep the implied growth rate consistent with known tender cycles and the pace of reimbursement expansion.
Before sign-off, the model and assumptions go through more than one analyst review, and respondents are re-contacted when a major number looks directionally off or when new policy announcements can change pricing. Reports are refreshed annually, with interim updates when material events occur, and a final pre-delivery pass is completed so clients receive the latest updated view.
Mordor Intelligence's China Diabetes Drugs Market Sizing Compared With Other Published Estimates
Published market numbers for China diabetes drugs often do not match because authors count different channels, apply different currency timing, or mix patient spending with manufacturer revenue. We keep assumptions explicit so readers can follow how demand, price, and access translate into a final value.
Some external estimates are built mainly from hospital terminal sales, which commonly leaves out retail pharmacies and online fulfillment and can also reflect procurement price cuts faster than volume expansion. The main difference is that Mordor Intelligence counts diabetes drug value across hospital, retail, and online channels and keeps devices and diagnostics excluded, which lifts the total versus hospital-only sales series.
Benchmark comparison
| Source | Market Size | Gaps in Research Methodology |
|---|---|---|
| Mordor Intelligence | USD 12.19 B (2026) | |
| Industry Media Database A | USD 7.80 B (2024) | This figure is presented as hospital terminal sales value (in local currency), which can understate totals when retail pharmacies and online drug channels are not included, and it can move faster after tenders due to immediate price resets. |
| Industry Research Portal B | USD 6.40 B (2022) | This estimate is framed as combined hospital and drugstore sales revenue and is for an earlier year, and it can differ based on which therapies are counted as diabetes drugs, how combination products are treated, and the currency conversion timing used. |
The spread in the table is mostly explained by channel coverage and by whether values represent hospital-only sales, mixed retail sales, or total drug value across channels. Year selection and currency timing add further variation. By tying assumptions to a treated patient pool, therapy mix shifts, and tender-related price changes, our process stays repeatable and transparent even when public sales series are incomplete.
Key Questions Answered in the Report
What is the current value of the China diabetes drugs market?
The market is valued at USD 12.19 billion in 2026 and is projected to reach USD 16.38 billion by 2031.
Which drug class is growing fastest in China?
Non-insulin injectables, led by GLP-1 and dual-agonist therapies, are expanding at a 10.12% CAGR to 2031.
How significant is Type 2 diabetes in market demand?
Type 2 therapies make up 92.64% of 2025 revenue and are growing at 7.78% CAGR, reflecting earlier onset and rising obesity.
How are NRDL policies affecting drug prices?
Volume-based procurement linked to the NRDL cut median insulin prices by 42.08%, squeezing margins but boosting access.
Why are biosimilars gaining traction?
Patent expirations and expanded peptide manufacturing capacity are enabling domestic biosimilar launches at discounts of 20–35%, eroding branded share.
What role do online pharmacies play?
Hospital volumes still dominate, but e-pharmacy and O2O channels are growing at 9.21% CAGR as electronic prescriptions and retail insurance coverage expand.