
Market Overview
| Study Period | 2020 - 2031 |
|---|---|
| Forecast Data Period | 2026 - 2031 |
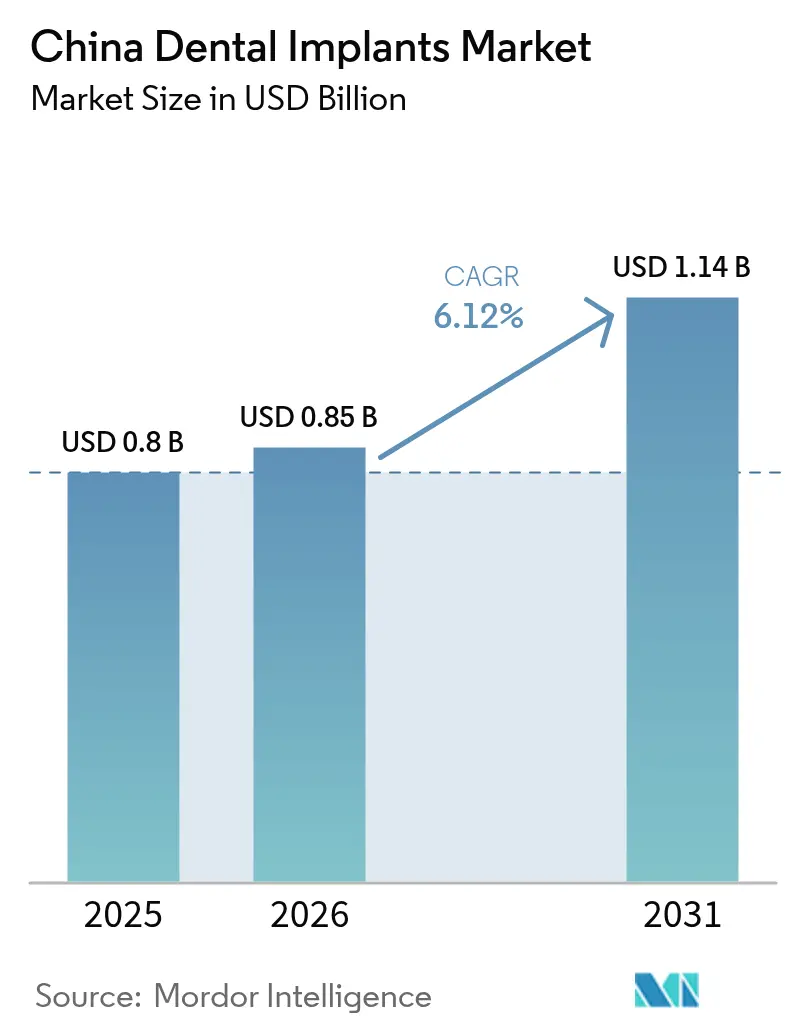
| Base Year Market Size (2025) | USD 0.80 Billion |
| Market Size (2026) | USD 0.85 Billion |
| Market Size (2031) | USD 1.14 Billion |
| Growth Rate (2026 - 2031) | 6.12 % |
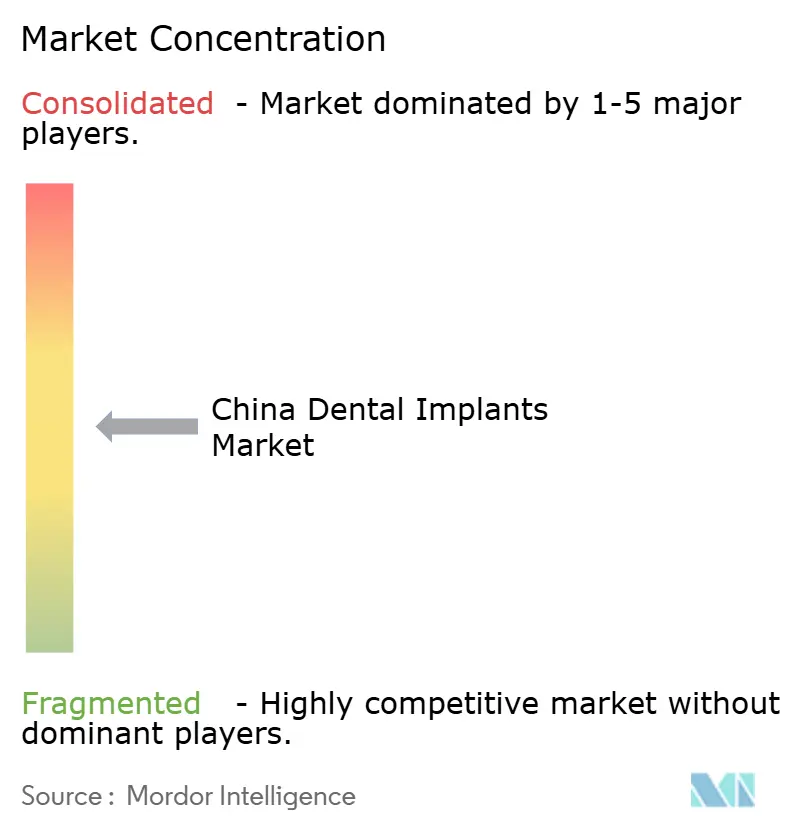
| Market Concentration | Medium |
Major Players *Disclaimer: Major Players sorted in no particular order Image © Mordor Intelligence. Reuse requires attribution under CC BY 4.0. | |
China Dental Implants Market Analysis by Mordor Intelligence
The China dental implants market size is expected to grow from USD 0.80 billion in 2025 to USD 0.85 billion in 2026 and is forecast to reach USD 1.14 billion by 2031 at 6.12% CAGR over 2026-2031. Continued gains stem from the government’s Volume-Based Procurement (VBP) program, demographic aging, and rapid adoption of digital workflows. Although VBP has pushed average implant system prices down by more than 20%, the policy has enlarged overall procedure volumes by broadening affordability. The titanium segment continues to anchor demand, while zirconium’s superior esthetics positions it as the fastest-rising alternative. Robust private-clinic expansion, inbound dental tourism to the Greater Bay Area, and growing reimbursement pilots in Tier-1 cities are widening patient access. Conversely, persistent urban-rural infrastructure gaps and limited insurance coverage restrain penetration in lower-tier regions.
Key Report Takeaways
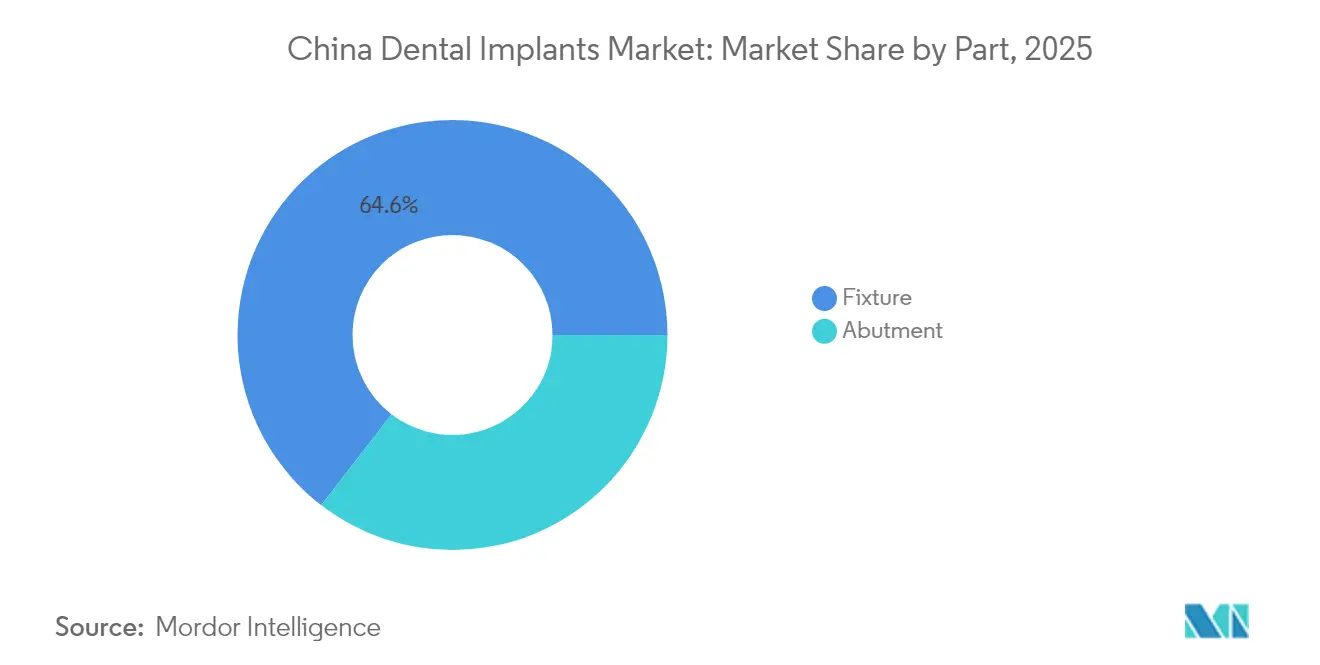
- By part, fixtures led with 64.55% of the China dental implants market share in 2025, while abutments are forecast to expand at a 9.86% CAGR through 2031.
- By material, titanium captured 74.35% revenue share in 2025; zirconium is projected to grow at a 12.12% CAGR to 2031.
- By implant type, endosteal implants accounted for an 87.40% share of the China dental implants market size in 2025 and are set to grow at 5.86% CAGR through 2031.
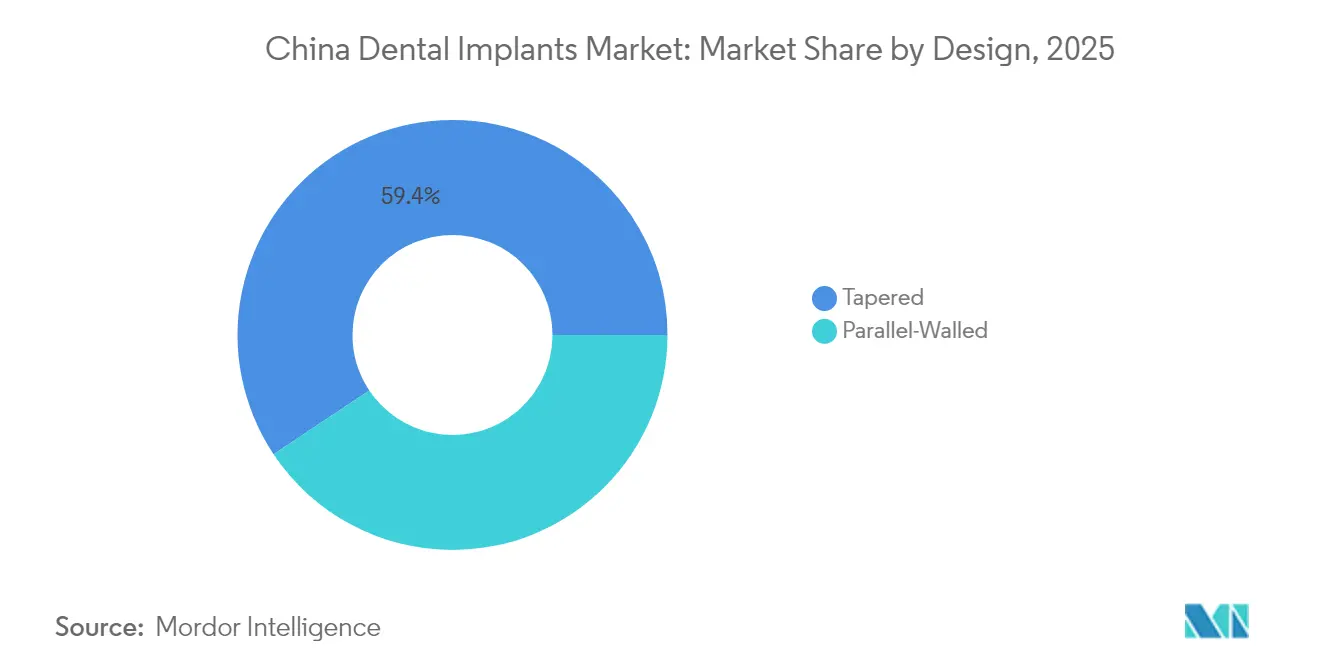
- By design, tapered implants dominated with 59.35% share in 2025, while parallel-walled designs are advancing at an 8.52% CAGR to 2031.
- By procedure, two-stage protocols held 69.25% of the China dental implants market in 2025; single-stage methods record the highest projected CAGR at 12.18% through 2031.
- By end-user, dental clinics commanded 67.35% revenue share in 2025, while hospitals are forecast to expand at an 11.28% CAGR to 2031.
Note: Market size and forecast figures in this report are generated using Mordor Intelligence’s proprietary estimation framework, updated with the latest available data and insights as of 2026.
China Dental Implants Market Trends and Insights
Drivers Impact Analysis*
| Driver | (~) % Impact on CAGR Forecast | Geographic Relevance | Impact Timeline |
|---|---|---|---|
| Rapidly Growing Geriatric & Edentulous Population | +1.8% | National, with concentration in Eastern provinces | Long term (≥ 4 years) |
| Government Oral-Health Policies and Reimbursement Pathways | +1.5% | National, with initial impact in Tier-1 cities | Medium term (2-4 years) |
| Continuous Advances in Implant Materials & Digital Dentistry | +1.0% | Urban centers, particularly Beijing, Shanghai, Guangzhou | Medium term (2-4 years) |
| Rising Disposable Incomes and Heightened Aesthetic Awareness | +0.8% | Urban centers, particularly Tier-1 and Tier-2 cities | Medium term (2-4 years) |
| Inbound Medical Tourism to Greater Bay Area | +0.6% | Greater Bay Area (Shenzhen, Guangzhou) | Short term (≤ 2 years) |
| Expansion of Private Multi-Site Dental Chains into Tier-2/3 Cities | +0.7% | Tier-2 and Tier-3 cities, particularly in Eastern and Central China | Medium term (2-4 years) |
| Source: Mordor Intelligence | |||
Rapidly Growing Geriatric & Edentulous Population in China
Edentulism is projected to affect 130.23 million Chinese residents by 2050, representing nearly one-fifth of the global burden. Older adults with fewer than 10 teeth face higher odds of frailty and malnutrition; Chinese cohort studies link edentulism to a 20% rise in all-cause mortality. Dental implants therefore address both functional and systemic health risks, elevating their perceived value among clinicians. Eastern provinces with higher life expectancy show the greatest concentration of demand. Public health messaging that positions oral rehabilitation as part of healthy aging is further reinforcing long-term volume growth.
Government Oral-Health Policies and Emerging Reimbursement Pathways
VBP price ceilings cut system costs yet stimulate procedures as more hospitals and private clinics participate. Parallel initiatives under “Healthy China 2030” encourage local pilots that subsidize dentures or crowns for low-income seniors. While national insurance still excludes most restorative fees, city-level reimbursement pilots are narrowing the gap, especially in Shanghai and Shenzhen.
Continuous Advances in Implant Materials, Surface Coatings & Digital Dentistry
Research on β-type titanium alloys and zirconia-calcium silicate composites is enhancing osseointegration, corrosion resistance, and esthetics. Adoption of intraoral scanners, CBCT-guided planning, and AI-driven case presentation has improved treatment acceptance by more than 20% in leading clinics[1]Planet DDS, “2025 Dental Industry Outlook,” planetdds.com. Three NMPA-cleared robotic systems—Yakebot, Remebot, and Theta—demonstrate placement accuracy within 1.0 mm coronal deviation, reducing chairside time and postoperative morbidity. These technologies appeal to digitally fluent practitioners, accelerating migration toward single-stage and immediate-load protocols.
Rising Disposable Incomes and Heightened Aesthetic Awareness
Urban household disposable income rose 5.2% year-on-year in 2025, encouraging patients to choose premium zirconium solutions despite higher fees[2]Elos Medtech, “Why China Is a Lucrative Market for Dental Implant Manufacturers,” elosmedtech.com. Social media influencers and cosmetic dentistry campaigns have heightened demand for metal-free restorations. Clinics are responding by bundling whitening and implant packages, further lifting per-patient revenue. Enhanced esthetics is also boosting uptake among younger adults seeking preventive extraction and immediate replacement.
Restraints Impact Analysis*
| Restraint | (~) % Impact on CAGR Forecast | Geographic Relevance | Impact Timeline |
|---|---|---|---|
| Persistently High Out-of-Pocket Costs Despite VBP | -1.2% | National, with greater impact in lower-tier cities | Medium term (2-4 years) |
| Limited Clinical Infrastructure in Rural Provinces | -1.0% | Rural provinces, particularly Western and Central regions | Long term (≥ 4 years) |
| Lengthy and Stringent NMPA Regulatory Approval | -0.8% | National, affecting all manufacturers and distributors | Long term (≥ 4 years) |
| Low Post-Surgery Follow-Up Compliance | -0.6% | National, with higher impact in rural and lower-tier cities | Short term (≤ 2 years) |
| Source: Mordor Intelligence | |||
Persistently High Out-of-Pocket Costs Despite VBP Price Caps
VBP sets a CNY 4,500 ceiling for a single implant system in public hospitals, yet total treatment costs remain high once surgical and prosthetic fees are included. Limited insurance reimbursement forces patients to self-finance, discouraging uptake among lower-income groups. Comparative data from South Korea show implant usage rose 60.5% after broader senior coverage, illustrating the potential lift if China’s social insurance expands benefits. Without similar reforms, procedure growth may taper in lower-tier cities.
Limited Clinical Infrastructure & Implant Penetration in Rural Provinces
Only 51.12% of rural edentulous patients use dentures versus 67.05% in urban areas, signaling sharp access gaps. Shortage of implant-trained dentists in western provinces leads to long travel times and additional lodging costs, further dampening demand. Provincial disparities are stark: Liaoning reports 81.36% denture use while Hunan posts just 21.91%[3]Interactive Journal of Medical Research, “Denture Use Between Urban and Rural Older Individuals,” i-jmr.org. Public–private partnerships that fund mobile clinics and tele-mentoring platforms are critical to extend specialty services beyond metropolitan hubs.
*Our forecasts treat driver/restraint impacts as directional, not additive. The impact forecasts reflect baseline growth, mix effects, and variable interactions.
Segment Analysis
By Part: Fixtures Anchor Value Creation While Abutments Accelerate
Fixtures contributed the majority of the China dental implants market in 2025, generating 64.55% of sector revenue amid high procedure counts and their pivotal role in osseointegration. Manufacturers refine micro-roughened and HA-coated surfaces to shorten healing periods, catering to aging patients with reduced bone density. Domestic producers have cut lead times by localizing titanium billet sourcing, augmenting cost advantages created by VBP.
Abutments represent a smaller but faster-growing share, forecast to rise at 9.86% CAGR through 2031. CAD/CAM platforms now deliver patient-specific zirconia abutments within 48 hours, improving soft-tissue contours and esthetics. As VBP lowers fixture costs, clinics redirect savings toward customized prosthetic components, propelling abutment upgrades.


By Material: Titanium Holds Dominance as Zirconium Gains Momentum
Titanium implants delivered 74.35% of the China dental implants market share in 2025, upheld by well-documented biocompatibility and mechanical resilience. Research on low-modulus β-type alloys promises to lessen peri-implant stress shielding without compromising strength. Local foundries have increased output by 12% to meet growing fixture demand, shielding pricing against nickel-titanium alloy volatility.
Zirconium volumes are set to grow 12.12% CAGR on rising esthetic preferences and improved fracture resistance through doped composite matrices. High translucency makes zirconia favored for anterior restorations, and VBP tender rounds now include ceramic systems, which will accelerate hospital adoption.
By Implant Type: Endosteal Leadership Amid Specialized Alternatives
Endosteal units account for 87.40% of 2025 placements, favored for long-term evidence and wide implant-diameter choices. Broader availability of short implants expands eligibility for brittle bone cases, reducing need for grafting.
Subperiosteal devices, projected at 9.18% CAGR, increasingly serve elderly patients with severe mandibular atrophy. 3D-printed custom frames optimized from CBCT datasets minimize periosteal stripping and postoperative discomfort. Transosteal and intramucosal options remain niche, reserved for extreme resorption or prosthesis retention scenarios.
By Design: Tapered Implants Sustain Preference with Parallel Variants Evolving
Tapered implants delivered 59.35% of 2025 revenues, prized for primary stability in immediate-placement sockets and minimal bone compression. Cone-morse connections further mitigate micro-movement, supporting immediate provisionalization trends.
Parallel-walled designs grow at 8.52% CAGR as thread-depth optimization enhances engagement in dense posterior bone. Universities report equivalent five-year survival between designs, prompting clinicians to base selection on site anatomy rather than brand tradition.
By Procedure: Two-Stage Approaches Remain Predominant as Single-Stage Adoption Quickens
The two-stage method captured 69.25% of 2025 placements, underscoring clinician caution in complex grafted sites. Healing-abutment use allows transmucosal soft-tissue maturation prior to loading.
Single-stage procedures, advancing 12.18% CAGR, benefit from stronger primary torque and antimicrobial hydrophilic surfaces. Randomized trials show robotic-guided immediate implants achieve coronal deviations of 1.04 mm and comparable six-month survival to delayed counterparts. Patient demand for fewer surgical visits is heightening adoption in private clinics competing on chair-time efficiency.
By End-User: Clinics Preserve Leadership, Hospitals Scale Integrated Care
Dental clinics accounted for 67.35% of procedures in 2025, driven by flexible scheduling and aggressive marketing campaigns showcasing digital implant suites. Inclusion of private clinics in VBP tenders enables bulk purchasing, cutting fixture procurement costs by 25% and enhancing margins through higher patient throughput.
Hospitals, projected to expand 11.28% CAGR, increasingly offer multidisciplinary implant centers managing systemic comorbidities. Government hospitals leverage broader reimbursement pilots that bundle implant surgery with chronic-disease management, attracting aging diabetic patients who require closer peri-operative monitoring.
Geography Analysis
Eastern coastal provinces dominate placement volumes owing to higher dentist density and disposable income levels. Shanghai and Zhejiang collectively accounted for more than one-quarter of 2024 surgeries, and reimbursement pilots in those provinces shorten patient payback periods. The China dental implants market size in the East is set to grow as clinics add additional operatories and adopt robot-guided placement for immediate-load cases.
Central provinces, including Henan and Hubei, represent the fastest-growing geography, buoyed by private chain expansion and provincial funding for geriatric oral health. Clinics leverage tele-consultation links with Tier-1 specialists to supervise complex cases remotely, narrowing the expertise gap. Government subsidies for community implant outreach days have doubled annual case volumes in select county hospitals.
Western and far-north regions remain underpenetrated, performing fewer than 10 surgeries per 100,000 population. Limited specialist density and longer travel distances hinder uptake. Provincial authorities are piloting mobile surgical units equipped with CBCT and chairside milling stations to conduct weekend implant camps.
Regulatory Landscape
China dental implants are regulated as Class III medical devices under the National Medical Products Administration (NMPA) and its Center for Medical Device Evaluation (CMDE), with market access determined by registration requirements and centralized purchasing rules. In parallel, the National Healthcare Security Administration (NHSA) continues to set prices for implant-related services and consumables under its dental implant price-governance framework, which in many jurisdictions guides single-tooth implantation service fees in tertiary public hospitals toward a CNY 4,500 cap and requires procurement compliance such as zero-markup handling for covered items.
In 2026, standards and compliance requirements tightened for advanced manufacturing and customized components. The China Medical Device Industry Association (CAMDI) published and implemented T/CAMDI 044-2026 for additively manufactured metal dental implants on January 6, 2026, providing a clearer technical baseline for 3D-printed implant products. The NMPA also issued its 2026 Medical Device Guidelines Revisions Plan on April 27, 2026, covering device categories that include dental abutments and customized abutment crown bridges, while the revised Good Manufacturing Practice (GMP) for Medical Devices announced in late 2025 (Announcement No. 107) takes effect on November 1, 2026, raising quality-system expectations for manufacturers and contract producers serving the dental implant supply chain.
Competitive Landscape
International manufacturers maintain leading brand recognition, yet domestic firms are closing the gap through VBP wins and localized service networks. Osstem and Dentium exploit proximity advantages, offering sub-USD 500 titanium fixtures that meet VBP caps while preserving double-digit margins. Osstem forecasts 19% China revenue growth in 2025 after reopening of education centers that train 3,000 dentists annually.
Straumann’s Chinese subsidiary recently introduced a bundled digital workflow suite integrating implant planning software and in-house milling units, seeking differentiation beyond price. The company also established a partnership with Alibaba Health to power cloud-based case tracking, adding data analytics to clinician dashboards.
Domestic firms such as Shenzhen Chirimen Technology deliver zirconia abutments priced 30% below imports, gaining share in the fast-growing esthetic segment. CY International opened a new titanium blank factory in Jiangsu in late 2024, strengthening supply security for local fixture makers. Patent-filing activity reveals Chinese entities now account for 28% of global implant technology applications, underscoring strategic pivot toward innovation.
China Dental Implants Industry Leaders
Straumann Group
Nobel Biocare Services AG
Dentsply Sirona Inc.
ZimVie Inc.
Osstem Implant Co., Ltd.
- *Disclaimer: Major Players sorted in no particular order

Market Opportunities and Future Outlook
VBP-driven affordability is widening procedure expansion opportunities at institutions that can run high-throughput implant workflows under price governance. A step-change effect from centralized procurement is reflected in published research, including a 2026 BMC Public Health analysis reporting an average 55% price reduction following the 2023 centralized VBP for dental implants, which supports broader access through standardized pricing. This environment is creating room for suppliers and clinic networks that bundle cost-controlled implant systems with digital dentistry, including guided planning and chairside workflows, to reduce chair time and improve case acceptance in Tier-1 and fast-scaling Tier-2 city clinic chains.
Commercial levers in the near term hinge on procurement participation, local manufacturing, and compliance upgrades. NHSA has signaled a second round framework for dental implant VBP (VBP 2.0) scheduled for release in July 2026, keeping tender readiness and product portfolio positioning in focus alongside distributor execution across provinces and cities. On the supply side, the revised NMPA medical-device GMP effective November 1, 2026 raises the bar for quality management and traceability, creating an opening for manufacturers with validated processes, including additive manufacturing aligned to T/CAMDI 044-2026, as well as for service providers supporting smaller players with audit, documentation, and post-market surveillance requirements.
Recent Industry Developments
- February 2026: Dentsply Sirona highlighted its Return-to-Growth Action Plan alongside 2026 sales guidance, keeping attention on execution priorities amid China pricing pressure from centralized procurement. For dental implants, this type of program reinforces portfolio and go-to-market discipline as VBP compresses price corridors and pushes manufacturers to defend share through differentiated workflows and cost control.
- November 2025: Straumann introduced its first Shanghai-manufactured dental implants after establishing local production capabilities tied to its Shanghai production, education, and research center. Localized manufacturing supports tender competitiveness and supply responsiveness under China procurement dynamics, while also strengthening clinical education reach as standardized pricing takes hold.
- October 2024: The Sichuan Drug and Medical Device Procurement Center removed Dentsply Sirona's XiVE S series from the local VBP list following an NMPA registration change to the product material specification. The action highlighted how product-change control and registration updates can have immediate downstream effects on procurement eligibility and hospital channel access.


Research Methodology Framework and Report Scope
Market Definition and Coverage
For this study, the market is the annual revenue generated in China from dental implant systems used to replace missing tooth roots, mainly covering implant fixtures and matching abutments sold to dental care providers.
Scope exclusions: We exclude crowns, bridges, aligners, dentures, and general dental consumables that are not implant fixtures or abutments.
Segmentation Overview
- By Part
- Fixture
- Abutment
- By Material
- Titanium Implants
- Zirconium Implants
- PEEK / Polymer Implants
- By Implant Type
- Endosteal
- Subperiosteal
- Transosteal
- Intramucosal
- By Design
- Tapered
- Parallel-Walled
- By Procedure
- Single-Stage
- Two-Stage
- By End-User
- Dental Clinics
- Hospitals
- Academic & Research Institutes
Data Sources, Market Sizing, and Validation
Desk Research
Desk research set the base structure for the model and helped us lock down the China-specific policy and demand context. We reviewed public releases and time series from sources such as the National Health Commission of the PRC, the National Bureau of Statistics of China, and National Medical Products Administration notices for device registration and compliance signals.
To estimate procedure volumes and care delivery patterns, we also used materials from the Chinese Stomatological Association (where available), peer-reviewed clinical and public health articles, and customs or trade statistics that reflect shipments of relevant medical devices. On the commercial side, we referred to company filings, investor presentations, distributor announcements, and reputable press coverage to map channel structure and pricing narratives. We also used paid databases for company financials and intelligence, plus a patent database to cross-check innovation activity and product pipeline mentions. The desk sources listed here are illustrative only, and many other public and subscription sources were also referred to for data collection, validation, and research clarification.
Primary Interviews and Surveys
Primary work was used to confirm what desk research cannot fully show, especially how volume-based procurement and private clinic pricing translate into realized ASPs and procedure growth. We spoke with implant manufacturers and importers, dental distributors, clinic procurement staff, and practicing dentists across major coastal provinces and selected inland cities, so the demand picture was not skewed toward a single care setting.
Distribution of primary research fieldwork respondents
| Company type | Respondent position |
|---|---|
| Top tier: 36% | CXOs: 16% |
| Mid tier: 47% | Functional/Unit leaders: 41% |
| Smaller Players: 17% | Managers: 43% |
Market-Sizing & Forecasting
Market sizing was built using a top-down and bottom-up approach, where the top-down view starts from the China dental treatment pool and then narrows it using implant procedure penetration and average system spend per case. That demand pool was then corroborated with selective bottom-up checks, such as sampled clinic channel pricing, distributor sell-in patterns, and supplier roll-ups in the form of ASP multiplied by implied unit volume to keep totals realistic.
A few inputs carried most of the weight in the model, and they were refreshed and checked repeatedly. These included implant procedure volume trends under volume-based procurement, the split between public hospitals and private clinics, average implants per patient case, realized selling prices after tender resets, and mix shifts across titanium and zirconia options (plus limited use of polymer types where applicable). Where a variable could not be directly observed, we used interview ranges and anchored them to observable signals like registration activity, tender outcomes, and clinic throughput indicators.
For forecasting, scenario analysis was used because policy timing and pricing resets can move the market in step changes rather than smooth curves. We built a base case with expected tender and price normalization, plus upside and downside cases around procedure uptake speed, clinic capacity expansion, and patient affordability, and then we brought it back to a single forecast path after expert review.
Data Validation & Update Cycle
Validation was done through several passes so the final numbers match real market behavior and not just one data stream. We compared outputs against independent signals like procedure growth direction, tender price movements, and the implied spend per clinic, and then outliers were traced back to a specific input before being adjusted.
Before sign-off, assumptions were reviewed by another analyst and flagged areas were rechecked through follow-up outreach when the variance looked material. Reports are refreshed annually, and interim updates are made when a policy change or pricing event is large enough to shift ASPs or volumes. Right before delivery, we run a final check on recent releases so clients receive the most up-to-date view available at that time.
Mordor Intelligence's China Dental Implants Market Size Compared With Other Published Estimates
Published market numbers for China dental implants can look far apart even when they point to the same growth story. The differences usually come from timing, what is counted as an implant sale, and whether pricing is captured before or after procurement related resets.
In this market, the biggest gap drivers are how quickly average selling prices are refreshed after volume-based procurement rounds, how the USD conversion date is chosen when local pricing moves within the year, and whether the estimate includes adjacent items like restorations or surgical kits as part of the implant system.
Benchmark comparison
| Source | Market Size | Gaps in Research Methodology |
|---|---|---|
| Mordor Intelligence | USD 0.80 B (2025) | |
| Industry Blog A | USD 0.60 B (2024) | Uses a prior-year snapshot and does not clearly show how tender-linked ASP resets are carried forward, which can shift the implied run-rate depending on the month selected. |
| Advisory Publisher B | USD 1.00 B (2024) | Appears to bundle implant related add-ons and restorations into the value, and it likely applies a faster price recovery curve that can overstate revenue in a VBP environment. |
The table shows that timing and what gets included in the price basket explain most of the spread. When procedure volumes are rising but unit prices are being reset, the cleanest path is to anchor on refreshed ASPs and a clearly defined implant system scope, which is then checked against tender outcomes and channel feedback in the update process used by Mordor Intelligence so the total stays traceable and repeatable.


Key Questions Answered in the Report
How large is the China dental implants market in 2026?
It is valued at USD 850 million and is forecast to reach USD 1.14 billion by 2031.
What growth rate is expected for implant procedures through 2031?
Overall placements are projected to expand at a 6.12% CAGR, aided by VBP-driven affordability and demographic aging.
Which material segment is growing fastest?
Zirconium implants show the highest momentum with a 12.12% CAGR through 2031, driven by esthetic demand.
Why do rural provinces lag in implant adoption?
Shortages of implant-trained dentists and higher out-of-pocket costs limit access, resulting in lower denture and implant usage rates.
How does Volume-Based Procurement affect pricing?
VBP has trimmed average implant system prices by more than 20%, stimulating higher procedure volumes in both public hospitals and private clinics.
Which design type currently leads usage?
Tapered implants dominate with 59.35% share, prized for primary stability and suitability for immediate placement.
Page last updated on:


 Your data is secure and never sold or shared.


