
Market Overview
| Study Period | 2020 - 2031 |
|---|---|
| Forecast Data Period | 2026 - 2031 |
| Base Year Market Size (2025) | USD 4.85 Trillion |
| Market Size (2026) | USD 5.03 Trillion |
| Market Size (2031) | USD 6.01 Trillion |
| Growth Rate (2026 - 2031) | 3.65 % |
| Market Concentration | Medium |
Major Players *Disclaimer: Major Players sorted in no particular order Image © Mordor Intelligence. Reuse requires attribution under CC BY 4.0. | |
China Construction Market Analysis by Mordor Intelligence
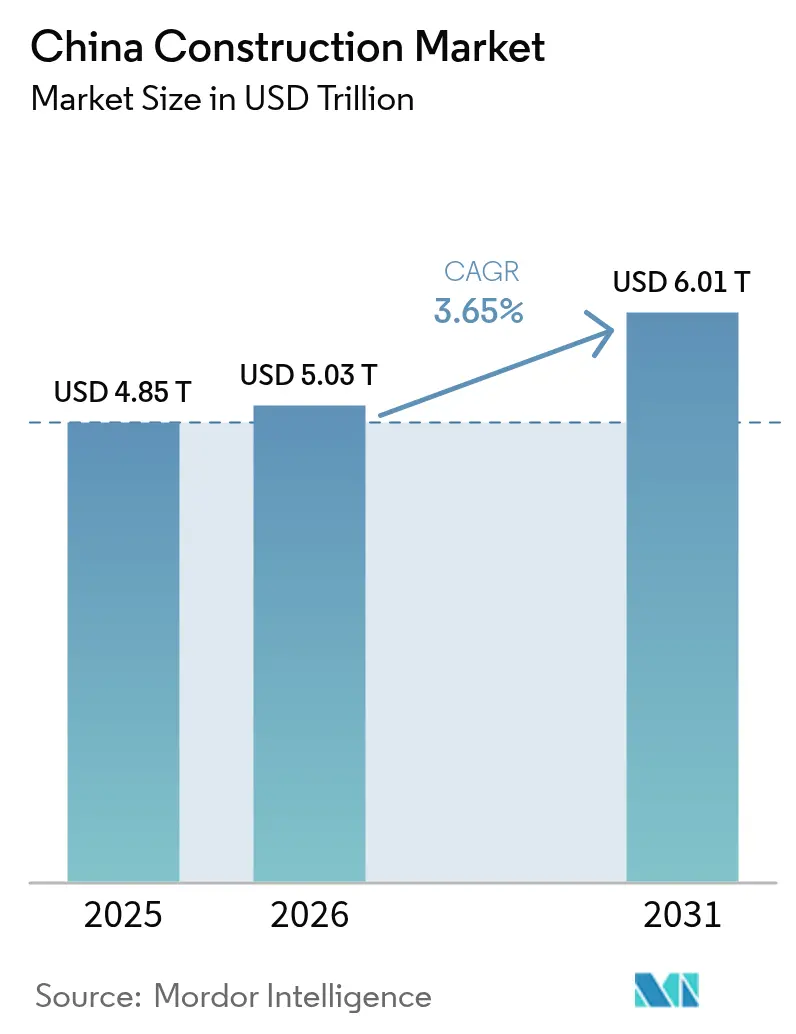
The China Construction Market size is expected to grow from USD 4.85 trillion in 2025 to USD 5.03 trillion in 2026 and is forecast to reach USD 6.01 trillion by 2031 at 3.65% CAGR over 2026-2031.
Robust public spending on underground utilities, sustained urbanization that is pulling millions into city centers, heightened digitalization of approvals, and spill-over demand from domestic Belt and Road Initiative (BRI) corridors are keeping project pipelines active despite property-sector turbulence. Public–private partnership models and infrastructure investment trusts are making it easier for non-state capital to participate in transport, energy, and urban renewal schemes. Technology adoption is quickening: building information modeling (BIM), robotics, and modular manufacturing are compressing schedules and reducing defects. At the same time, cost pressures from an aging workforce and stricter green-finance rules are compelling builders to rethink conventional on-site methods in favor of prefabrication. Regional activity is spreading westward as the government tries to balance growth, while market leaders lean on scale, integrated design-build expertise, and government ties to maintain their edge.
Key Report Takeaways
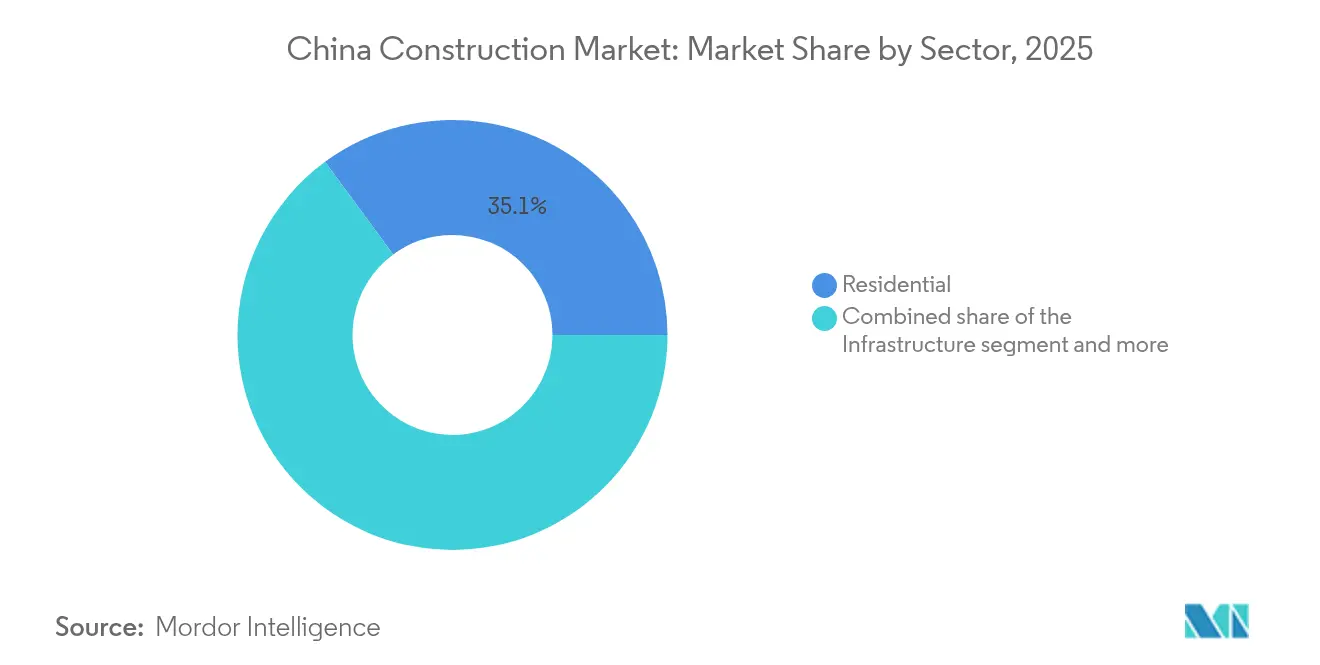
- By sector, residential led with a 35.10% China construction market share in 2025, whereas infrastructure is forecast to expand at a 5.41% CAGR through 2031.
- By construction type, new construction accounted for 77.05% of the China construction market size in 2025, while renovation is progressing at a 5.22% CAGR.
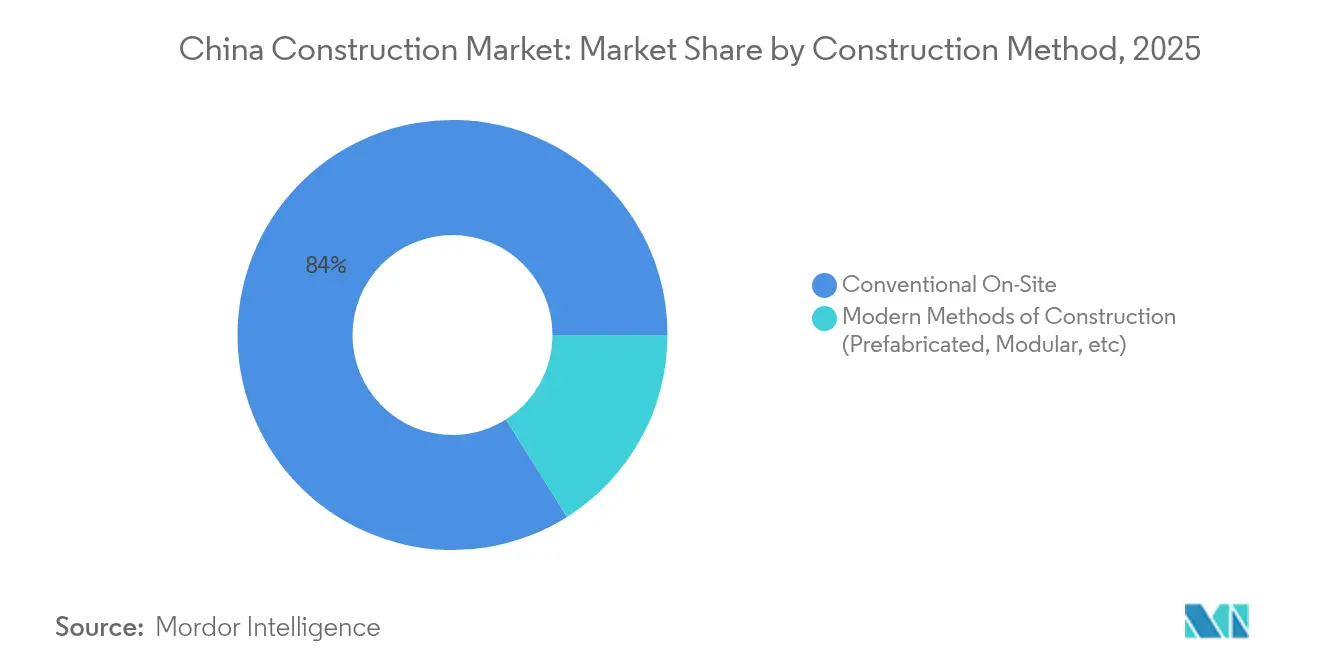
- By construction method, conventional on-site work held 83.95% of the China construction market size in 2025; modern prefabricated approaches are rising at a 6.05% CAGR.
- By investment source, public funding formed 62.05% of spending in 2025, yet private investment is advancing at a 5.45% CAGR.
- By geography, Jiangsu commanded 16.05% of the China construction market share in 2025, whereas the Rest of China grouping is set to climb at a 5.35% CAGR to 2031.
Note: Market size and forecast figures in this report are generated using Mordor Intelligence’s proprietary estimation framework, updated with the latest available data and insights as of 2026.
China Construction Market Trends and Insights
Drivers Impact Analysis*
| Driver | (≈) % Impact on CAGR Forecast | Geographic Relevance | Impact Timeline |
|---|---|---|---|
| Government infrastructure stimulus packages | +1.2% | National; western and central provinces | Medium term (2-4 years) |
| Urbanization-driven housing demand | +0.8% | Tier-2 and Tier-3 cities; spill-over to county-level areas | Long term (≥ 4 years) |
| Digital project-approval platforms (BIM) | +0.6% | Tier-1 cities expanding to provincial capitals | Short term (≤ 2 years) |
| Domestic BRI corridor spill-over projects | +0.4% | Border provinces; western development zones | Medium term (2-4 years) |
| Mandatory prefabrication quotas | +0.3% | Beijing, Shanghai, Guangzhou, Shenzhen | Short term (≤ 2 years) |
| Source: Mordor Intelligence | |||
Government Infrastructure Stimulus Packages
China is channeling USD 571.4 billion into “hidden infrastructure” such as underground pipelines, gas grids, and heating networks. The program emphasizes disaster-prevention upgrades and smart-city technologies, which in turn favor contractors with advanced engineering, BIM, and IoT capabilities. Fixed-asset data show 5.6% year-on-year growth in infrastructure outlays during early 2025, with water-conservancy investments leaping 39.1%, underscoring strong near-term momentum. Local authorities must meet green-building codes, linking stimulus funding to energy-efficiency metrics and amplifying demand for high-performance materials[1]Chen Rui, “Press Conference on Infrastructure Investment Trends,” State Council Information Office, scio.gov.cn.
Urbanization-Driven Housing Demand
China’s five-year plan aims for a 70% urbanization rate, granting roughly 300 million migrant workers access to city services through hukou reform. The shift fuels a steady need for affordable apartments plus supporting hospitals, schools, and transit. Central and western provinces are now logging quicker urban growth than the coast, widening geographic demand. Policy directives prioritize inclusive, affordable homes, creating predictable workflows for builders skilled in standardized, low-cost designs[2]Li Wei, “Five-Year Action Plan for New Urbanization,” State Council of the People’s Republic of China, gov.cn.
Digital Project-Approval Platforms (BIM-Powered)
Digitized approval portals embedded with BIM cut review cycles from months to weeks while auto-checking compliance, clashes, and cost targets. Early adopters win bids faster and incur fewer rework penalties. As provincial governments roll out mandates, even mid-tier cities require BIM models, lifting baseline technology standards nationwide. The same datasets feed smart-city dashboards, making BIM a linchpin of broader digital transformation and ensuring sustained state backing.
Domestic BRI Corridor Spill-Over Projects
Rail lines, logistics parks, and energy infrastructure linking China to Southeast Asia and Central Asia demand extensive domestic groundwork. Border provinces are leveraging BRI corridors to justify high-spec highways, inland ports, and power grids, thus drawing construction deeper inland. Contractors meeting elevated technical specs for cross-border assets gain a reputational edge that carries over to public tenders elsewhere.
Restraints Impact Analysis*
| Restraint | (≈) % Impact on CAGR Forecast | Geographic Relevance | Impact Timeline |
|---|---|---|---|
| Shrinking local-government land-sale revenue | −0.6% | Tier-3 and Tier-4 cities; northeastern provinces | Medium term (2-4 years) |
| Persistent residential oversupply | −0.5% | Tier-3 and Tier-4 cities, notably in the northeast | Long term (≥ 4 years) |
| ESG-linked lending caps on carbon-heavy work | −0.4% | National; stricter in developed coastal regions | Short term (≤ 2 years) |
| Escalating skilled-labor costs | −0.3% | National; acute in coastal manufacturing hubs | Medium term (2-4 years) |
| Source: Mordor Intelligence | |||
Shrinking Local-Government Land-Sale Revenues
Land sales finance up to 30% of municipal budgets, but weaker housing demand in smaller cities is shrinking auction receipts and curbing funds available for new projects. Local authorities respond by delaying or downsizing public works pipelines, dampening near-term opportunities for contractors dependent on municipal orders. Fiscal reforms under discussion may diversify revenue streams, yet timelines remain uncertain, adding risk to bid pipelines[3]Gao Lei, “Budget Execution Report 2025,” Ministry of Finance, mof.gov.cn.
Persistent Residential Oversupply in Lower-Tier Cities
Inventory in many Tier-3 and Tier-4 markets exceeds 18 months of sales, making new starts commercially unviable. Developers pivot toward urban-renewal and fit-out work, which offers smaller contract values. Conversion of unsold units into subsidized rentals is underway, but absorbing excess stock will take years, keeping a lid on greenfield housing demand in affected regions.
*Our forecasts treat driver/restraint impacts as directional, not additive. The impact forecasts reflect baseline growth, mix effects, and variable interactions.
Segment Analysis
By Sector: Infrastructure Drives Long-Term Growth
Infrastructure captured 5.41% CAGR prospects, outpacing all other sectors as the state prioritizes transport links, water conservancy, and utility upgrades. Within the China construction market, residential retained a 35.10% share in 2025, backed by migrant-friendly housing subsidies. Industrial and logistics facilities are surging on e-commerce and supply-chain localization, while traditional office towers slow amid remote-work adoption.
Government outlays for the 158-km fully automated highway and the USD 571.4 billion hidden-infrastructure program underscore commitment to resilient networks. Renewables-ready grid projects and the Pinglu Canal add multi-year volume. Apartment blocks remain core, yet low-density villas around Tier-2 suburbs are gaining ground as commuters seek larger living spaces. Tight green-building rules steer both public and residential segments toward higher-spec insulation, boosting demand for energy-efficient materials.


By Construction Type: Renovation Gains Momentum
New construction commanded 77.05% of 2025 spend in the China construction market, yet renovations are forecast to climb 5.22% annually to 2031 as urban-renewal campaigns intensify. Multi-family retrofits improve energy performance and seismic safety, aligning with green bond eligibility and special-purpose bond issuance.
Owners favor renovation because prime city plots are limited and demolition carries social costs. Conversion of aging malls into mixed-use community hubs and office-to-apartment reconfigurations are examples of lucrative upgrades. Fiscally, renovations’ lower land-acquisition costs and quicker approvals translate into higher margins for specialist contractors versed in live-environment work. The China construction market size for large-scale retrofits is therefore expanding even faster than ground-up projects in mature metros.
By Construction Method: Prefabrication Transforms Industry
Conventional techniques still dominate China construction market with an 83.95% share, yet modular builds are rising at a 6.05% CAGR, catalyzed by mandatory quotas. Factory production cuts waste and halves on-site labor, which offsets skilled-worker inflation.
The China construction market is witnessing new joint ventures between developers and steel fabricators to secure in-house panel supply. Investment hurdles are high, but once plants reach volume, the cost per square meter drops below conventional builds. Government procurement is starting to score bids on prefabrication usage, effectively embedding the method into public works tenders.
By Investment Source: Private Sector Acceleration
Public capital delivered 62.05% of 2025 value in the China construction market, yet private investment is climbing 5.45% annually, buoyed by tax breaks and guaranteed-return models. Infrastructure investment trusts listed on domestic exchanges enable insurance funds and pension pools to back toll roads, warehouses, and data centers.
Developers previously reliant on presales are turning to equity partnerships with industrials seeking strategic facilities. While foreign direct investment has cooled, domestic private players fill the gap, intensifying competition and fostering innovation in project-finance structures. This ongoing shift is broadening funding diversity within the China construction market and tempering reliance on state budgets.
Geography Analysis
Jiangsu led with 16.05% of 2025 spend in the China Construction Market, reflecting its role in the Yangtze River Delta manufacturing belt. Projects span advanced-manufacturing parks, logistics hubs linked to Shanghai’s ports, and eco-friendly urban renewals in Suzhou and Changzhou. Early adoption of prefabrication plants gives local firms an edge in meeting Tier-1 performance codes.
Guangdong and Zhejiang remain heavyweights but now focus on quality-oriented builds. Guangdong’s Greater Bay Area plan bundles metro extensions, cross-harbor tunnels, and airport expansions that underpin demand through 2030. Zhejiang’s private-enterprise dominance generates steady industrial and warehouse requirements, while heritage-district restorations in Hangzhou showcase high-end renovation skill sets.
The Rest of China grouping is projected for the fastest 5.35% CAGR as central directives push funds toward the west and northeast. High-speed rail spines, provincial highways, and county-level water treatment plants are unlocking latent demand. Remote areas also host BRI-linked inland ports and energy corridors, spreading the footprint of the China construction market well beyond historical coastal centers.
Regulatory Landscape
China’s construction regulatory environment is tightening around digital compliance, building quality, and urban renewal. In June 2026, the Ministry of Housing and Urban-Rural Development (MOHURD) and the National Data Administration issued a circular that promotes a Unified Building Code for new construction and full life-cycle digital management by 2030. The direction reinforces BIM-enabled permitting, standardized electronic documentation, and data traceability across design, construction, and operations.
Administrative procedures are also being streamlined and digitized. A 2026 implementation opinion requires that by October 2026, new, renovated, and expanded projects adopt a joint acceptance approach featuring one-window acceptance, joint inspection, and one-network processing. This raises the importance of contractor readiness for coordinated inspections, digital handover packages, and consistent reporting. Alongside these reforms, the 15th Five-Year Plan (2026-2030) emphasizes urban renewal and renovation, including renovation of 115,000 old urban residential compounds, while 2026 safety and green-building related standards continue to shift compliance attention toward retrofit quality, supervision, and carbon-aware construction practices.
Value Chain Analysis
China’s construction value chain runs from land and project origination (local governments, state platforms, and developers) to financing (public budgets, special bonds, PPP structures, and infrastructure investment trusts), then planning and design (architectural and engineering institutes, digital approval portals). Contracting sits at the center of execution, with dominant central SOEs alongside provincial SOEs and private specialists, and the downstream layer includes inputs such as cement, steel, aggregates, equipment, MEP systems, and an expanding prefabrication ecosystem.
Government programs and planning mechanisms shape upstream demand signals. Cities are expected to prepare housing development plans under people-housing-land-capital linkage, and energy conservation and carbon reduction actions continue to push higher-performance building envelopes and electrification-oriented building systems. On the supply side, materials and equipment production is being directed toward high-end, intelligent, and green manufacturing under 2025-2026 building materials industry growth planning. Supply chain governance is also becoming more standardized through industry frameworks such as T/CIET 507-2024 and T/CIET 508-2024 for construction material supply chain management and evaluation. Execution bottlenecks remain concentrated in skilled labor availability, particularly MEP, structural, and finishing trades in Tier 1 markets, which raises the value of prefabrication, modularization, and digital coordination to protect schedules. Central enterprises retain an advantage in major projects through integrated design-build capacity and procurement scale, while smaller contractors and specialists tend to focus on renovation, fit-outs, and system-intensive infrastructure packages where compliance and delivery precision differentiate bidders.
Competitive Landscape
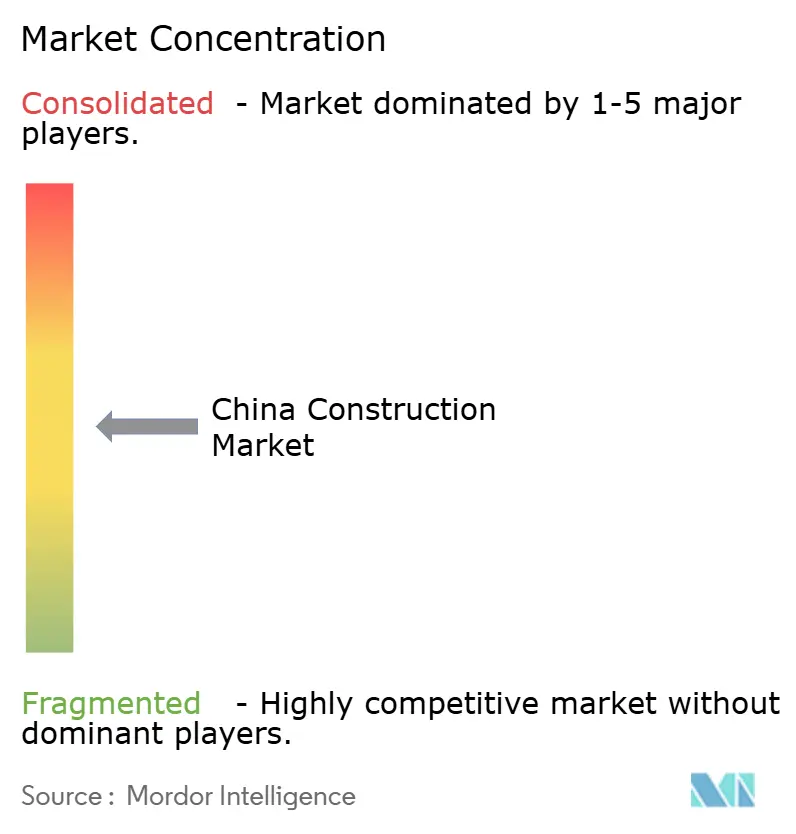
State-owned giants China State Construction Engineering Corporation, China Railway Group, China Railway Construction, Power Construction Corporation of China, and China Communications Construction collectively controlled over 80% of mega-project awards in 2024. Scale provides procurement leverage, captive design institutes, and preferential credit lines, enabling them to underbid smaller rivals on turnkey civil packages.
In the China Construction Market, Technology now shapes differentiation. The 158-km robot-built highway proved that integrated drones, 3D printing, and AI-coordinated plant fleets can deliver 24/7 production with reduced injuries. Firms investing in data-driven site management and carbon-tracking dashboards secure ESG-linked loans at lower spreads.
Private contenders concentrate on niche high-margin arenas such as data-center campuses, electric-vehicle charging corridors, and façade retrofits. Several have partnered with tech start-ups offering digital twins and modular plug-ins, allowing lean teams to compete for smart-city pilot zones. International contractors remain minor players due to stringent localization rules, yet joint ventures in specialized tunneling and deep-sea bridgework persist where local experience is limited.
China Construction Industry Leaders
China State Construction Engineering (CSCEC)
China Railway Group (CREC)
China Railway Construction (CRCC)
China Communications Construction (CCCC)
Power Construction Corporation (PowerChina)
- *Disclaimer: Major Players sorted in no particular order

Market Opportunities and Future Outlook
Program-driven infrastructure and renewal pipelines are creating visible contracting opportunities across energy transmission, waterway and rail corridors, and urban renovation packages. In July 2026, the National Development and Reform Commission finalized the third batch of key national projects for 2026, allocating 193.5 billion yuan from ultra-long special treasury bonds. Across 2026, arranged funds cover 1,417 major projects totaling 800 billion yuan, supporting sustained bidding volume for civil works, rail, water conservancy, and resilient utility upgrades. Parallel large-ticket project execution is also opening near-term demand for EPC and specialized subcontractors, including State Grid Corporation of China’s Shaanbei-Anhui +-800 kV UHVDC transmission project entering operation in June 2026 (20.50 billion yuan investment, 8 million kW rated capacity), the June 2026 start of a 77.2 billion yuan mega waterway project on the Yangtze River with a five-tier dual-track ship lock at the Three Gorges Dam, and the June 2026 opening of the 257 km Xi’an-Shiyan high-speed railway (47.68 billion yuan).
Urban renewal is becoming a structural opportunity set as policy focus shifts from large-scale expansion toward inventory-based upgrades and quality outcomes. The State Council’s May 2026 release of the Urban Renewal 15th Five-Year Plan (2026-2030) highlights integrated urban physical examinations, project bank establishment, and approval-system reforms for renovation projects. This aligns demand with contractors that can deliver retrofit engineering, safety-resilience works, and standardized documentation across multiple small-to-mid sized sites. As digital approval and acceptance systems tighten, technology-enabled delivery (BIM, data handover, and compliance automation) becomes more commercially relevant for winning public and quasi-public tenders, particularly where submission quality, inspection readiness, and lifecycle data requirements are being scored.
Recent Industry Developments
- July 2026: China State Construction Engineering Corporation (CSCEC) disclosed ongoing AI-empowered digital construction upgrades through a subsidiary, including AI-based market intelligence, intelligent contract review, and AI-driven safety inspection tools. The move strengthens execution control and compliance documentation as digital approvals and coordinated inspections expand, and it supports CSCEC’s ability to standardize delivery across large multi-site programs.
- May 2026: China Railway Construction Corporation (CRCC) signed a Products and Services Procurement Framework Agreement with its parent China Railway Construction Group (CRCG), covering materials, equipment, and construction services through December 2029. The multi-year arrangement supports procurement continuity and volume planning for major infrastructure workloads, helping stabilize input availability and pricing coordination across subsidiaries.
- December 2024: Beijing confirmed a USD 571.4 billion hidden-infrastructure upgrade program for 2025-2029 focused on pipelines and urban resilience. The commitment supports multi-year demand for utility rehabilitation, underground works, and smart-city linked upgrades, favoring contractors with strong municipal interfaces and specialized underground engineering capabilities.


Research Methodology Framework and Report Scope
Market Definition and Coverage
This market is defined as the total value of construction work executed within China across building and civil engineering activity, counted in current USD based on project spending recognized during construction.
The scope excludes upstream building materials manufacturing, real estate transactions and land sales, and pure design consulting when it is not bundled as part of a construction contract.
Segmentation Overview
- By Sector
- Residential
- Apartments/Condominiums
- Villas/Landed Houses
- Commercial
- Office
- Retail
- Industrial and Logistics
- Others
- Infrastructure
- Transportation Infrastructure (Roadways, Railways, Airways, others)
- Energy & Utilities
- Others
- Residential
- By Construction Type
- New Construction
- Renovation
- By Construction Method
- Conventional On-Site
- Modern Methods of Construction (Prefabricated, Modular, etc)
- By Investment Source
- Public
- Private
- By Geography
- Jiangsu
- Guangdong
- Zhejiang
- Beijing
- Shanghai
- Rest Of China
Data Sources, Market Sizing, and Validation
Desk Research
Desk research starts with public macro and sector series so the model begins with a realistic demand pool. We referenced the National Bureau of Statistics of China for fixed asset investment and construction output indicators, the Ministry of Housing and Urban-Rural Development for policy and activity signals, and the National Development and Reform Commission for project pipeline direction.
To ground cost and macro assumptions, we also reviewed China Customs releases alongside the World Bank and IMF for inflation, exchange rates, and construction related macro indicators. Company annual reports, investor presentations, and reputable press were used to sanity check project mix and execution pace, and a paid subscription focused on company financials plus a separate patent database were used selectively to validate capability and technology shifts. These examples are not exhaustive, and other public sources were also used for data collection, cross-checks, and clarification.
Primary Interviews and Surveys
Primary work was done through expert interviews and structured surveys with EPC contractors, specialist subcontractors, developers, lenders, and buyers of public works, so we could confirm what is being built versus what is being delayed. We kept coverage balanced across major provinces and city clusters, then checked against inland activity patterns to avoid skew from a coastal-only view. When gaps appeared in desk indicators, we re-contacted respondents to re-test assumptions on project starts, tender conversion, and pricing behavior.
Distribution of primary research fieldwork respondents
| Company type | Respondent position |
|---|---|
| Top tier: 37% | CXOs: 17% |
| Mid tier: 41% | Functional/Unit leaders: 40% |
| Smaller Players: 22% | Managers: 43% |
Market-Sizing & Forecasting
Sizing uses a top-down build where fixed asset investment and construction output series are translated into construction spend, and then filtered by execution timing so only in-year work done is counted. The totals are then corroborated with selective bottom-up checks, including sampled project values from tender disclosures, contractor revenue mix checks, and simple volume by average cost approximations for repeatable asset types.
Key inputs include real estate starts and completions, infrastructure and public works budget signals, the share of renovation versus new build, labor and materials cost inflation, and the pace of policy-led programs such as urban renewal and transport upgrades. Since some public datasets are released with lags or revisions, missing points were gap-filled using short-window trend smoothing and then re-aligned when official updates arrived. Forecasts were built using scenario analysis supported by expert consensus on investment direction, financing conditions, and the timing of major project awards, and then converted to USD using consistent exchange-rate assumptions for each year.
Data Validation & Update Cycle
Validation relies on repeated cross-checks so the final output is not driven by a single indicator. We compare the model against independent signals such as construction PMI direction, fixed asset investment growth, and publicly announced project pipelines, and then investigate any large variances before internal sign-off.
Outliers are reviewed in multiple steps, including peer review of assumptions and re-contact triggers when the implied growth rate conflicts with field feedback or new policy moves. The report is refreshed annually, and material events, including major stimulus announcements, sharp FX shifts, or large changes in property financing, are assessed for interim updates. Before delivery, analysts complete a final pass to ensure the latest available releases are reflected in the numbers.
Mordor Intelligence's China Construction Market Size Compared With Other Published Estimates
Different sources often publish different China construction market values because they do not count the same spend, and they also use different base years and currency timing. The biggest differences usually come from whether the estimate is closer to an investment announcement number, an executed work done number, or a narrower definition linked only to building activity.
Some external figures lean on broad national commentary or mixed spend concepts that can blur the line between construction work and adjacent real estate or capital items. A key reason for the spread is that some estimates fold in wider real estate related turnover, and then Mordor Intelligence counts only construction work put in place and keeps land sales and materials manufacturing outside the market total.
Benchmark comparison
| Source | Market Size | Gaps in Research Methodology |
|---|---|---|
| Mordor Intelligence | USD 4.85 T (2025) | |
| Government Trade Brief A | USD 4.82 T (2025) | Often stated as an approximate headline value with limited visibility into inclusions, and it may mix construction activity with adjacent real estate related spending concepts instead of tracking work executed during the year. |
| Syndicated Publisher B | USD 4.59 T (2024) | Uses a different base year and forecast window, and the total can move depending on whether the model anchors on sector segment totals or macro investment series, which shifts implied splits across building and civil works. |
The table shows that the gap is mainly driven by scope interpretation and the selected year used as the anchor. When the sizing is tied back to observable execution signals and then checked through field feedback, the result is easier to reproduce and to update as policy and financing conditions change.


Key Questions Answered in the Report
What is the current value of the China construction market?
The market is valued at USD 5.03 trillion in 2026 with a forecast to reach USD 6.01 trillion by 2031.
Which segment is growing fastest through 2031?
Infrastructure projects are projected to expand at a 5.41% CAGR, outpacing all other segments.
How large is prefabrication within China’s construction activity?
Conventional work still holds 83.95% share, but prefabricated methods are rising at a 6.05% CAGR, helped by Tier-1 city quotas.
Which province contributes most to construction spend?
Jiangsu leads with a 16.05% share owing to its strong manufacturing base and urban-renewal programs.
How is private capital participating in Chinese construction?
Private investment is advancing at a 5.45% CAGR through 2031, supported by infrastructure trusts and favorable tax policies.
Page last updated on:


 Your data is secure and never sold or shared.


