
Market Overview
| Study Period | 2020 - 2031 |
|---|---|
| Forecast Data Period | 2026 - 2031 |
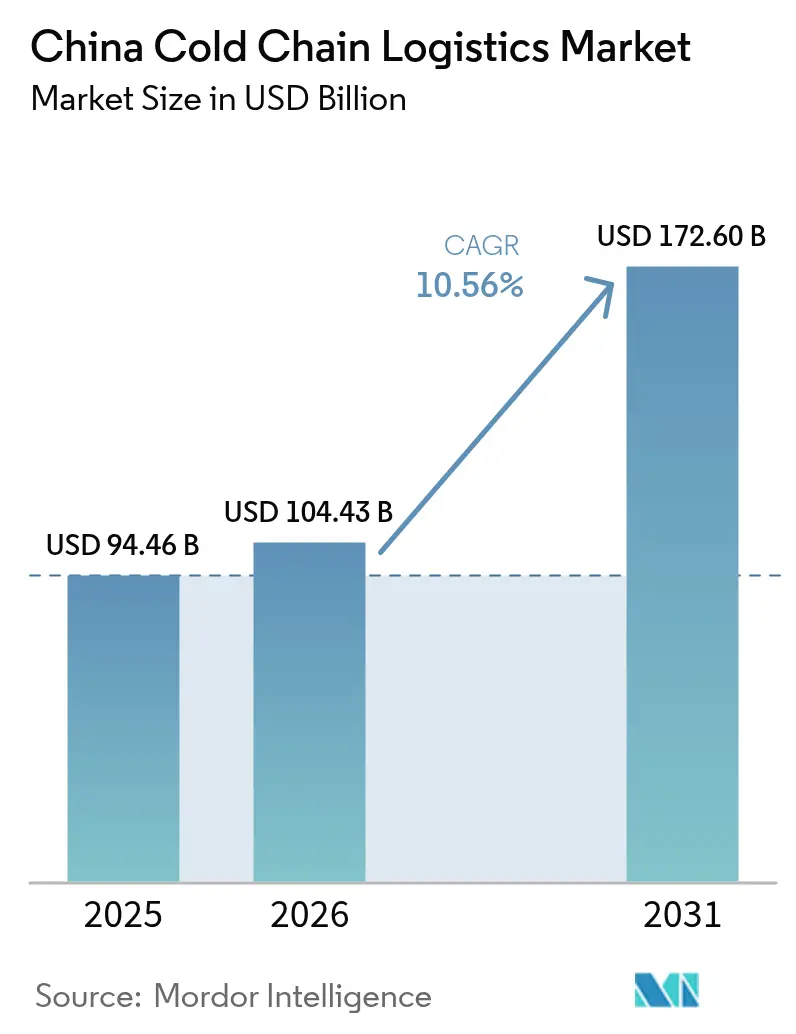
| Base Year Market Size (2025) | USD 94.46 Billion |
| Market Size (2026) | USD 104.43 Billion |
| Market Size (2031) | USD 172.6 Billion |
| Growth Rate (2026 - 2031) | 10.56 % |
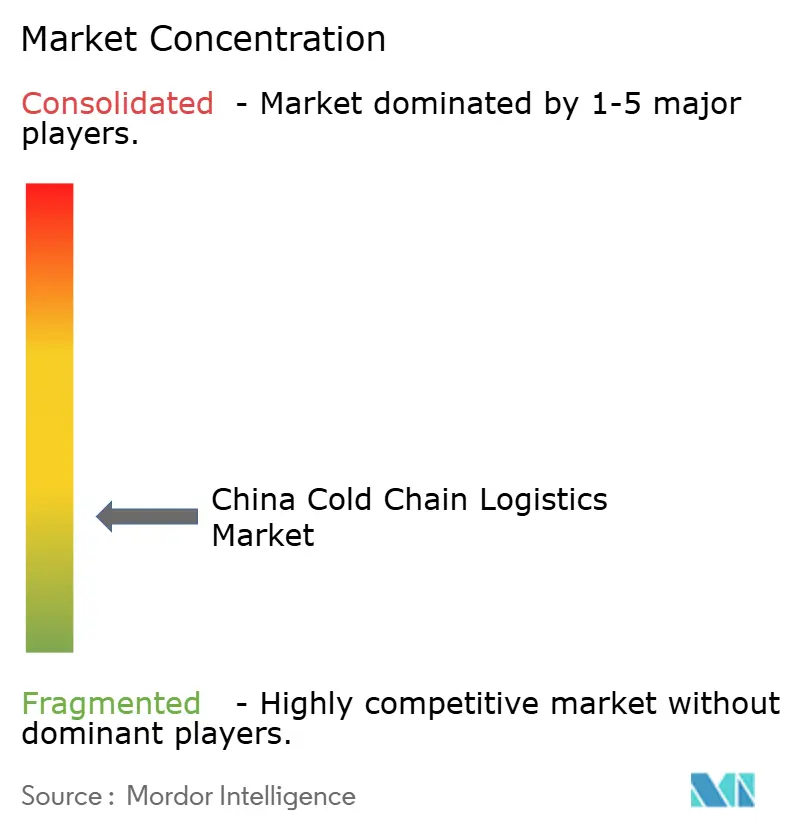
| Market Concentration | Low |
Major Players *Disclaimer: Major Players sorted in no particular order Image © Mordor Intelligence. Reuse requires attribution under CC BY 4.0. | |
China Cold Chain Logistics Market Analysis by Mordor Intelligence
The China Cold Chain Logistics Market size is expected to grow from USD 94.46 billion in 2025 to USD 104.43 billion in 2026 and is forecast to reach USD 172.6 billion by 2031 at 10.56% CAGR over 2026-2031.
Investment flowing from the 14th Five-Year Plan continues to add modern, multi-temperature depots across inland provinces, reducing the sector’s historic coastal bias and opening fresh revenue streams for integrated providers. At the same time, the proliferation of fresh-food e-commerce keeps compressing delivery windows, nudging operators to weave micro-fulfilment hubs into existing long-haul networks. Demand for GDP-compliant, ultra-low temperature lanes is rising in parallel with China’s biopharma export ambitions, which lifts average yields per tonne and accelerates technology upgrades. Middle-income households are buying more imported chilled meat and seafood, pulling volume through port-centric corridors that already benefit from scale. Last-mile fragmentation and a shortage of certified refrigeration technicians persist, yet the broader trajectory remains one of scale, digitisation, and gradual consolidation.
Key Report Takeaways
- By service type, refrigerated storage retained 50.32 % market share in 2025, while value-added services is pacing the field at a 11.90 % CAGR through 2031.
- By temperature range, chilled handling (0–5 °C) dominated with 58.12 % share in 2025; frozen logistics (–18–0 °C) is expanding fastest at an 11.01 % CAGR to 2031.
- By application, fruits & vegetables contributed 28.38 % of demand in 2025, whereas pharmaceuticals & biologics are projected to grow at a 14.12 % CAGR to 2031.
- By region, East China accounted for 33.74 % of the market in 2025, while Southwest China leads in growth with a 12.42 % CAGR through 2031.
Note: Market size and forecast figures in this report are generated using Mordor Intelligence’s proprietary estimation framework, updated with the latest available data and insights as of 2026.
China Cold Chain Logistics Market Trends and Insights
Drivers Impact Analysis*
| Driver | (~) % Impact on CAGR Forecast | Geographic Relevance | Impact Timeline |
|---|---|---|---|
| National Cold Chain Infrastructure under 14th FYP Accelerating Warehouse Build-out | +2.1% | National, with inland priority | Long term (≥ 4 yrs) |
| Rapid Fresh E-commerce | +1.5% | Urban nationwide | Short term (≤ 2 yrs) |
| Biopharma Export Boom Driving GDP-compliant Ultra-low Cold Chain | +1.3% | East and North China | Medium term (2-4 yrs) |
| Rising Middle-class Appetite for Imported Chilled Meat & Seafood | +0.8% | National, with higher penetration in coastal cities | Medium term (2-4 years) |
| Dairy-safety Modernization Programs Stimulating Temperature-controlled Milk Logistics | +0.6% | National, with focus on dairy production regions | Long term (≥ 4 years) |
| Energy-efficiency Subsidies for CO₂/Ammonia Systems Lowering Capex Barriers | +0.4% | National, with emphasis on industrial zones | Long term (≥ 4 years) |
| Source: Mordor Intelligence | |||
National Cold Chain Infrastructure under 14th FYP Accelerating Warehouse Build-out
Central government plans earmark significant capital for cold chain highways that connect production zones to city markets, targeting a 25 % chilled distribution rate for fruit and 45 % for meat by 2027[1]National Development and Reform Commission, “14th Five-Year Plan for Cold Chain Logistics Development,” ndrc.gov.cn. Inland hubs in Henan, Hunan, and Sichuan now account for a larger share of new cubic metres than coastal hubs, closing historical gaps and reducing transport distances[2]Sichuan Provincial Government, “Implementation Plan for Cold Chain Logistics Bases,” sc.gov.cn. This build-out is already cutting produce spoilage and encouraging planting of higher-value crops, a development that expands product diversity in retail channels.
Rapid Expansion of Fresh E-commerce
Same-day delivery promises from platforms such as JD Fresh and Freshippo have forced traditional carriers to install micro-fulfilment nodes inside city rings. Each node typically supports three temperature bands, allowing orders to be picked within minutes of confirmation. Route-optimisation software is cutting empty kilometres, meaning urban reefer vans can run more stops per shift. Consumers respond with larger basket sizes once they trust temperature integrity, reinforcing the platform’s competitive moat.
Biopharma Export Boom Driving GDP-Compliant Ultra-Low Cold Chain
China’s biologics manufacturers now ship therapies that require −20 °C to −70 °C handling, a process governed by the National Medical Products Administration’s GDP rules that align with EU standards. Providers that validate containers and log chain-of-custody data can price loads at two to three times the yield of food cargo. Those premiums justify investments in liquid-nitrogen systems that will later serve niche seafood and lab research markets, thereby raising industry-wide technical competence.
Rising Middle-Class Appetite for Imported Chilled Protein
Affluent households are spending more on Australian beef and Norwegian salmon, products that must stay between 0 °C and 4 °C from port to plate. Import corridors through Shanghai and Ningbo now embed real-time trackers in every reefer, making temperature compliance a visible marketing claim. Domestic beef suppliers are responding by upgrading their own logistics, so improvements spill back into local supply chains.
Restraints Impact Analysis*
| Restraint | (~) % Impact on CAGR Forecast | Geographic Relevance | Impact Timeline |
|---|---|---|---|
| Fragmented Last-mile Reefer Network Causing High Spoilage Rates | -1.2% | Tier-3 cities | Short term (≤ 2 yrs) |
| Shortage of Certified Industrial Refrigeration Technicians | -0.8% | Inland regions | Medium term (2-4 yrs) |
| High Electricity Tariffs & Grid Instability in Tier-3 Cold Stores | -0.7% | Tier-3 cities and rural areas | Medium term (2-4 years) |
| China VI Truck Emission Rule Inflating Reefer Fleet Retrofit Costs | -0.5% | National, with higher impact on smaller operators | Short term (≤ 2 yrs) |
| Source: Mordor Intelligence | |||
Fragmented Last-Mile Reefer Network
China Cold Chain Logistics market study data show spoilage rates for leafy greens exceed 10 % in some tier-three cities because many delivery firms use non-insulated vans. Insurance underwriters increasingly demand temperature logs for claims, leading to higher premiums for carriers without monitoring equipment. Technology-enabled entrants that pool orders across stores are winning share, foreshadowing consolidation in urban distribution.
Shortage of Certified Refrigeration Technicians
A national shortfall of tens of thousands of qualified technicians constrains the roll-out of natural-refrigerant systems. Operators in western provinces often wait days for repairs, lowering equipment uptime and raising electricity bills. Leading equipment vendors now bundle training with installation, monetising the skills gap while improving service quality. Facilities that secure certified staff quickly report lower maintenance costs and improved carbon footprints.
*Our forecasts treat driver/restraint impacts as directional, not additive. The impact forecasts reflect baseline growth, mix effects, and variable interactions.
Segment Analysis
Service Type: Storage Dominance Masks Transportation Opportunity
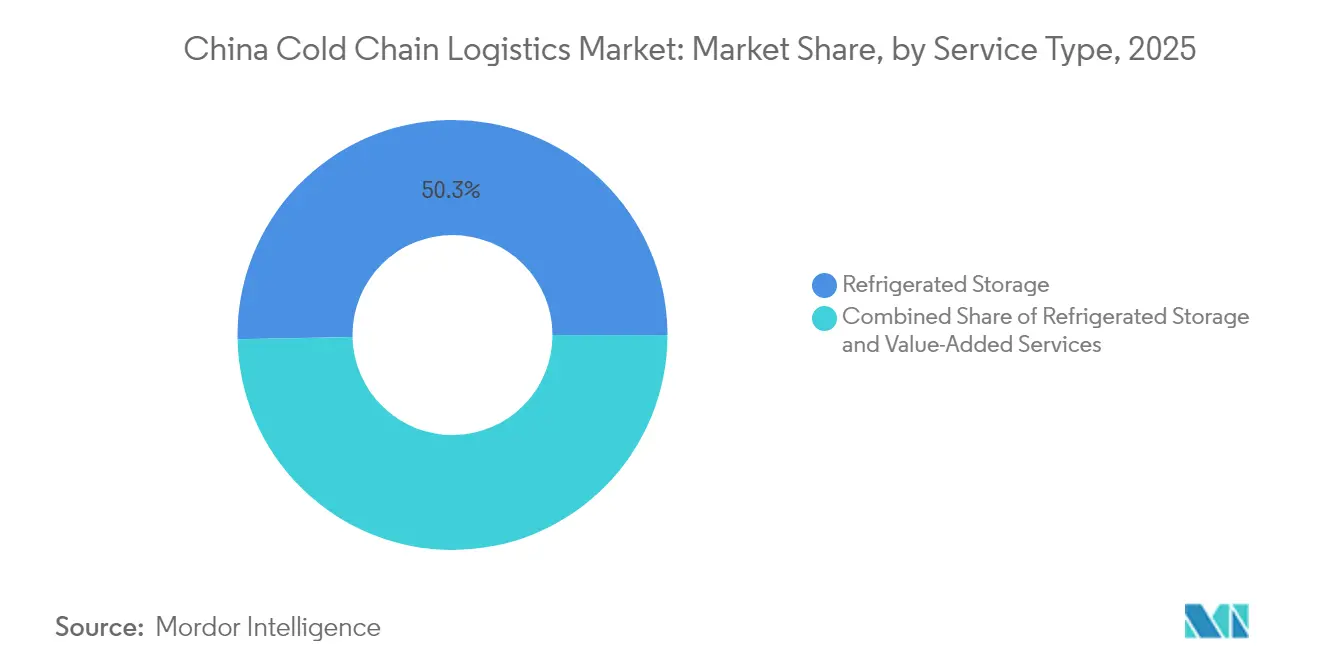
Refrigerated storage accounted for 50.32 % China Cold Chain Logistics market share in 2025, underscoring the need for fixed capacity. Growth in value-added services is faster at a forecast 11.90 % CAGR through 2031, showing that shippers increasingly pay for tasks like relabelling, inspection, and kitting. Operators that combine warehousing with these services improve their revenue per square metre, creating a buffer against price competition in basic pallet storage. Integrated models also lower handling errors because goods remain within one digital ecosystem from inbound to outbound.
Refrigerated transportation remains the second-largest category and continues to benefit from e-commerce timelines that compress order-to-delivery cycles. Sensor-equipped trailers now stream temperature and door-open data every two minutes, reducing claims and supporting dynamic route changes when traffic builds. Small hauliers unable to finance such upgrades risk losing contracts to asset-light tech intermediaries that can guarantee visibility without owning trucks. The landscape therefore tilts toward fewer but larger fleets partnered with software platforms.


Temperature Type: Chilled Segment Expansion Driven by Fresh Produce Revolution
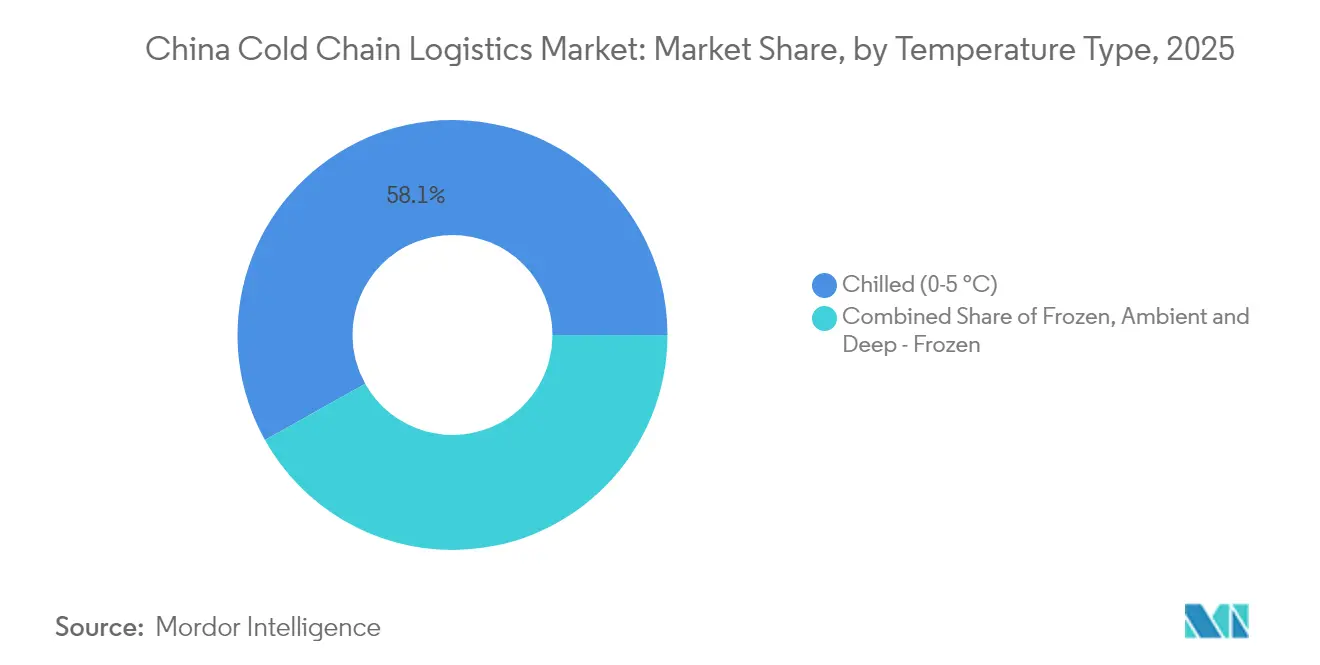
Chilled logistics (0 °C–5 °C) captured 58.12 % China Cold Chain Logistics market size in 2025 as fresh produce and dairy remained central to household diets. Frozen lanes (−18 °C–0 °C) are expanding at more than 11 % CAGR thanks to convenience foods and longer-haul meat imports. The deep-frozen and ultra-low segment grows quickest, driven by biologics and some premium desserts that need −40 °C or colder. Facilities capable of handling three bands under one roof can switch chambers as demand shifts, maximising utilisation and reducing payback periods.
Energy-efficient hardware is spreading across all bands. Carbon-dioxide systems, supported by central grants, cut power bills and avoid synthetic refrigerant quotas. Users report that the higher upfront cost is recouped within five years through lower electricity and maintenance outlays, suggesting a clear financial case for green technology in the China Cold Chain Logistics industry.
Application: Fruits & Vegetables Lead While Pharmaceuticals Accelerate
Fruits and vegetables held 28.38 % China Cold Chain Logistics market share in 2025, reflecting the scale of domestic horticulture. Direct sourcing models that truck produce within hours of harvest have reduced shrinkage and expanded shelf life, so supermarkets can now stock more SKUs and reduce mid-week replenishment trips. Meat and poultry is the next-largest segment, with stricter import inspections driving demand for certified storage space.
Pharmaceuticals and biologics form the fastest-growing segment at over 14 % CAGR through 2031. Stringent GDP rules mean zero tolerance for temperature excursions, so loads earn premium yields that cover extra compliance costs. Vaccine makers sign multi-year contracts to lock in capacity, giving providers predictable revenue streams. Precision monitoring tools developed for pharma are now crossing over to high-value food categories, a trend that elevates industry-wide service expectations.
Geography Analysis
East China retained 33.74 % China Cold Chain Logistics market share in 2025, underpinned by dense consumer markets and port access. Container throughput at Shanghai supports fast transshipment of chilled salmon flown in from Europe, reinforcing the region’s role as gateway for premium imports. Pharmaceutical clusters in Jiangsu and Zhejiang generate steady demand for 2 °C–8 °C storage, providing counter-seasonal revenue that balances produce peaks. Operators describe energy tariffs as the main cost headwind, prompting heavy investment in rooftop solar and high-efficiency insulation.
Southwest China posts the industry’s highest regional CAGR at 12.42 % through 2031. Government incentives attract logistics parks to Chengdu and Chongqing, creating an alternative corridor that links to Southeast Asia by rail-sea service. The region’s mild winters lower refrigeration power loads, giving cost advantages for long-term storage. Citrus growers in Sichuan now pre-cool fruit on farm, cutting loss rates and enabling export to northern markets. Early entrants enjoy first-mover advantages in land availability and local labour, positioning them to scale alongside rising consumption.
North China combines the national capital area with grain-producing hinterlands. Cooler ambient temperatures reduce energy use in half the year, yet hot, humid summers strain legacy insulation. Large distribution centres around Tianjin employ smart ventilation to manage condensation, improving safety and reducing mould risk. Cross-border lanes with Mongolia handle frozen beef and ice cream, using electrified reefers that plug into trackside power to cut diesel costs. Local authorities offer toll rebates for low-emission trucks, nudging fleets toward cleaner engines earlier than in other regions.
Regulatory Landscape
China cold chain logistics is shaped by national planning and a standards stack that keeps raising distribution coverage goals and temperature compliance expectations. The 14th Five-Year Plan for Cold Chain Logistics Development (2021-2025) underpins infrastructure and service upgrades, and the National Development and Reform Commission (NDRC) has used the National Backbone Cold Chain Logistics Base program to guide investment, reaching 105 bases after the 5th batch was announced in June 2025.
Traceability and service capability requirements have tightened through updated standards that affect both shippers and 3PLs. GB/T 28843-2024 (Food Cold Chain Logistics Traceability Management Requirements) took effect on September 1, 2024, formalizing end-to-end traceability expectations for food cold chain operations, while WB/T 1153-2026 (Dairy Cold Chain Logistics Service Specification) became effective on May 1, 2026, adding more prescriptive service requirements for dairy-focused cold chain providers.
Value Chain Analysis
The value chain runs from upstream producers and importers, through pre-cooling and processing nodes, to multi-temperature storage and transport operators, and then into downstream channels such as supermarkets, foodservice, and fresh e-commerce. National planning has increasingly influenced both where capacity is built and how performance is assessed. NDRC’s backbone base network reached 105 sites by June 2025, while GB/T 31086-2025 (Requirements and Evaluation Indicators for Cold Chain Service Capabilities of Logistics Enterprises), implemented on June 1, 2025, provides a standardized framework for evaluating cold chain service capabilities across logistics enterprises.
In practice, flows are consolidating into hub-and-spoke patterns that connect production zones and ports to urban micro-fulfillment. Recent capacity additions include port-adjacent and inland corridors, including MEDLOG and China Master Logistics inaugurating an 80,000-tonne cold storage facility in Shanghai Lingang Free Trade Zone in March 2026, alongside inland projects such as Mingpinfu Group starting construction of a 16 billion yuan smart cold chain logistics park in Zhengzhou, Henan in February 2026. Bottlenecks reported across the chain include last-mile fragmentation, a shortage of certified refrigeration technicians, and operational constraints such as reefer plug availability at major terminals.
Competitive Landscape
Roughly 70 % of China Cold Chain Logistics market share is split among the top fifteen companies, yet hundreds of local firms keep pricing fluid. Scale players such as Sinotrans and China Merchants deploy capital into national parks, locking in electricity contracts that damp energy volatility. Technology-centric operators including SF Cold Chain and JD Logistics focus on same-day fulfilment and data transparency, often commanding higher unit rates. Foreign specialists like Lineage partner with domestic firms to navigate equity caps, importing warehouse automation that boosts throughput.
Competitive edges increasingly come from software, not just cubic metres. AI tools predict peak loads during festival seasons, allowing carriers to pre-position trailers and avoid surge costs. Blockchain pilots give shippers immutable temperature records, reducing dispute resolution time. Smaller firms without these tools may either license platforms or exit niche markets. The technician shortage magnifies the divide because large players can run in-house training academies, ensuring uptime and client confidence.
China Cold Chain Logistics Industry Leaders
Sinotrans Limited
SF Express
Beijing Ershang Group
NICHIREI CORPORATION
Shanghai Jin Jiang International Industrial Investment Co. Ltd.
- *Disclaimer: Major Players sorted in no particular order

Market Opportunities and Future Outlook
The formalization of national backbone cold chain logistics bases creates demand for operators that can secure nodes in or near designated base cities and connect them to multi-temperature warehousing, value-added services, and time-definite distribution. NDRC’s June 2025 announcement of the 5th batch of projects lifted the total to 105 backbone bases, and the shift from broad build-out toward standardized, digitalized operations supports opportunities for providers offering traceability, validated temperature-control processes, and enterprise-grade monitoring aligned with national standards.
Port-centric and cross-border perishable corridors are also pulling in investment and partnerships that favor integrated players with import-export handling and bonded capability. In March 2026, MSC (MEDLOG) and China Master Logistics launched a joint venture operating five cold storage facilities across Shanghai, Tianjin, and Ningbo, anchored by an 80,000-tonne site in Shanghai Lingang Free Trade Zone, which signals tighter linkage between ocean freight networks and domestic cold storage. Standard tightening in specialized verticals adds further service expansion opportunities. WB/T 1153-2026 (effective May 1, 2026) raises the bar for dairy cold chain logistics services, and large-format automated projects such as Yuhu Cold Chain’s Tianjin development (4.86 billion yuan investment, with the topping-out phase reported in March 2026) point to demand for higher-throughput, multi-temperature, and ultra-low-temperature capabilities that smaller legacy facilities often cannot match.
Recent Industry Developments
- June 2026: SF Express proposed a USD 180 million investment to develop cold chain logistics and bonded warehouse facilities at Mongla in Bangladesh. The move expands SF Express’s temperature-controlled footprint beyond China and strengthens its ability to support cross-border e-commerce and export flows that require compliant cold chain handling.
- April 2026: Nichirei Corporation announced the acquisition of shares in two Indonesian cold chain logistics companies, PT Mega Indo Logistik and PT Mega Internasional Sejahtera. The deal extends Nichirei’s ASEAN network and supports multinational shippers seeking more consistent temperature-controlled service levels across sourcing and distribution lanes linked to China.
- April 2025: JD Logistics opened a 120,000 sq m automated multi-temperature center in Suzhou with five climate zones ranging from -30 C to ambient. The facility improves throughput and multi-band handling for fresh e-commerce and retail replenishment, reinforcing the shift toward automation-led capacity additions in core consumption regions.


Research Methodology Framework and Report Scope
Market Definition and Coverage
For this report, the market is defined as the commercial value earned in China from temperature-controlled logistics services that keep goods within required temperature ranges during storage, handling, and transportation.
Scope exclusions: We exclude ambient warehousing and general freight that does not use temperature control, and we also exclude in-house cold rooms that are not part of third-party logistics activity.
Segmentation Overview
- By Service Type
- Refrigerated Storage
- Public Warehousing
- Private Warehousing
- Refrigerated Transportation
- Road
- Rail
- Sea
- Air
- Value-Added Services
- Refrigerated Storage
- By Temperature Type
- Chilled (0–5 °C)
- Frozen (-18–0 °C)
- Ambient
- Deep-Frozen / Ultra-Low (More than -20 °C)
- By Application
- Fruits & Vegetables
- Meat & Poultry
- Fish & Seafood
- Dairy & Frozen Desserts
- Bakery & Confectionery
- Ready-to-Eat Meals
- Pharmaceuticals & Biologics
- Vaccines & Clinical Trial Materials
- Chemicals & Specialty Materials
- Other Perishables
- By Region (China)
- East China
- North China
- South-Central China
- Southwest China
- Northeast China
- Northwest China
Data Sources, Market Sizing, and Validation
Desk Research
Desk research helps us anchor the market to real activity indicators that can be checked year after year. We used public sources such as the National Bureau of Statistics of China for transport and commerce context, the General Administration of Customs for trade flows of temperature-sensitive goods, and the China Federation of Logistics and Purchasing for cold chain operating signals.
We also reviewed guidance and reporting from bodies such as the Ministry of Transport and the National Medical Products Administration (for distribution compliance cues), and FAO references to frame cold chain needs for food supply. On top of that, company annual reports, investor presentations, and reputable press were used to understand service mix, pricing direction, and capacity expansion announcements, and then results were cross-checked using paid subscriptions for company financials and intelligence, news and financials, and shipment-level import and export data. This list is not exhaustive, and we also consulted other sources for data collection, validation, and clarification during research.
Primary Interviews and Surveys
Primary work was used to test assumptions that are hard to see in public data, especially around utilization, service pricing, and the split between refrigerated transport and cold storage activity. We spoke with logistics operators, cold storage owners, shippers, and channel partners across major producing and consuming provinces, and then used follow-up calls to confirm any large variances that showed up in the model.
Distribution of primary research fieldwork respondents
| Company type | Respondent position |
|---|---|
| Top tier: 28% | CXOs: 17% |
| Mid tier: 55% | Functional/Unit leaders: 39% |
| Smaller Players: 17% | Managers: 44% |
Market-Sizing & Forecasting
Market sizing starts with a top-down reconstruction of the addressable cold chain service pool in China, where transport and food and pharma flow indicators are converted into temperature-controlled logistics demand, and then filtered into commercial third-party revenues. Once that structure was set, selective bottom-up approximations were used to stress-test totals, such as sampled capacity and utilization checks for cold storage and sampled price-per-ton or price-per-trip logic for refrigerated distribution.
Key inputs used in the model include cold storage capacity additions and occupancy trends, refrigerated truck fleet growth and replacement pace, shipment distance mix for distribution networks, service price movement for storage fees and linehaul rates, and compliance-driven handling requirements for pharma and vaccines. When direct bottom-up data was missing for smaller operators, gaps were handled through proxy assumptions anchored to observed regional activity, then re-checked through interviews.
For forecasting, scenario analysis was used so growth could be tied to a small set of drivers that practitioners can validate, such as fresh food penetration in modern retail, growth in temperature-sensitive imports, and expansion of regulated pharma distribution. Those driver paths were reviewed with primary respondents, and the final growth curve was adjusted only after the assumptions could be explained back to the same set of operational stakeholders.
Data Validation & Update Cycle
Validation is done by checking the model output against independent signals, then reviewing areas where the math implies unrealistic utilization, pricing, or service mix. If a segment total moves sharply year over year, we re-check the underlying inputs, revisit the conversion factors, and re-contact sources when the variance cannot be explained by published events.
Before sign-off, the file goes through multi-step analyst reviews so the logic, units, and currency conversions are consistent across historical years and the forecast window. Reports refresh annually, with interim updates when major policy changes, capacity expansions, or logistics disruptions materially shift demand. Right before delivery, a final pass is performed so clients receive the latest updated view.
Mordor Intelligence's China Cold Chain Logistics Market Estimate Compared With Other Published Estimates
Published market sizes for China cold chain logistics can look far apart, even when they talk about the same country and the same time period. The gap usually comes from how each publisher draws the service boundary, which demand signals are trusted, and whether the figure is built as a revenue market or as a demand-tonnage proxy.
Cold chain demand tonnage and reported cold chain revenue growth are two checks that keep Mordor Intelligence's estimate tied to third-party temperature-controlled services, instead of drifting into general freight or in-house cold storage activity. Differences also show up when some estimates add adjacent items like cold chain equipment sales, or when they use aggressive price escalation without validating it against storage fee and transport rate trends.
Benchmark comparison
| Source | Market Size | Gaps in Research Methodology |
|---|---|---|
| Mordor Intelligence | USD 104.43 B (2026) | |
| Industry Association A | USD 746.00 B (2024) | Reported as overall cold chain logistics revenue for the economy, which can include broader logistics and related services beyond commercial temperature-controlled storage and transport, and it is also stated in CNY for a different year. |
| Trade Publisher B | USD 799.00 B (2025) | Uses a forecast-style total market value in CNY that is often built from high-level industry revenue projections, which may embed optimistic price growth and may not separate third-party cold chain from captive cold rooms. |
Taken together, the spread is mostly explained by scope and unit choices, meaning revenue-for-the-whole-economy versus commercial cold chain logistics services, and also by year and currency timing. By keeping the model tied to measurable service activity and then stress-testing the totals with operator-level checks, the outcome stays easier to trace back to clear inputs and repeatable steps.


Key Questions Answered in the Report
What is the expected size of the China Cold Chain Logistics market by 2031?
The market is projected to reach USD 172.6 billion by 2031.
Which region currently holds the largest China Cold Chain Logistics market share?
East China leads with just over one-third of national revenue.
Which service segment is growing fastest within the China Cold Chain Logistics industry?
Value-added services, such as packaging and quality inspection, are expanding more quickly than basic storage or transport.
Why is the pharmaceutical cold chain becoming more prominent?
Stringent GDP rules and growth in biologics exports require ultra-low temperature control, creating higher-margin lanes for compliant providers.
What challenge most affects last-mile cold deliveries?
A fragmented network of small carriers lacking temperature-controlled vans leads to higher spoilage rates in tier-three cities.
How does the 14th Five-Year Plan influence cold chain investment?
The plan funds new hubs across central and western provinces, accelerating infrastructure growth beyond coastal regions.
Page last updated on:


 Your data is secure and never sold or shared.


