
Market Overview
| Study Period | 2021 - 2031 |
|---|---|
| Forecast Data Period | 2026 - 2031 |
| Historical Data Period | 2021 - 2024 |
| Market Volume (2026) | 4.94 Billion tonnes |
| Market Volume (2031) | 5.09 Billion tonnes |
| Growth Rate (2026 - 2031) | 0.63 % |
| Market Concentration | Medium |
Major Players *Disclaimer: Major Players sorted in no particular order Image © Mordor Intelligence. Reuse requires attribution under CC BY 4.0. | |

China Coal Market Analysis by Mordor Intelligence
The China Coal Market size in terms of production volume is expected to grow from 4.94 Billion tonnes in 2026 to 5.09 Billion tonnes by 2031, at a CAGR of 0.63% during the forecast period (2026-2031).
Output creeps upward because hyperscale data-center clusters and coal-chemical complexes demand baseload reliability even as Beijing expands renewables. A government-backed capacity-replacement program is shuttering small, inefficient pits while permitting large, high-efficiency mines, which stabilizes aggregate tonnage despite stricter carbon-peaking rules. Autonomous and smart-mine deployments are cutting operating costs 20-30%, giving state-owned enterprises (SOEs) cost leadership. Meanwhile, water-stress constraints in Shanxi, Shaanxi, and Inner Mongolia are tightening new-mine approvals, amplifying supply-chain risks for coastal utilities that already lean on imports. Overall, the Chinese coal market navigates a paradox of slow volume growth, intensifying consolidation, and gradually shrinking strategic relevance within the national energy mix.[1]National Development and Reform Commission, “Capacity Replacement Policy Documents,” ndrc.gov.cn
Key Report Takeaways
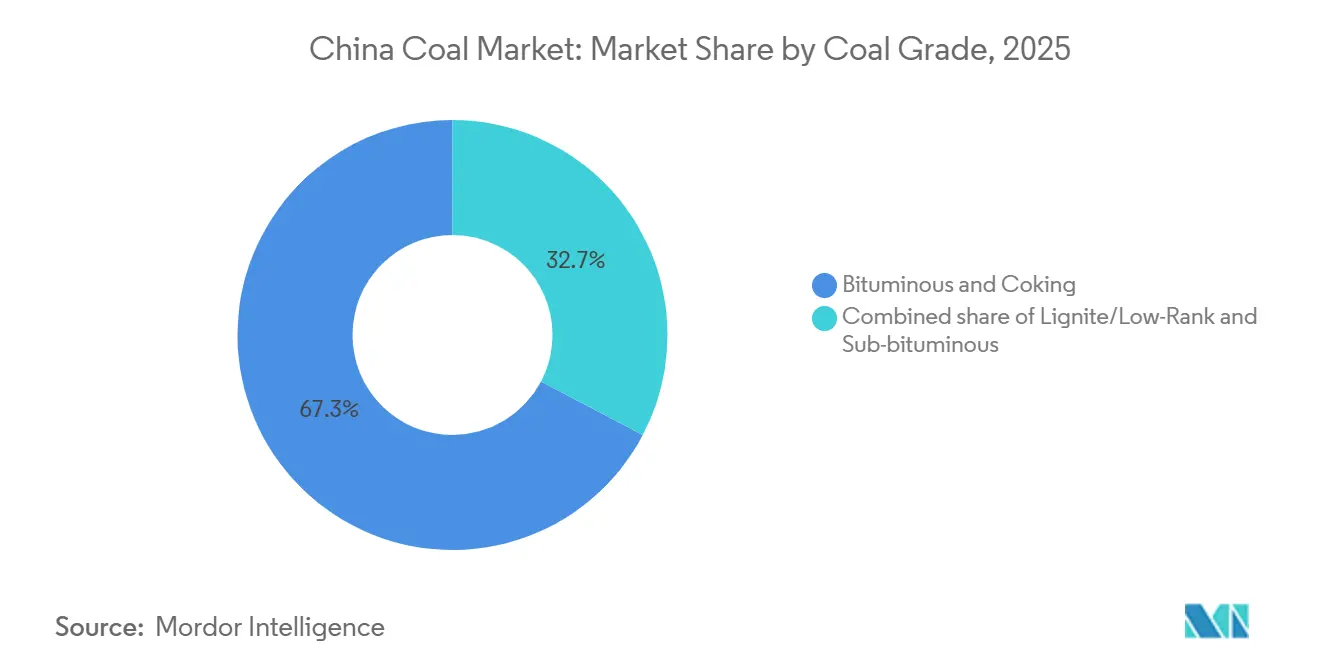
- By coal grade, bituminous and coking grades led with 67.3% of China's coal market share in 2025, and the same is forecast to expand at a 1.1% CAGR through 2031.
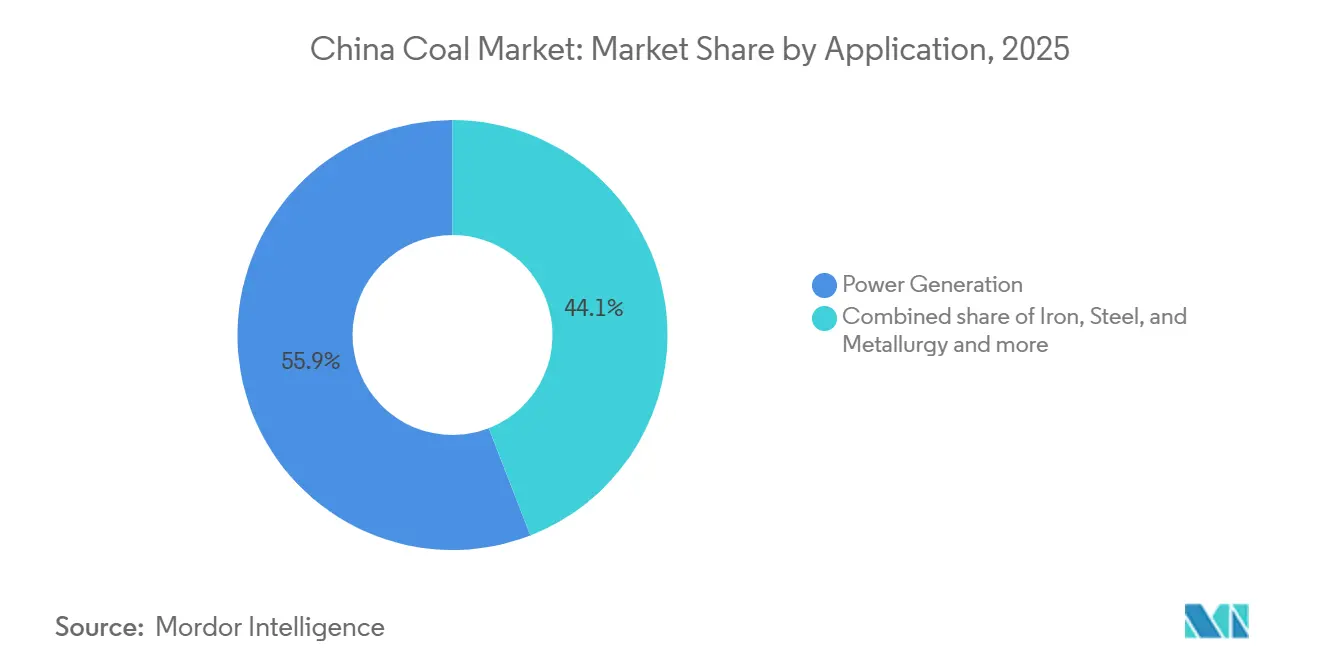
- By application, power generation absorbed 55.9% of China's coal market share in 2025, while cement and other industrial uses are projected to grow at a 1.8% CAGR to 2031.
- By geography, Shanxi, Shaanxi, and Inner Mongolia supplied more than 70% of the output in 2025.
- China Energy Investment, China Coal Energy, Shaanxi Coal, Shandong Energy, and Yankuang Energy collectively controlled about 45% of the Chinese coal market in 2025.
Note: Market size and forecast figures in this report are generated using Mordor Intelligence’s proprietary estimation framework, updated with the latest available data and insights as of January 2026.
China Coal Market Trends and Insights
Drivers Impact Analysis*
| Driver | % Impact on CAGR Forecast | Geographic Relevance | Impact Timeline |
|---|---|---|---|
| Rapid growth in electricity demand from data-center clusters | +0.18% | National, concentrated in Beijing-Tianjin-Hebei, Yangtze River Delta, Guangdong | Medium term (2-4 years) |
| Surging captive-power demand from coal-chemical complexes | +0.12% | Shanxi, Shaanxi, Inner Mongolia, Ningxia | Medium term (2-4 years) |
| Government-backed capacity replacement program | +0.10% | National, with focus on Shanxi, Shaanxi, Inner Mongolia | Long term (≥4 years) |
| Cost-competitive domestic reserves vs. seaborne imports | +0.08% | National, strongest in inland provinces (Shanxi, Shaanxi, Inner Mongolia) vs. coastal import-dependent regions | Short term (≤2 years) |
| Autonomous & smart-mine deployment cuts OPEX | +0.08% | Shanxi, Shaanxi, Inner Mongolia (early adopters), expanding to Xinjiang | Long term (≥4 years) |
| Ultra-low-emission retrofits extend plant lifetimes | +0.09% | National, with priority in eastern provinces (Jiangsu, Zhejiang, Shandong) facing stricter emissions standards | Medium term (2-4 years) |
| Source: Mordor Intelligence | |||
Rapid Growth in Electricity Demand from Data-Center Clusters
Artificial-intelligence workloads and cloud services are reshaping the Chinese coal market by adding inflexible baseload demand that renewables alone cannot yet satisfy. Data centers are poised to consume an extra 90 TWh of coal-fired electricity between 2024 and 2030, and provincial regulators fast-tracked 15 GW of coal capacity in 2024 to backstop these clusters.[2]International Energy Agency, “China Energy Outlook 2024,” iea.org Operators secure ten-year power-purchase agreements with mine-mouth generators, locking in bituminous supply at fixed escalators. This arrangement reduces spot-market volatility for hyperscale facilities and guarantees offtake for miners. The trend temporarily extends coal’s role in China’s power mix despite the country’s renewable boom. It also encourages vertically integrated SOEs to invest in rail-port logistics that deliver stable throughput to coastal data clusters.
Surging Captive-Power Demand from Coal-Chemical Complexes
Coal-to-chemicals projects accounted for about 8% of coal consumption in 2025, and expansions underway in Shanxi, Shaanxi, and Ningxia could push the share above 10% by 2030.[3]China Petroleum and Chemical Industry Federation, “Coal Chemical Industry Report 2024,” cpcia.org.cn These complexes run captive cogeneration units that reach thermal efficiencies near 50%, higher than stand-alone generators. Shaanxi Coal’s 6 Mt/yr coal-to-olefins plant, commissioned in late 2024, consumes 12 Mt of lignite annually and lowers China’s reliance on imported naphtha. Water intensity remains a hurdle, requiring investments in recycling systems that favor players with aquifer access. The segment provides a long-term, price-insulated outlet for low-rank coal, shielding miners from shrinking utility demand. It also creates downstream polypropylene and polyethylene volumes that feed domestic packaging and auto industries.
Government-Backed Capacity Replacement Program
The capacity-replacement framework requires retiring at least one tonne of outdated mining capacity for every tonne of new approvals, closing over 1,000 small mines between 2021 and 2025. Average mine capacity is slated to rise from 1.2 Mt/yr in 2020 to 1.8 Mt/yr by 2030, concentrating production in safer, more efficient operations. Shanxi alone retired 80 Mt of legacy pits in 2024 while sanctioning 120 Mt of smart-mine projects equipped with real-time methane monitoring. The policy reduces supply elasticity because new capacity takes several years to ramp up, supporting domestic prices during short-term demand spikes. SOEs with strong balance sheets gain share, while under-capitalized private firms exit or merge. Consolidation reinforces cost leadership that helps the Chinese coal market compete with cheaper renewables.
Autonomous and Smart-Mine Deployment Cuts OPEX
5G-enabled autonomous haulage, remote drilling, and AI-based predictive maintenance are cutting operating costs by 20-30% at leading mines, widening the gap between SOEs and smaller rivals. Yimin mine in Inner Mongolia, operated by China Energy Investment, deployed 100 autonomous trucks in 2024 and lifted truck utilization to 82%. Sub-10-millisecond network latency synchronizes equipment in real time, raises productivity by 15%, and lowers accident rates by 50% through automated methane-sensing shutdowns. Up-front capital can reach CNY 1 billion per site, limiting adoption to large balance-sheet players. The technology extends economic pit life in marginal seams by improving cost curves, thus sustaining volume as renewables erode average selling prices. It also creates a domestic technology ecosystem that exports mine-automation solutions across Belt and Road markets.
Restraints Impact Analysis*
| Restraint | % Impact on CAGR Forecast | Geographic Relevance | Impact Timeline |
|---|---|---|---|
| 2030 carbon-peaking / 2060 neutrality pledges tighten approvals | -0.22% | National, with stricter enforcement in eastern coastal provinces (Jiangsu, Zhejiang, Guangdong) | Long term (≥4 years) |
| Accelerating renewable & storage build-out curbs coal burn | -0.15% | National, with fastest displacement in wind-rich Inner Mongolia, solar-rich Qinghai, Gansu | Medium term (2-4 years) |
| ESG-driven credit restrictions on coal projects | -0.12% | National, most pronounced in commercial banking hubs (Beijing, Shanghai) affecting project financing nationwide | Medium term (2-4 years) |
| Water-stress in coal-rich provinces limits new mines | -0.10% | Shanxi, Shaanxi, Inner Mongolia (western Ordos Basin), Xinjiang | Long term (≥4 years) |
| Source: Mordor Intelligence | |||
2030 Carbon-Peaking / 2060 Neutrality Pledges Tighten Approvals
China’s dual-target climate pledge prompted regulators to reject 40% of coal-project applications in 2025, up from 20% in 2022. Coastal provinces such as Jiangsu, Zhejiang, and Guangdong apply the strictest filters and pivot funding toward offshore wind and grid-scale storage. Investors now price in stranded-asset risk when assessing greenfield thermal projects, steering capital toward clean-coal retrofits instead. The shift limits upside for the Chinese coal market beyond captive industrial niches. It also accelerates research into carbon-capture utilization that could eventually monetize flue-gas streams, but near-term financing remains skewed toward state-backed developers capable of absorbing policy swings.
Accelerating Renewable and Storage Build-Out Curbs Coal Burn
Renewable capacity exceeded 1,400 GW in 2025, with wind and solar installations outpacing coal retirements five-to-one. Grid-scale batteries reached 50 GW, enabling solar to serve evening peaks traditionally dominated by coal. Levelized solar cost dropped to CNY 0.15/kWh in 2024, undercutting coal’s CNY 0.25-0.30 range even before carbon fees. Inner Mongolia’s 80 GW of wind displaced thermal units during high-wind months, forcing seasonal mothballing. Coastal Guangdong retired 8 GW of coal in 2024 and filled the gap with offshore wind and LNG combined-cycle units. These trends shrink utility demand, compelling miners to pivot toward long-term industrial contracts and premium metallurgical grades.
*Our forecasts treat driver/restraint impacts as directional, not additive. The impact forecasts reflect baseline growth, mix effects, and variable interactions.
Segment Analysis
By Coal Grade: Metallurgical Demand Anchors Premium Segments
Bituminous and coking grades held 67.3% of China's coal market share in 2025 and are forecast to expand at a 1.1% CAGR through 2031, reflecting stable blast-furnace output that consumed 650 Mt of coking coal in 2024.[4]World Steel Association, “World Steel in Figures 2024,” worldsteel.org Sub-bituminous coal, roughly 20% of volume, serves power plants and cement kilns that value its lower sulfur content for easier emissions compliance. Lignite and other low-rank grades make up the remaining 13%, concentrated in Inner Mongolia and Yunnan, where mine-mouth generators and coal-chemical complexes exploit gasification pathways. Domestic steelmakers favor long-term contracts from Shanxi and Guizhou to hedge against import volatility from Australia, which supplied 45% of coking-coal imports in 2024. Ultra-low-emission retrofits at 900 GW of coal-fired capacity let sub-bituminous feedstock satisfy stricter particulate, SO₂, and NOₓ limits without switching to pricier imports.
The bifurcation between metallurgical and thermal demand shapes investment flows. SOEs are allocating capex to expand premium coking-coal output, while smaller entrants struggle to finance high-quality shafts. Meanwhile, thermal grades face margin pressure from cheaper renewables, prompting utilities to negotiate variable-load pricing and flexible offtake terms. Technology upgrades such as selective catalytic reduction and flue-gas desulfurization extend plant life, allowing the China coal market size for sub-bituminous grades to decline only slowly. Over time, metallurgical demand will remain the anchor for premium coal even as thermal volumes plateau.


By Application: Industrial Users Outpace Utility Demand
Power generation absorbed 55.9% of coal consumption in 2025, but cement and other industrial users will grow fastest at a 1.8% CAGR to 2031, driven by infrastructure spending and coal-chemical expansion. Cement output hit 2.07 billion tonnes in 2024, burning 450 Mt of thermal coal; stimulus for social housing sustains clinker volumes even amid overcapacity concerns. Iron and steel account for about 30% of tonnage, although electric-arc-furnace adoption rose to 15% of crude steel in 2025, tempering future coking-coal growth. Coal-chemical routes, such as methanol-to-olefins, monetize low-rank reserves and supply domestic petrochemicals, insulating producers from renewable displacement.
Renewable-priority dispatch rules cut coal-plant capacity factors to 47% in 2025, reducing spot demand from utilities and shifting bargaining power toward IPP buyers that secure baseload contracts. Newer, flexibility-enhanced units remain valuable for peak shaving, but older subcritical plants face early retirement or conversion to strategic reserves. Industrial buyers, by contrast, sign long-term supply deals at premium prices to ensure feedstock certainty, making them essential customers for miners seeking predictable cash flows in the evolving Chinese coal market.
Geography Analysis
Shanxi, Shaanxi, and Inner Mongolia jointly contributed more than 70% of the national supply in 2025, with Shanxi alone producing 1.3 billion tonnes. Water consumption is a critical constraint: Shanxi used 2.5 billion m³ for coal operations in 2024, prompting a moratorium on new permits in counties with aquifer depletion exceeding recharge by 30%. Inner Mongolia faces similar pressure in western basins where coal-chemical complexes compete with agriculture for scarce water, forcing developers to deploy costly desalination systems.
Xinjiang holds 40% of China’s coal reserves and represents a long-term growth frontier, but limited rail capacity allowed only 180 Mt of exports in 2024. The Lanzhou-Xinjiang freight corridor, slated for completion in 2027, should raise outbound capacity and unlock higher utilizations. Coastal provinces (Jiangsu, Zhejiang, Guangdong, and Fujian) remain import-dependent, receiving 506 Mt of seaborne coal in 2024, primarily from Indonesia and Australia. Domestic thermal coal averaged CNY 700-750/t ex-mine in Shanxi during 2024, versus CNY 800-850/t for Newcastle-grade imports delivered to Guangzhou, preserving inland cost advantages despite freight fees.
Geopolitical risk raises volatility: Australian coking-coal shipments experience periodic disruptions, nudging steel mills toward Mongolian and Russian alternatives. Mongolia exported 45 Mt to China in 2024, up from 30 Mt in 2022, leveraging improved border logistics. Provincial policies diverge sharply: Shanxi and Shaanxi provide tax breaks and fast-track permits for smart-mine projects, attracting CNY 50 billion of investment during 2024-2025, while Jiangsu and Zhejiang impose strict environmental assessments that effectively freeze new coal capacity. The resulting two-tier market favors vertically integrated SOEs that can shift production among provinces and optimize supply chains to match regional regulations and logistics constraints.
Regulatory Landscape
China's coal market operates under a tightening, plan-led framework that links supply security with energy efficiency and carbon-reduction targets. The National Development and Reform Commission (NDRC) and National Energy Administration (NEA) continue to steer permitting through capacity replacement and centralized planning, while NDRC Order No. 29 (effective February 2025) requires comprehensive mine area master plans for coal resource development, with major plan changes subject to central NDRC approval.
On the compliance side, the Ministry of Ecology and Environment (MEE) and NEA have raised performance thresholds for coal production and utilization. The Coal Clean and Efficient Utilization Key Fields Benchmark and Baseline Levels (2025 Edition) require sub-benchmark projects to complete technical upgrades within three years or face phase-out, reinforcing consolidation into larger, higher-efficiency assets. In June 2026, the Energy Field Energy Conservation and Carbon Reduction Action Plan (2026-2028) further sharpened regulatory focus on improving efficiency across coal production, coal power, and coal-chemical processing, aligning approvals and retrofit requirements with national carbon-peaking pathways.
Competitive Landscape
The top five producers, China Energy Investment, China Coal Energy, Shaanxi Coal, Shandong Energy, and Yankuang Energy, controlled about 45% of output in 2025 and leverage integration across mining, rail, and power to defend margins. Shandong Energy’s 2024 merger with Yankuang formed a 600 Mt/yr entity that retired 50 Mt of subscale pits and invested CNY 20 billion in smart-mine upgrades. SOEs focus strategy on three fronts: capacity consolidation, ultra-low-emission retrofits, and automation that lowers costs by up to 30%.
Technology vendors such as Huawei and Hikvision act as disruptors by supplying 5G-enabled autonomous systems to more than 50 mines. Yimin Mine’s 100 autonomous trucks improved productivity 15% and generated 12 patents for collision-avoidance algorithms, signaling a shift toward intellectual-property-driven competitive moats. ESG-linked lending rules issued by the People’s Bank of China in 2024 redirected CNY 300 billion from traditional thermal projects toward clean-coal upgrades, squeezing capital access for tier-2 miners. Smaller private operators lacking balance-sheet resilience face accelerated consolidation, often selling assets to SOEs looking to expand premium reserves or logistics footprints.
White-space opportunities center on coal-to-chemicals and carbon capture. Inner Mongolia Yitai Coal’s 2 GW coal-to-hydrogen pilot captures 90% of CO₂ for enhanced oil recovery, opening a path to monetize low-rank lignite. Meanwhile, the national emissions-trading scheme allocated 5 billion tonnes of allowances in 2025, creating a secondary revenue stream for producers that invest early in capture technology. The competitive narrative thus balances cost-down automation, compliance-driven retrofits, and selective diversification into adjacent value pools, ensuring the China coal market retains resilient but narrowly focused growth prospects over the forecast period.
China Coal Industry Leaders
China Coal Energy Group Co., Ltd.
China Shenhua Energy Company Limited
China Power International Development Limited
Yanzhou Coal Mining Company Limited
Huadian Power International Corporation Limited
- *Disclaimer: Major Players sorted in no particular order


Market Opportunities and Future Outlook
Regulatory direction is shifting value pools away from pure tonnage expansion toward compliance upgrades and toward coal power's role in system flexibility. Under the NEA's Energy Conservation and Carbon Reduction Action Plan (2026-2028), operational upgrades are driven by the requirement for a higher share of coal power capacity to meet benchmark energy-efficiency levels (a 15 percentage point increase over the plan period), supporting demand for ultra-low-emission and efficiency retrofits, flexible-operation modifications, and digital optimization at existing plants. In the market context, this aligns with coal's reliability backstop role for data-center clusters and industrial baseload users, with long-duration offtake arrangements taking priority over spot-driven utility burn.
A second opportunity sits at the intersection of coal, power, and grid balancing under national system planning. The joint NDRC/NEA New-Type Energy System Construction 15th Five-Year Plan (2026-2030) designates wind and solar as dominant power sources (over 50% of installed capacity) and emphasizes system reliability, while the State Council's 15th Five-Year Carbon Peaking Action Plan (July 2026) positions coal power to provide supportive and regulating functions, including coupling with renewables and energy storage. Together, these policies widen the scope for coal-plant flexibility retrofits (deep turndown, faster ramping, heat-electric decoupling in CHP fleets) and for coal producers able to supply stable quality to flexible units and coal-chemical complexes under tighter efficiency and environmental constraints.
Recent Industry Developments
- July 2026: China Power International Development Limited entered into an equity agreement to acquire a 31% equity interest in Tuoli Power for RMB 310,032,147. The transaction provides access to two ultra-supercritical coal-fired generating units in Xinjiang with total capacity of 1,320 MW. The deal expands China Power's exposure to dispatchable generation in a coal-rich inland region, reinforcing coal-plus-power integration where grid reliability and industrial load growth support firm capacity.
- April 2026: China Coal Energy approved new continuing connected transaction agreements covering mutual coal supply and related services with China Energy. The agreements are structured to run from 1 January 2027 to 31 December 2029, extending a long-term commercial framework between major SOE groups. By formalizing multi-year supply and service arrangements, the company improves offtake visibility and operational coordination amid tighter planning controls and consolidation dynamics.
- May 2025: China Huaneng Group deployed 100 autonomous electric trucks at the Yimin open-pit coal mine in Inner Mongolia, working with partners including Huawei's cloud services for route optimization. The initiative enabled higher utilization with always-on operations supported by high-bandwidth connectivity and low latency. Scaling autonomous haulage at a flagship mine raises the competitive bar for productivity and safety, accelerating smart-mine adoption that lowers unit costs for large operators.


Research Methodology Framework and Report Scope
Market Definition and Coverage
We define the China coal market as the value linked to coal supplied for domestic end-use in China, aligned to coal grades and the major consuming sectors that drive demand and pricing behavior.
Scope exclusions: We exclude downstream electricity sales, steel output value, and logistics-only services where coal is not the transacted product.
Segmentation Overview
- By Coal Grade
- Lignite/Low-Rank
- Sub-bituminous
- Bituminous and Coking
- By Application
- Power Generation
- Iron, Steel, and Metallurgy
- Cement and Other Applications
Data Sources, Market Sizing, and Validation
Desk Research
Desk research was used to set hard reference points on coal production, trade balance, and consumption by end-use, so the model starts from observable volumes and policy signals. Public sources such as the National Bureau of Statistics of China, the National Energy Administration, China Coal Industry Association releases, and customs import-export statistics were used to frame the supply and demand picture. We also reviewed publications from agencies such as the International Energy Agency and the World Steel Association to keep steel-linked coal demand and power-sector coal burn in a realistic range.
To translate these signals into a consistent value model, we relied on widely available company filings and investor materials for operational context, and on reputed press coverage for major policy or safety-led supply changes. For some companies where public disclosure is thin, we used paid subscriptions for company financials and intelligence, and for news and financials to cross-check reported operating scale and pricing commentary. This desk list is not exhaustive, and many other sources were also used for data collection, validation, and clarification during the study.
Primary Interviews and Surveys
Primary work was used to pressure-test desk assumptions on realized pricing, grade mix, and how demand shifts across power generation, iron and steel, cement, and other industrial uses. We spoke with a mix of upstream and midstream stakeholders, along with large buyer-side roles, so the supply view and the consumption view could be reconciled. When views diverged, we revisited the drivers, which often came back to contracting practices, regional supply constraints, and short cycle demand swings.
Distribution of primary research fieldwork respondents
| Company type | Respondent position |
|---|---|
| Top tier: 39% | CXOs: 19% |
| Mid tier: 40% | Functional/Unit leaders: 38% |
| Smaller Players: 21% | Managers: 43% |
Market-Sizing & Forecasting
For market sizing, we start from a top-down demand pool rebuild where China coal consumption is aligned to the main end-use buckets and then reconciled with domestic output and import-export movements. The model is then expressed through coal grade and application logic so the demand mix stays realistic when power-sector load, steel activity, or cement output changes.
Key inputs that guide the sizing and forecast include domestic raw coal production trends, import volumes, grade mix between thermal and coking use, and end-use indicators such as thermal power generation levels and crude steel and cement activity signals. Price and value conversion are anchored using representative coal price benchmarks and expected grade premiums, and then checked against what interviewees describe for contract renewals and spot periods. To keep the output practical, we corroborate totals with selective bottom-up checks, such as sampled volume by grade times indicative pricing, and channel checks on how much demand is shifting across major industrial users when policy or weather effects show up.
For forecasting, we used scenario analysis anchored on a base case that reflects consensus expectations on power demand growth, industrial output, and policy-led capacity management. When primary feedback pointed to a different slope for pricing or grade substitution, assumptions were adjusted and rerun, and gaps were handled by applying conservative interpolation between known volume anchors rather than forcing overly granular roll-ups.
Data Validation & Update Cycle
We validate the model by comparing outputs against independent signals such as national production and trade series, end-use activity indicators, and implied coal intensity trends, and then we check whether the direction of change matches on-the-ground feedback. Outliers are reviewed, and if a variance cannot be explained by a clear driver like a policy shift, safety inspections, or demand softness in a consuming sector, the assumption is flagged and revisited. Before sign-off, multiple analyst reviews are run so the logic, units, and conversions are consistent across grades and applications.
Reports are refreshed annually, and interim updates are made when material events affect supply, demand, or pricing expectations. Before delivery, an analyst performs a fresh pass so clients receive the latest updated view rather than a static snapshot.
Mordor Intelligence's China Coal Market Estimate Compared With Other Published Estimates
Published estimates for China coal can look far apart because authors do not always measure the same thing, and they often use different mixes of volume anchors and price assumptions. We see the biggest swings when scope moves between mined coal revenue, traded coal value, and coal linked downstream value, which changes the denominator before any forecasting even starts.
The main gap comes from whether the number is built as a mining industry revenue proxy or as a coal demand value tied to grade and end-use, and in Mordor Intelligence's treatment, coal is counted through grade and application-driven demand signals that are then reconciled with production and trade checks rather than being inflated by downstream power or steel value.
Benchmark comparison
| Source | Market Size | Gaps in Research Methodology |
|---|---|---|
| Mordor Intelligence | USD 0.00 B (2026) | |
| Industry Database A | USD 425.10 B (2025) | Often tracks coal mining industry revenue, which can include broader mining services and accounting effects, and it may not separate thermal versus coking grade mix and end-use driven pricing movements in the same way. |
| Trade Journal B | USD 51.39 B (2024) | Commonly mixes global market framing with China commentary, which can compress China-specific value by relying on generic price baselines or partial traded volumes instead of a China demand and grade weighted build. |
The spread in the table is mainly explained by what is being monetized and which price logic is used to convert physical coal flows into value. By keeping the inputs tied to observable supply-demand series and then adjusting assumptions only after targeted validation, our estimate stays traceable to repeatable steps that a buyer can audit.


Key Questions Answered in the Report
How large will China's coal sector be by 2031?
China coal market size is forecast to reach 5.09 billion tonnes by 2031, growing at a 0.63% CAGR during 2026-2031.
Which coal grades command the highest demand in China?
Bituminous and coking grades lead with 67.3% share in 2025 and will expand further due to sustained blast-furnace steel output.
Why is industrial coal demand rising faster than utility demand?
Cement, coal-chemical, and metallurgy users lock in long-term contracts and expand capacity, while renewables and storage curb utility coal burn.
Which provinces dominate coal output?
Shanxi, Shaanxi, and Inner Mongolia together supply more than 70% of national production but face water-stress constraints.
How are smart mines changing the cost structure?
5G-enabled autonomous haulage, AI maintenance, and real-time methane monitoring reduce operating costs by up to 30% and improve safety, widening the gap between SOEs and smaller miners.
What impact do China's carbon-peaking and neutrality pledges have on coal?
Stricter permitting cuts the approval rate for new projects, channels investment into clean-coal upgrades, and limits long-term growth of traditional thermal capacity.
Page last updated on:


 Your data is secure and never sold or shared.


