
Market Overview
| Study Period | 2021 - 2031 |
|---|---|
| Forecast Data Period | 2026 - 2031 |
| Base Year Market Size (2025) | USD 38.75 Billion |
| Market Size (2026) | USD 44.16 Billion |
| Market Size (2031) | USD 83.73 Billion |
| Growth Rate (2026 - 2031) | 13.65 % |
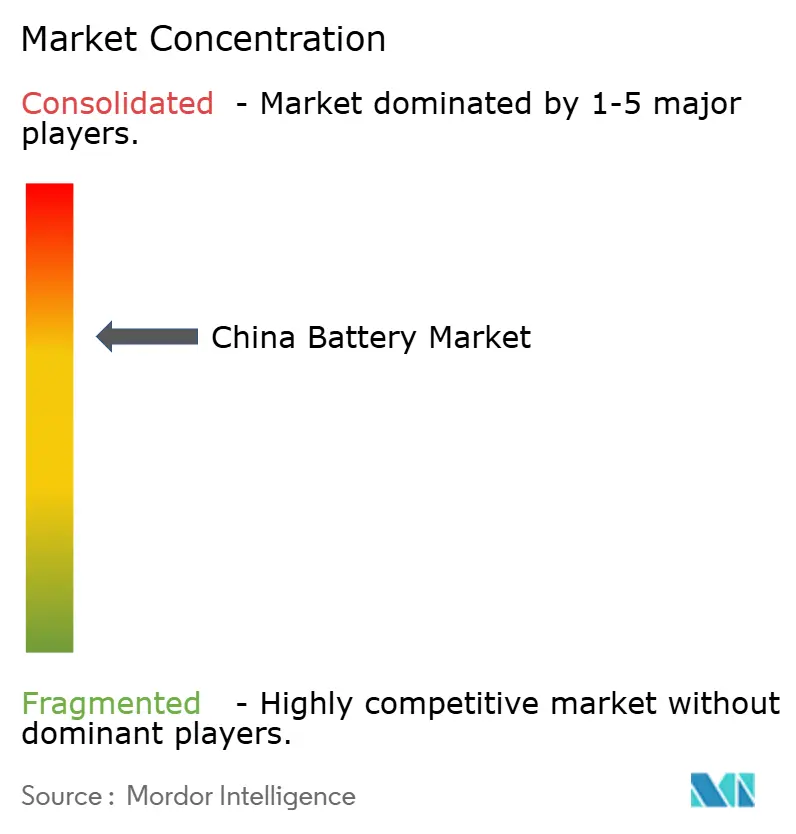
| Market Concentration | Medium |
Major Players
*Disclaimer: Major Players sorted in no particular order Image © Mordor Intelligence. Reuse requires attribution under CC BY 4.0. |
|
China Battery Market Analysis by Mordor Intelligence
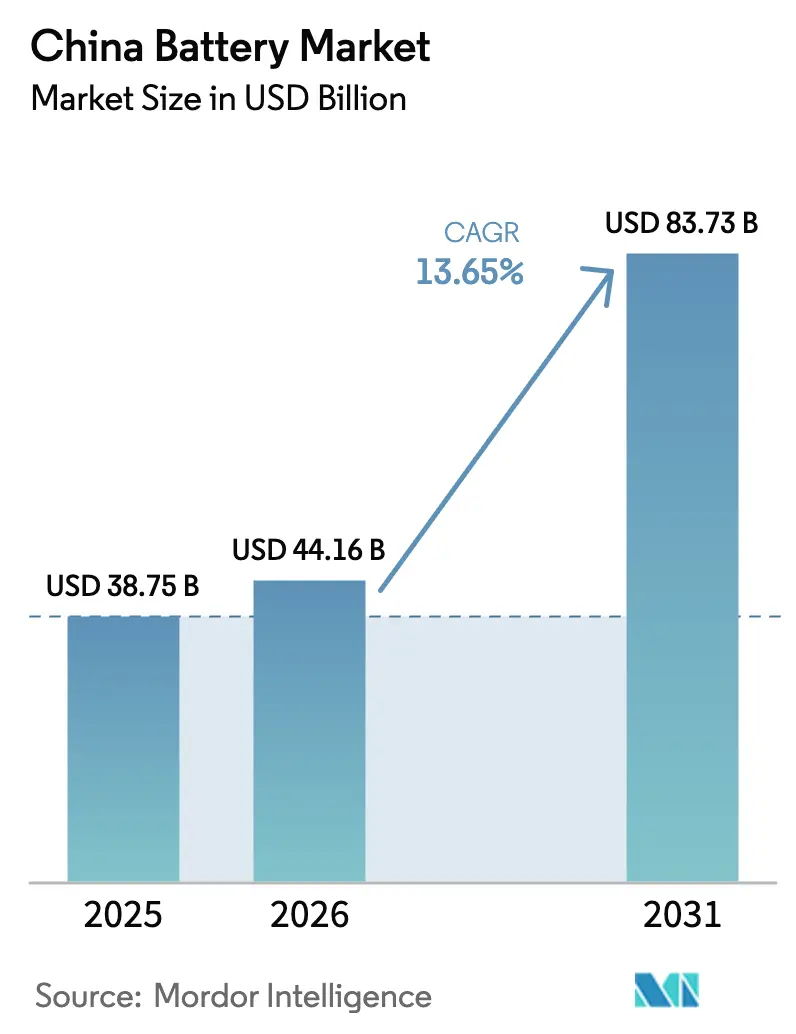
The China Battery Market was valued at USD 38.75 billion in 2025 and expected to grow from USD 44.16 billion in 2026 to reach USD 83.73 billion by 2031, at a CAGR of 13.65% during the forecast period (2026-2031).
The expansion is driven by nationwide new-energy-vehicle (NEV) mandates that widen lithium-ion adoption into second- and third-tier cities, a grid-scale storage boom designed to absorb renewable curtailment, and vertical integration strategies that compress supply-chain costs. Aggressive capacity additions totaling 1.3 TWh have lowered cell production lead times but have also raised the risk of near-term oversupply that could pressure margins. Provincial recycling quotas enacted in 2024 enhance secondary raw-material streams, easing reliance on imported lithium and reinforcing the closed-loop advantage for integrated manufacturers. Preferential value-added-tax (VAT) rebates on domestic cathode precursors further tilt cost curves in favor of local suppliers.
Key Report Takeaways
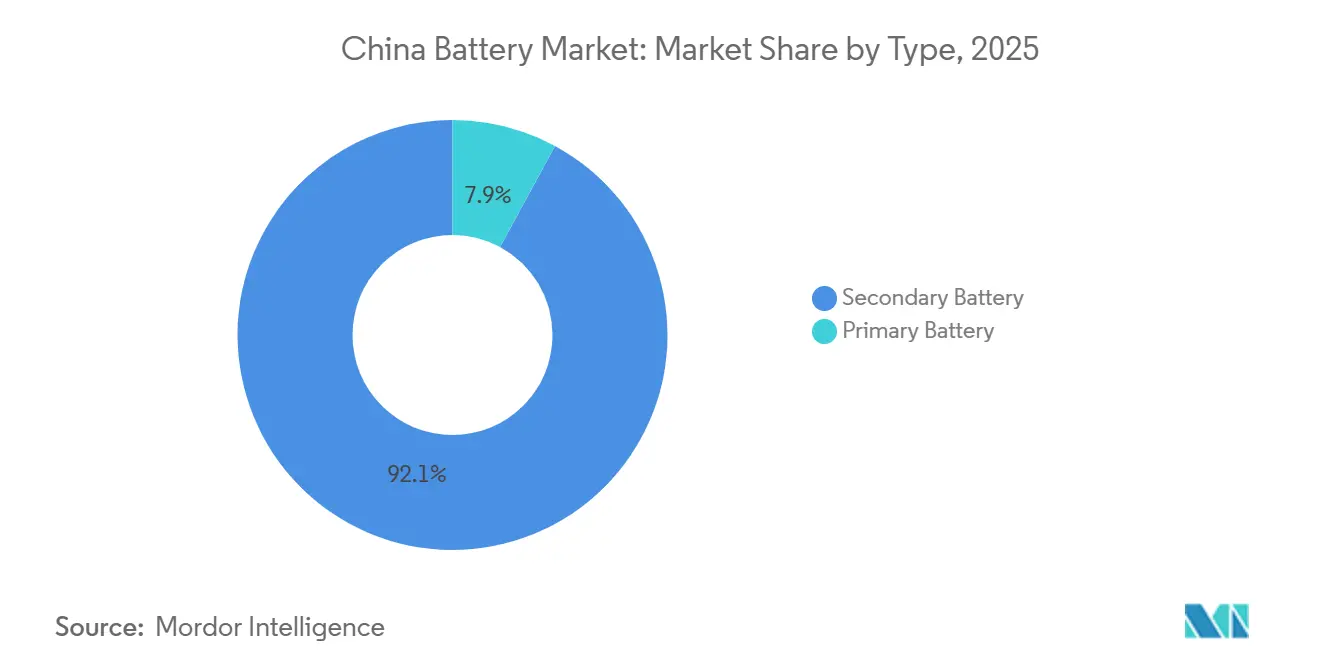
- By type, secondary batteries held 92.1% of China's battery market share in 2025; primary batteries are forecast to trail at a single-digit CAGR through 2031.
- By technology, lithium-ion dominated with a 75.5% share in 2025, while sodium-ion is expected to register the fastest CAGR of 18% between 2026 and 2031.
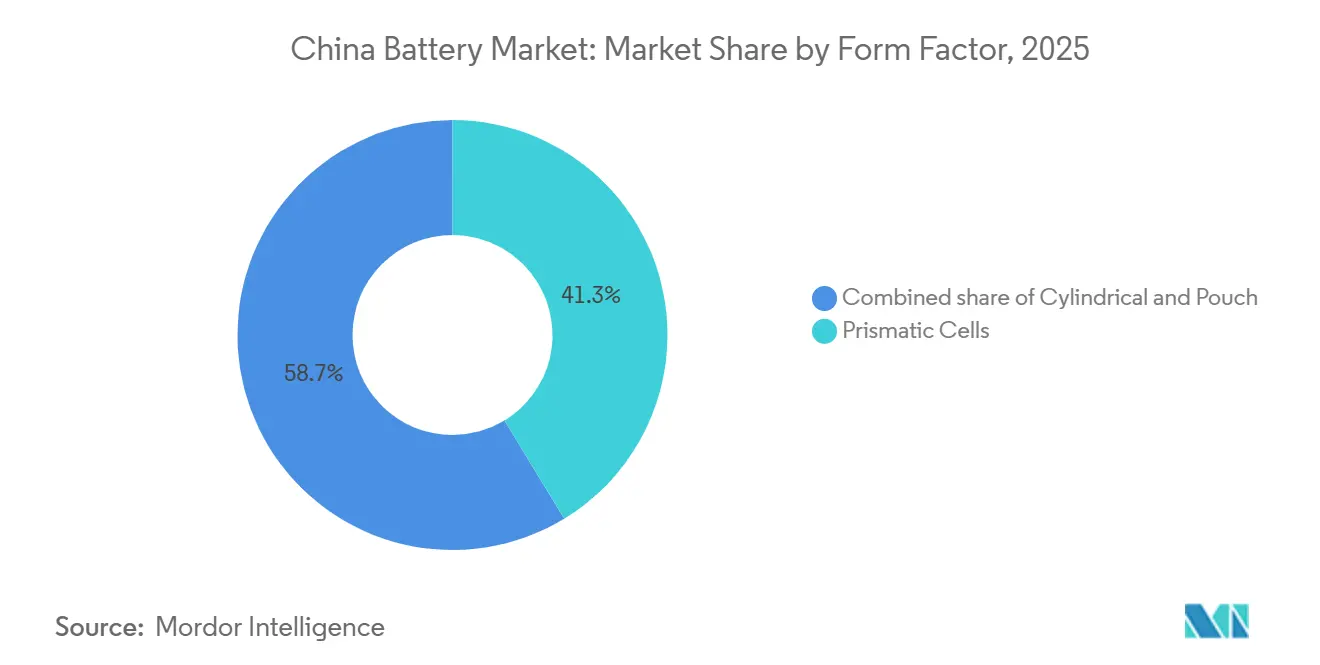
- By form factor, prismatic cells led with 41.3% revenue share in 2025, whereas pouch cells are projected to expand at an 18.1% CAGR.
- By application, automotive accounted for 60.2% of China's battery market size in 2025, and energy storage systems are set to advance at a 16.5% CAGR through 2031.
- By company, Contemporary Amperex Technology Co. Limited retained 36.7% of the China battery market share in 2025, and BYD followed with 17.9%.
Note: Market size and forecast figures in this report are generated using Mordor Intelligence’s proprietary estimation framework, updated with the latest available data and insights as of January 2026.
China Battery Market Trends and Insights
Drivers Impact Analysis*
| Driver | (~) % Impact on CAGR Forecast | Geographic Relevance | Impact Timeline |
|---|---|---|---|
| Nationwide NEV Mandates Driving Lithium-Ion Demand Surge in Tier-2 & 3 Cities | +3.2% | National, with accelerated adoption in Jiangsu, Zhejiang, Sichuan, Hubei | Medium term (2-4 years) |
| Grid-Scale Storage Boom Triggered by 30% Renewable Curtailment Targets | +2.8% | National, concentrated in Inner Mongolia, Gansu, Xinjiang, Qinghai | Medium term (2-4 years) |
| Price Parity of LFP Packs (< USD 80/kWh) Accelerating Lead-Acid Replacement | +2.1% | National, strongest in industrial and two-wheeler segments | Short term (≤ 2 years) |
| Vertical Integration by CATL & BYD Reducing Supply-Chain Bottlenecks and Costs | +1.9% | National, with spillover to Southeast Asia manufacturing hubs | Long term (≥ 4 years) |
| Provincial Recycling Quotas Creating Secondary Raw-Material Stream for New Cells | +1.5% | National, early implementation in Guangdong, Jiangsu, Shandong | Long term (≥ 4 years) |
| Preferential VAT Rebate on Domestic Battery Materials Boosting Local Production | +1.2% | National, benefiting cathode and anode material producers | Medium term (2-4 years) |
| Source: Mordor Intelligence | |||
Nationwide NEV Mandates Driving Lithium-Ion Demand Surge In Tier-2 And Tier-3 Cities
Tier-2 and Tier-3 municipalities now match coastal EV adoption targets, propelled by 2024 subsidies that cover up to 15% of battery pack costs. Sixty percent of China’s vehicle sales occur in these cities, making infrastructure pivotal; 120,000 public fast-charging stations deployed in 2025 eliminated range anxiety and unlocked an estimated 50 GWh of new cell demand. Automakers responded with sub-USD 15,000 models fitted with 40-50 kWh LFP packs, delivering total-cost-of-ownership parity with internal-combustion cars. Battery makers strategically position gigafactories near local assembly lines, shrinking logistics costs and compressing delivery cycles. This localization fragments market share, allowing smaller suppliers to secure captive contracts and challenge incumbents outside coastal hubs.
Grid-Scale Storage Boom Triggered By 30% Renewable Curtailment Targets
Curtailment rates reached 30% in renewable-rich provinces during 2024, prompting mandatory co-located storage for projects above 100 MW. Utility-scale battery installations hit 73.76 GW in 2024 and are on course for 180 GW by 2027. CATL’s Tener LFP system delivers 6,000 cycles, matching 15-year power-purchase agreements and lowering coal-peaking reliance. Adoption of pouch cells improves thermal management and shrinks container footprint by 20% compared with prismatic equivalents. Enforcement of GB 44240-2024 safety norms in August 2025 accelerates modern system uptake, as legacy installations failed propagation tests.
Price Parity Of LFP Packs Accelerating Lead-Acid Replacement
Pack-level LFP costs slipped below USD 80/kWh in early 2025, undercutting lead-acid alternatives on a lifecycle basis. The 3,000-cycle longevity of LFP trounces the 500-cycle life of lead-acid, eliminating the latter’s upfront cost edge. Industrial forklifts, telecom towers, and two-wheelers retrofitted LFP modules, creating an incremental 15 GWh of demand in 2025. BYD’s Blade Battery reached USD 75/kWh by removing module housings, driving legacy suppliers to pivot or exit. Lead-acid’s share slid from 18% in 2024 to 12% in 2025, and forward cost curves signal further erosion toward 2027.
Vertical Integration By CATL And BYD Reducing Supply-Chain Bottlenecks And Costs
Backward integration into lithium refining and separator film production trims bill-of-material costs by up to 15% versus non-integrated peers. CATL’s Jiangxi hydroxide facility secured 40,000 t/yr, sheltering margins from lithium spot volatility. BYD’s in-house separator lines cut lead times to four weeks, enabling rapid new-product introduction. The companies’ recycling plants re-inject recovered metals, lowering virgin-material purchases by 20% by 2027. Smaller rivals lack capital for end-to-end footprints and remain exposed to input shocks.
Restraints Impact Analysis*
| Restraint | (~) % Impact on CAGR Forecast | Geographic Relevance | Impact Timeline |
|---|---|---|---|
| Imminent Overcapacity Risk from 1.3 TWh Announced Cell Plants Depressing Margins | -2.4% | National, with acute pressure in Jiangsu, Guangdong, Fujian | Short term (≤ 2 years) |
| Regulatory Cap on New Coal-Power for Cathode Processing Limiting Energy Cost Advantage | -1.6% | National, concentrated in Hunan, Sichuan, Yunnan cathode hubs | Medium term (2-4 years) |
| Critical Mineral Import Volatility amid Indonesia & DRC Export Policy Shifts | -1.3% | National, with upstream exposure in nickel and cobalt supply chains | Medium term (2-4 years) |
| Intensifying IP Litigation on Solid-State Electrolyte Patents Delaying Commercialization | -0.9% | National, affecting R&D timelines for CATL, BYD, CALB, WeLion | Long term (≥ 4 years) |
| Source: Mordor Intelligence | |||
Imminent overcapacity risk from 1.3 TWh cell plants depressing margins
Planned capacity outstrips 2026 demand of 600 GWh, implying sub-50% utilization and a price ceiling near USD 70/kWh that could trigger distress among thinly capitalized producers.[1]Staff Reporter, “Battery Overcapacity Looms,” Bloomberg, bloomberg.com Policy barriers restrict export relief, and anti-dumping tariffs in the United States and Europe narrow outlets for surplus cells. Larger incumbents can carry negative margins temporarily, but smaller firms risk liquidity crunches by 2027. The dynamic echoes the solar shakeout of the 2010s, where overbuild forced consolidation. Asset sales and restructurings are likely once creditors enforce covenants.
Regulatory Cap On New Coal-Power For Cathode Processing Limiting Energy Cost Advantage
The 2024 halt on coal plants in cathode hubs raises power tariffs by up to 40%, erasing China’s historical energy-cost edge over overseas rivals.[2]Staff Reporter, “CATL Launches Million-Mile Cell,” Bloomberg, bloomberg.com Precursor calcination consumes 15 kWh/kg, so cost inflation pushes producers to relocate to hydropower provinces or import renewables at premium rates. Expansion timelines slip by 18 months as firms await clean-power permits, reducing near-term supply elasticity. The rule narrows the landed-cost gap for high-nickel chemistries produced in Korea and Japan, shifting some demand offshore. Producers must accelerate energy-efficiency upgrades or face margin erosion.
*Our forecasts treat driver/restraint impacts as directional, not additive. The impact forecasts reflect baseline growth, mix effects, and variable interactions.
Segment Analysis
By Type: Secondary Batteries Anchor Market Structure
Secondary batteries occupied 92.1% of the Chinese battery market share in 2025, expanding at a projected 13.9% CAGR as NEV penetration hit 38% of passenger-car sales. Primary batteries remain niche, constrained by regulatory disposal costs and miniaturization of energy-harvesting devices. CATL’s Qilin cell guarantees 1.5 million km, extending vehicle service life to 15 years and improving total ownership economics.[3]Staff Reporter, “Tesla’s Shanghai Megafactory Comes Online,” Reuters, reuters.com Second-life programs turn retired automotive packs into stationary assets, doubling revenue per kilowatt-hour harvested from each cell.
Lead-acid’s decline accelerates as LFP cycle life multiples erase remaining cost advantages. Electric two-wheelers retrofit lithium packs that pay back within 18 months, and industrial battery suppliers recorded 25% sales falls in 2025. The secondary segment’s CAGR is therefore chemistry-substitution driven rather than pure demand growth, underscoring the need for strategic positioning as legacy chemistries fade.


By Technology: Lithium-Ion Dominance Reshapes Chemistry Mix
Lithium-ion retained 75.5% share in 2025 and is forecast to grow at 14.8% through 2031, reinforcing its leadership in the Chinese battery market. Within lithium-ion, LFP captured roughly 70% of automotive cell shipments, buoyed by lower costs and cobalt-free bills of material. Blade and M3P variants extend LFP’s range applicability, eroding the nickel-rich chemistry share.
Sodium-ion commercial shipments started in 2025 at 160 Wh/kg, positioning the chemistry for sub-USD 10,000 vehicles and stationary storage where volumetric density is less critical. Solid-state remains pilot-scale due to IP disputes and manufacturing yields. Together, emerging chemistries diversify supply risk, though lithium-ion’s economic moat holds firm through 2031.
By Form Factor: Pouch Gains Ground On Flexibility
Prismatic cells led with 41.3% of the share in 2025, benefiting from entrenched automotive pack standards. However, pouch formats will post an 18.1% CAGR on weight savings and flexible geometries that raise volumetric efficiency by up to 8% per vehicle. LG Energy Solution and SK On champion pouch adoption via joint ventures that meet European OEM specifications.
Capital intensity remains higher for pouch lines, yet energy-density advantages justify premiums in performance-sensitive segments. CATL’s 2025 introduction of a pouch Qilin variant signals a strategic hedge against potential share loss, while cylindrical cells hold niche relevance in modular energy storage.
By Application: Energy Storage Systems Outpace Automotive Growth
Automotive allocated 60.2% of the China battery market size in 2025, but energy storage posts the highest 16.5% CAGR as grid operators target 180 GW of installed capacity by 2027. Passenger cars account for three-quarters of automotive demand, yet logistics fleets grow quickly under zero-emission zones.
Utility-scale storage, averaging 100 MWh installations, captures 70% of the segment and cycles daily to shift solar output to evening peaks. Industrial batteries migrate from lead-acid to lithium, and portable electronics track device shipments. The application mix tilts toward stationary use, favoring cost-effective chemistries such as LFP and sodium-ion.
Geography Analysis
Guangdong anchors 55% of national cell output through BYD and CATL complexes, leveraging proximity to electronics supply chains. Jiangsu and Zhejiang specialize in pouch production for export-oriented automakers, while Sichuan and Hunan dominate cathode precursors near lithium and manganese deposits. Tesla’s 40 GWh Shanghai Megafactory underscores the imperative of local production to avoid tariffs.[4]Staff Reporter, “Tesla’s Shanghai Megafactory Comes Online,” Reuters, reuters.com
Provincial competition for investment fragments capacity across 20 provinces via land subsidies and tax holidays. Jiangsu’s 50% land discounts lured CALB’s 30 GWh expansion, while Sichuan offers hydropower contracts to attract low-carbon cathode projects. Recycling mandates requiring in-province processing spur localized hydrometallurgical plants, deepening closed-loop advantages.
Western provinces with high curtailment rates, such as Qinghai and Xinjiang, emerge as energy-storage hubs. Smaller manufacturers target these markets to avoid head-to-head competition with CATL and BYD in automotive clusters, trading scale for niche margins.
Regulatory Landscape
China tightened governance across battery safety, recycling, and sustainability reporting, with the Ministry of Industry and Information Technology (MIIT) coordinating industrial compliance. GB/T 31486-2024 traction-battery performance requirements took effect on April 1, 2025, raising test and validation expectations for automotive packs and reinforcing the shift toward standardized qualification pathways for suppliers selling into OEM programs.
Recycling oversight moved from provincial experimentation toward national implementation in 2026. The Provisional Measures for the Management of Recycling and Comprehensive Utilization of Retired Power Batteries for New Energy Vehicles, issued on December 31, 2025, entered into force on April 1, 2026, and formalized lifecycle supervision through an MIIT-managed national traceability information platform. MIIT also continued to gatekeep capacity and quality through its enterprise lists for the Lithium-ion Battery Industry Standard Conditions (2024 Edition) and, from April to June 2026, joined four other departments in a special joint enforcement action targeting standardized recycling and utilization practices. In parallel, MIIT introduced carbon-footprint declaration requirements for automotive power batteries under a trial period through December 31, 2026, with normalized management beginning January 1, 2027. This raises the bar for data collection, third-party verification, and supplier transparency.
Competitive Landscape
Market concentration remains moderate as CATL controls 36.7% of the share and BYD holds 17.9%, yet more than 15 gigawatt-scale rivals sustain fierce price competition. CALB’s EUR 2 billion Portugal plant exemplifies internationalization to hedge against trade barriers, while EVE Energy’s cylindrical specialization delivered 22% revenue growth in 2025.
Vertical integration defines leadership strategy, allowing CATL and BYD to debut chemistries such as M3P in 18 months from lab to scale. Foreign entrants recalibrate China exposure in light of export controls exceeding 300 Wh/kg density thresholds, with Panasonic trimming shipments by 30% in 2025. Compliance with GB 44240-2024 thermal standards reorders competitiveness, favoring suppliers with robust safety engineering.
White-space opportunities persist in sodium-ion, solid-state, and ultra-fast-charging technologies where intellectual property remains unsettled, enabling agile firms to secure early licensing revenue. Consolidation pressure will intensify if overcapacity drives sustained sub-USD 70/kWh pricing.
China Battery Industry Leaders
-
Contemporary Amperex Technology Co Ltd
-
BYD Company Limited
-
CALB Group Co., Ltd.
-
EVE Energy Co Ltd
-
Gotion High tech Co Ltd
- *Disclaimer: Major Players sorted in no particular order

Market Opportunities and Future Outlook
Policy and investment signals are concentrating opportunity in two adjacent lanes: grid-scale and long-duration storage build-out, and next-generation chemistries receiving differentiated attention. On the deployment side, China set a national target of 300 GW of new energy storage by 2030 under the 15th Five-Year Plan framework. Market structure data through early 2026 shows standalone storage systems taking a large share of new installations (84.7% of new capacity additions between January and April 2026).
These dynamics create near-term whitespace for domestic suppliers that can deliver standardized containerized systems, higher-cycle LFP solutions aligned with safety requirements, and dedicated long-duration storage manufacturing lines, as reflected by Zenergy Battery signing a 50 GWh long-duration storage manufacturing project in Suzhou (CNY 5.2 billion investment) in March 2026. On the supply side, major players are placing capital behind both scale and chemistry diversification, expanding partnering and localization openings for materials, pack integrators, and downstream users. EVE Energy disclosed a 230 GWh capacity expansion plan across Hubei, Guangdong, Jiangsu, and Fujian (CNY 23 billion investment) in April 2026, and CATL announced a 40 GWh sodium-ion capacity expansion in Fujian (CNY 5 billion investment) in May 2026, highlighting where new lines and supplier ecosystems are being built. A demand-pull and incentive lever emerged in July 2026, when the Ministry of Finance announced a consumption tax on lithium-ion batteries starting September 1, 2026 (2%, rising to 4% in September 2027), while sodium-ion and solid-state batteries remain exempt until end-2028. This shifts the commercial case for pilots and early procurement programs that move stationary and entry-level mobility applications toward exempt chemistries where performance requirements allow.
Recent Industry Developments
- July 2026: CALB signed a procurement agreement with Japan-based Kitahama GRF Co., Ltd. for a 220 MWh energy storage system. The deal strengthens CALB’s position in overseas stationary storage deliveries and ties its product roadmap to bankable project execution outside China.
- June 2026: BYD demonstrated its FLASH Charging capability in the UK for vehicles equipped with the 2nd Generation Blade Battery, showcasing charging from 5% to 70% in five minutes and 10% to 97% in nine minutes. The milestone highlights the performance race around fast charging and reinforces how cell design and thermal management are becoming key differentiators for EV adoption and platform selection.
- November 2024: CATL and Chery announced a collaboration on solid-state sodium-ion batteries targeting commercialization in 2027. The partnership links a leading cell maker with an automotive OEM to shorten validation cycles for emerging chemistries and broaden the future supply base beyond conventional lithium-ion.


Research Methodology Framework and Report Scope
Market Definition and Coverage
For this report, the China battery market is measured as the value of new electrochemical cells and assembled battery packs sold within China across major end uses such as automotive, stationary storage, industrial, and portable electronics.
Scope exclusions: We exclude upstream mining and refining of raw materials, battery manufacturing equipment, and standalone battery management electronics.
Segmentation Overview
-
By Type
- Primary Battery
- Secondary Battery
-
By Technology
- Lead-acid Battery
- Lithium-ion Battery
- Other Technologies (Ni-MH, Zinc-air, Sodium-ion, Solid-State Prototype)
-
By Form Factor
- Cylindrical
- Prismatic
- Pouch
-
By Application
- Automotive (Passenger Electric Vehicles and Commercial Electric Vehicles)
- Energy Storage Systems (Utility-Scale and Commercial and Industrial)
- Industrial Batteries
- Portable Electronics
- Others (Medical Devices, Defence, Marine)
Data Sources, Market Sizing, and Validation
Desk Research
We start by mapping the market using public statistics and technical references, so the model keeps consistent units, timelines, and a clear China-only boundary. Typical starting points include official sources such as the National Bureau of Statistics of China for industrial output trends, the General Administration of Customs for battery trade flows, and MIIT announcements for industry production signals, which help us sanity-check direction and relative scale.
We then cross-check the desk view using sources that explain demand drivers and product mix, such as China Association of Automobile Manufacturers releases for vehicle production context, peer reviewed journal articles for chemistry and cost trends, and company filings and investor presentations for revenue splits and capacity additions. We also use select paid subscriptions to pull structured company financials, patent activity, and shipment or trade datasets where public series are published with delays. This list is illustrative only, and we used additional sources to collect data, validate assumptions, and close open questions.
Primary Interviews and Surveys
To make sure the sizing reflects how batteries are actually sold and priced in China, we run expert interviews and short surveys with manufacturers, pack assemblers, distributors, and large buyer groups across mobility, energy storage, and industrial use cases. Respondent input is used to confirm typical price ranges, mix shifts (for example, form factors and chemistries), and the timing of demand changes across provinces, and then to close gaps that desk sources cannot fully explain.
Distribution of primary research fieldwork respondents
| Company type | Respondent position |
|---|---|
| Top tier: 30% | CXOs: 16% |
| Mid tier: 54% | Functional/Unit leaders: 34% |
| Smaller Players: 16% | Managers: 50% |
Market-Sizing & Forecasting
The main build is a top-down demand pool assessment, where national indicators are translated into battery value by application and then summed to a China total. We use signals such as EV and commercial vehicle output, installed energy storage additions, consumer electronics production trends, and published battery production volumes. We then convert these volumes into value using realistic price paths and mix assumptions.
Those totals are checked with selective bottom-up approximations, mainly supplier and channel roll ups from a sampled set of cell and pack revenues, followed by spot checks on implied ASP times volume. When a revenue line cannot be cleanly allocated to China-only sales or to cells versus packs, we apply conservative allocation rules and test them again in interviews to avoid double counting.
For the forecast, scenario analysis is used because growth is shaped by policy direction, capacity ramp rates, and application mix changes that do not move in a straight line. Assumptions on chemistry mix (for example, lithium-ion versus lead-acid share), average pack pricing progression, and utilization changes are stress tested with primary inputs before the final 2026 to 2031 path is locked.
Data Validation & Update Cycle
We validate the model by triangulating the final market value against independent signals such as production volumes, trade values, and demand-side activity. We also check whether the implied average prices stay realistic across end uses. Outliers are reviewed, and if a variance cannot be tied to a known event like a price drop or a demand surge, we reopen and rework the underlying driver assumptions.
Before sign-off, the work goes through multiple internal review steps, including logic checks across tables and year-to-year continuity checks so the narrative aligns with the calculations. Reports are refreshed annually, and interim updates are done when material events occur, followed by a final pre-delivery pass so clients receive the latest view.
Mordor Intelligence's China Battery Market Size Compared Against Other Published Estimates
Published figures for China batteries can differ widely, even when they refer to similar technology categories, because each source uses a different product boundary, pricing point in time, and treatment of packs versus cells. Differences also show up when one estimate relies on shipment volume signals and another is built from revenue disclosures, which can shift totals when mix changes quickly.
Some public estimates cover only lithium-ion, or they include adjacent revenue pools such as battery materials or battery management electronics, which moves the value up or down depending on what is included. In Mordor Intelligence, the scope is limited to the sales value of new primary and secondary cells and assembled packs sold inside China, and it excludes mining and refining, manufacturing equipment, and standalone BMS revenue so the model stays traceable to battery demand and pricing.
Benchmark comparison
| Source | Market Size | Gaps in Research Methodology |
|---|---|---|
| Mordor Intelligence | USD 38.75 B (2025) | |
| Trade Journal A | USD 66.98 B (2024) | Uses export value for various battery types as the main metric, which can overstate the domestic market because it mixes external shipments with China demand and reflects trade pricing and currency timing. |
| Industry Association B | USD 165.00 B (2024) | Infers market value from lithium battery production volume and an average value per kWh, and the total is sensitive to assumed pack ASP and whether the conversion includes broader lithium battery industry output value beyond battery sales. |
The table shows that the widest gaps come from using trade value or production based conversions that do not separate domestic sales, cells versus packs, and non-battery revenue pools in the same way. By keeping the scope tight and then pressure testing prices and mix changes through interviews, we arrive at a market value that can be rebuilt each year from clear variables and repeatable steps.


Key Questions Answered in the Report
What is the current value of the China battery market?
The China battery market size stands at USD 44.16 billion in 2026.
How fast is the sector expected to grow?
The market is forecast to record a 13.65% CAGR between 2026 and 2031.
Which segment is expanding the fastest?
Energy storage systems lead growth with a 16.5% CAGR through 2031.
Why are pouch cells gaining traction?
Pouch formats offer 10-15% weight savings and flexible geometries that improve vehicle range.
What risks could slow market growth?
Overcapacity, critical mineral volatility, and solid-state patent litigation pose downside risks.
Page last updated on:


 Your data is secure and never sold or shared.


