Market Overview
| Study Period | 2017 - 2028 |
|---|---|
| Base Year For Estimation | 2023 |
| Forecast Data Period | 2024 - 2028 |
| Market Size (2024) | USD 13.16 Billion |
| Market Size (2028) | USD 16.90 Billion |
| Growth Rate (2024 - 2028) | 6.45% CAGR |
| Market Concentration | Low |
Major Players*Disclaimer: Major Players sorted in no particular order Image © Mordor Intelligence. Reuse requires attribution under CC BY 4.0. |
|

China Adhesives Market Analysis by Mordor Intelligence
The China Adhesives Market size is estimated at 13.16 billion USD in 2024, and is expected to reach 16.90 billion USD by 2028, growing at a CAGR of 6.45% during the forecast period (2024-2028).
The Chinese adhesives industry is experiencing significant transformation driven by evolving end-user requirements and technological advancements. The construction and packaging sectors collectively account for approximately 54% of total adhesive consumption, highlighting the industry's strong dependence on these sectors. The packaging adhesives sector has witnessed remarkable growth, with the number of large-scale companies reaching 8,831 in 2021. This growth is further amplified by the rapid expansion of e-commerce and changing consumer preferences, leading to increased demand for innovative packaging adhesives solutions. The smart packaging industry is projected to reach USD 34 billion by 2024, indicating substantial opportunities for adhesive manufacturers.
The construction sector continues to be a major growth driver for the China market, with China maintaining its position as the world's largest construction market. The sector is projected to grow at an annual average rate of 8.6% between 2022 and 2030, despite challenges such as an aging population and economic adjustments. A notable trend is the increasing adoption of prefabricated construction, with prefabricated buildings expected to account for 30% of new buildings by 2025. This shift is creating new opportunities for specialized construction adhesives solutions that cater to modern construction techniques and sustainability requirements.
The automotive sector, particularly the electric vehicle (EV) segment, is emerging as a crucial market for advanced automotive adhesives solutions. The industry's transition towards lightweight materials and electric powertrains has intensified the demand for specialized bonding solutions. The furniture industry is another significant consumer of wood adhesives, with revenues expected to reach USD 76.78 billion in 2022. This growth is driven by urbanization, rising disposable incomes, and increasing demand for modern furniture solutions that require advanced bonding technologies.
Environmental sustainability has become a central focus in the Chinese adhesives market, with manufacturers increasingly developing eco-friendly solutions. The industry is witnessing a shift towards water-based and solvent-free industrial adhesives in response to stringent environmental regulations and growing consumer awareness. Recent design and building trends emphasize sustainable materials and environmentally responsible construction practices, driving innovation in adhesive formulations. This transformation is particularly evident in the packaging and construction sectors, where manufacturers are developing new solutions that combine performance with environmental sustainability.
China Adhesives Market Trends and Insights
Rapid growth of the food and beverage industry and rising demand for lightweight and flexible packaging to boost the China packaging demand
- Packaging is one of the fast-growing industries in terms of design and technology for protecting and enhancing products’ safety and longevity. The food and beverage sector contributes a major share of the packaging industry in China. The food and beverage sector registered nearly USD 595 billion in 2019, more than 7.8% higher than the previous year. Owing to its high production capacity, China has positioned itself as a major exporter of food and drinks worldwide.
- Due to the COVID-19 pandemic, the country-wide lockdowns and temporary shutdown of manufacturing facilities caused several issues, including supply chain disruptions and imports and exports trade. As a result, the country's packaging production declined by 8% in 2020 compared to the previous year, significantly affecting the market. Packaging production is majorly driven by plastic packaging in the country, which nearly accounted for around 79% of the packaging produced in 2021. With the growing demand for lightweight and flexible packaging for a variety of applications, the plastic production segment is likely to register the fastest growth of around 6.58% CAGR during the projected period.
- The growth of the packaging industry in China is mainly attributed to the rising middle-class population, improvement of the supply-chain system, and emerging e-commerce activities over the years. Furthermore, the growing attention to food safety and quality in post-pandemic times across the nation is likely to drive the food processing industry, which will further contribute to the packaging demand in the coming years.

Understand The Key Trends Shaping This Market
Download PDF
Owing to government policies, EVs demand in China is rising and is likely to propel the automotive production
- China's automotive market for passenger vehicles is the largest in the world, as it accounted for 21.41 million units in 2021 compared to other major global players such as Japan, the United States, and Germany. This number is expected to grow at the same pace because of the increasing production capacity of automotive companies post-pandemic in China, as BYD, which is a local electric vehicle manufacturer in China, holds 8.84% of total electric vehicle production in the world.
- China, being the epicenter of the COVID-19 pandemic, witnessed huge losses in the automotive industry in 2020 as it led to nationwide lockdowns, supply chain disruptions, lack of human resources availability, etc. This was the reason for the negative Y-o-Y growth rate in China in 2020.
- The Chinese government's policies for electric vehicle owners, such as time-limited purchase subsidies, traffic regulations waivers, and charging rebates for EV owners, have encouraged the sale and demand for EVs in China. The sales of electric vehicles are expected to reach 7,526 thousand in 2027. EV production in China increased from 1 million units in 2019 to 3.5 million units in 2021, and it is expected to record a 15.07% CAGR in the forecast period (2022-2028).
- Shanghai Automotive Industry Corporation is China's largest automotive company in terms of production. The growth in the number of both passenger and commercial vehicles manufactured by SAIC is significant, as it increased from nearly 2 million units in 2019 to 7 million units in 2021. This growth trend shows that the Chinese automotive market is expected to grow steadily during the forecast period.

Understand The Key Trends Shaping This Market
Download PDF
OTHER KEY INDUSTRY TRENDS COVERED IN THE REPORT
- Growing general aviation opportunities to boost the aerospace industry
- In addition to being the largest footwear manufacturer and exporter, the usage of automation and robotics in production lines to reduce production cost, the footwear industry is likely to propel
- Housing, hospitals, and healthcare facilities schemes by the Chinese government to lead the construction in the country
- As the country's disposable income of urban households is increasing, the growing furniture spending to lead the woodworking and joinery demand
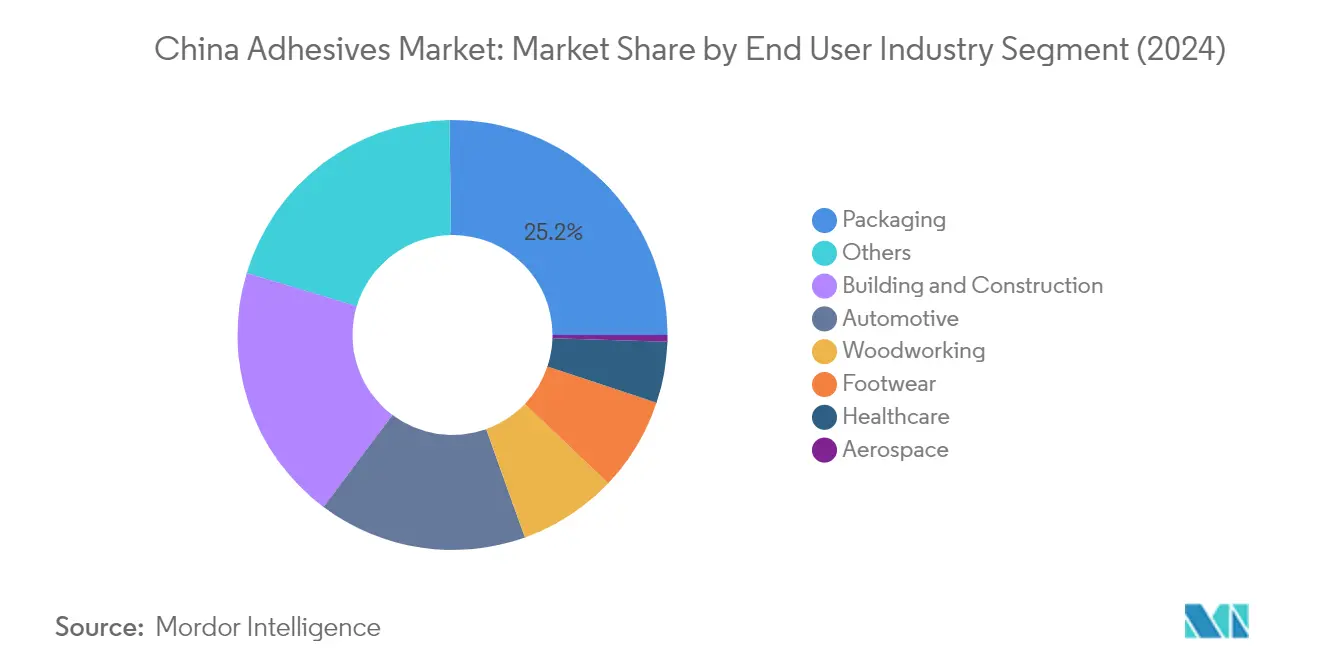
Segment Analysis: End User Industry
Packaging Segment in China Adhesives Market
The packaging segment dominates the China adhesives market, accounting for approximately 25% of the total market value in 2024. This significant market share is primarily driven by China's position as a global packaging manufacturing hub and the rapid growth of e-commerce activities. The segment's growth is further supported by the increasing demand for sustainable and eco-friendly packaging solutions, particularly in the food and beverage sector. The packaging industry in China has witnessed substantial technological advancements in flexible packaging applications, which has directly contributed to the high consumption of hot melt adhesives in this sector. Additionally, the implementation of China's "14th Five Year Plan" has emphasized the development of green packaging solutions, creating new opportunities for adhesive manufacturers in this segment.
Automotive Segment in China Adhesives Market
The automotive segment is emerging as the fastest-growing segment in the China adhesives market, driven by the country's expanding electric vehicle (EV) production capabilities and technological advancements in automotive manufacturing. The segment is expected to maintain strong growth momentum through 2024-2029, supported by manufacturers increasingly replacing traditional mechanical fasteners with adhesive solutions to achieve vehicle weight reduction and improved fuel efficiency. China's position as the world's largest automotive market, coupled with government initiatives supporting electric vehicle production, continues to drive innovation in automotive adhesive applications. The trend toward lightweight vehicle construction and the growing emphasis on electric vehicle manufacturing has created substantial demand for specialized adhesive solutions in areas such as battery assembly, interior components, and structural bonding. The use of reactive adhesives in these applications is particularly noteworthy due to their high-strength bonding capabilities.
Remaining Segments in End User Industry
The other significant segments in the China adhesives market include building and construction, woodworking and joinery, healthcare, footwear and leather, and aerospace industries. The building and construction segment maintains strong demand due to ongoing urbanization and infrastructure development projects, with a notable increase in the use of construction adhesives. The woodworking and joinery segment benefits from China's position as a major furniture manufacturing hub, where wood adhesives play a critical role. The healthcare segment is experiencing steady growth due to increased medical device manufacturing, with medical adhesives being essential for various applications. The footwear and leather segment continues to be significant due to China's large footwear manufacturing industry. The aerospace segment, while smaller in market share, serves specialized high-value applications in the growing aviation sector, utilizing advanced aerospace adhesives.
Segment Analysis: Technology
Water-borne Segment in China Adhesives Market
Water-borne adhesives dominate the Chinese adhesives market, holding approximately 40% market share in 2024. These adhesives are primarily formulated as dispersions or emulsions, with dispersed polymer particles ranging from 50-300 nm in diameter. Their widespread adoption is driven by their eco-friendly nature, low VOC content, and cost-effectiveness compared to other technologies. The segment's strong position is further reinforced by China's "14th Five Year Plan" which emphasizes environmental sustainability in industrial processes. Water-borne adhesives find extensive applications in woodworking, footwear, and other industries requiring bonding of porous substrates like wood, paper, textiles, and leather. Their effectiveness in these applications, combined with worker safety benefits and regulatory compliance, has established water-borne adhesives as the preferred choice among Chinese manufacturers.
Hot Melt Segment in China Adhesives Market
The hot melt adhesives segment is experiencing robust growth in the Chinese market, driven by increasing demand across various end-user industries. These thermoplastic adhesives, available in different diameters such as 12mm, 15mm, or 43mm, offer significant advantages including rapid curing, versatile application methods, and wide operating temperature ranges from 60°C to 200°C. The segment's growth is particularly supported by the rising adoption in packaging and construction applications, where EVA resin-based hot melt adhesives are preferred due to their affordability and performance characteristics. The trend of manufacturers shifting from traditional water-borne or solvent-borne adhesives to hot melt alternatives is expected to continue, driven by their superior bonding properties and operational efficiency advantages.
Remaining Segments in Technology
The Chinese adhesives market also encompasses reactive, solvent-borne, and UV cured adhesives segments, each serving specific industrial applications. Reactive adhesives are particularly valued in automotive and high-tech applications where permanent, high-strength bonding is crucial. Solvent-borne adhesives, despite facing regulatory pressure due to VOC emissions, maintain their relevance in specialized applications where their unique properties are essential. UV cured adhesives, while representing a smaller market share, are gaining traction in precision applications due to their rapid curing properties and environmental benefits. These segments collectively provide manufacturers with a comprehensive range of solutions to meet diverse bonding requirements across industries.
Segment Analysis: Resin
Polyurethane Segment in China Adhesives Market
Polyurethane adhesives maintain their dominant position in China's adhesives market, commanding approximately 26% market share in 2024. These adhesives are extensively preferred by footwear and automotive industry manufacturers owing to their superior adhesion properties of nearly 8.5 N/mm2 to sheet molding composites. The segment's leadership is driven by polyurethane adhesives' versatility in bonding diverse substrates, excellent durability, and resistance to chemicals and environmental factors. Their ability to operate across a wide temperature range from -40°C to 100°C makes them ideal for both interior and exterior applications. The growing electric vehicle production in China, coupled with increasing demand from construction and packaging industries, continues to drive the segment's growth. Additionally, polyurethane adhesives' ability to form tough bonds with high peel strength and shear strength makes them particularly valuable in structural applications.
Acrylic Segment in China Adhesives Market
The acrylic adhesives segment is projected to experience robust growth at approximately 7% CAGR during 2024-2029, emerging as the fastest-growing segment in China's adhesives market. This growth is primarily attributed to their increasing adoption in packaging applications due to their durable bond and faster curing times, with full curing achieved in 24 hours at 23°C. The segment's expansion is further supported by China's emphasis on flexible and sustainable packaging under its "14th Five Year Plan" policy. Acrylic adhesives' superior performance characteristics, including improved temperature resistance, solvent resistance, and UV stability compared to rubber adhesives, make them increasingly popular across various applications. Their ability to reduce assembly times by up to 60% and decrease the cost of assemblies by up to 50% has made them particularly attractive for automotive graphics, re-peeling protective films, exhibition graphics, and architectural applications.
Remaining Segments in Resin Segmentation
The other significant segments in China's adhesives market include VAE/EVA, epoxy, cyanoacrylate, silicone, and other specialty resins, each serving unique application needs. VAE/EVA adhesives are particularly valued in the sports footwear industry for their flexibility and shock absorption properties. Epoxy adhesives dominate construction applications due to their high tensile strength and structural properties. Cyanoacrylate adhesives are preferred for their fast curing times and strong bonding capabilities with various substrates. Silicone adhesives excel in high-temperature applications and provide excellent flexibility and weather resistance. The remaining specialty resins, including rubber-based adhesives and anaerobic adhesives, cater to specific industrial applications requiring unique performance characteristics such as chemical resistance or specialized curing mechanisms. The use of pressure sensitive adhesives in textile applications is also gaining traction, providing manufacturers with versatile bonding solutions.
Competitive Landscape
Top Companies in China Adhesives Market
The China adhesive market is led by prominent players, including H.B. Fuller Company, Hubei Huitian New Materials, NANPAO Resins Chemical Group, Henkel AG & Co. KGaA, and 3M, who are driving market growth through continuous innovation and strategic initiatives. These companies are heavily investing in research and development activities to develop sustainable and eco-friendly adhesive solutions, particularly focusing on low-VOC and water-based technologies. Market leaders are expanding their manufacturing capabilities and distribution networks across different regions of China to strengthen their market presence. Companies are also pursuing strategic partnerships and acquisitions to enhance their product portfolios and gain access to new technologies and market segments. The focus on customized solutions for specific industry applications, particularly in the packaging, construction, and automotive sectors, remains a key competitive strategy among major players.
Mixed Market Structure with Regional Champions
The Chinese adhesives market exhibits a highly fragmented structure with a mix of global conglomerates and local specialists competing for market share. International players like Henkel, 3M, and H.B. Fuller leverage their advanced technologies and global expertise, while domestic companies such as Hubei Huitian and NANPAO Resins have established a strong regional presence through their extensive local distribution networks and understanding of market requirements. The market has witnessed increased consolidation activities, particularly among domestic players looking to expand their technological capabilities and market reach.
The competitive dynamics are characterized by the presence of both large-scale manufacturers offering comprehensive product portfolios and specialized players focusing on specific end-user segments or technologies. Local manufacturers are increasingly investing in research and development capabilities to compete with global players, while international companies are establishing local manufacturing facilities and research centers to better serve the China adhesive market. The industry has seen several strategic partnerships between domestic and international players to combine technological expertise with local market knowledge.
Innovation and Sustainability Drive Future Success
For established players to maintain and expand their market position, a focus on technological innovation and sustainable solutions has become crucial. Companies are investing in developing bio-based adhesives and environmentally friendly formulations to align with China's increasingly stringent environmental regulations. Market leaders are strengthening their position by expanding their distribution networks, particularly in emerging industrial clusters, while also focusing on digital transformation and smart manufacturing capabilities to improve operational efficiency.
New entrants and challenger companies can gain market share by focusing on specialized market segments and developing innovative solutions for specific applications. Success in the Chinese adhesives market increasingly depends on building strong relationships with key end-user industries and offering customized solutions that meet specific performance requirements. Companies need to consider potential regulatory changes, particularly regarding environmental protection and safety standards, while also investing in local manufacturing capabilities to ensure competitive pricing and reliable supply chains. The ability to provide technical support and after-sales service has become increasingly important in maintaining customer relationships and building market presence.
In particular, the rise of high-end adhesives in China Zhisheng and professional adhesives in China Zhisheng highlights the growing demand for specialized adhesive solutions tailored to the unique needs of the Chinese market.
China Adhesives Industry Leaders
-
3M
-
H.B. Fuller Company
-
Henkel AG & Co. KGaA
-
Hubei Huitian New Materials Co. Ltd
-
NANPAO RESINS CHEMICAL GROUP
- *Disclaimer: Major Players sorted in no particular order

Need More Details on Market Players and Competitors?
Download PDF
Recent Industry Developments
- February 2022: Arkema acquired Shanghai Zhiguan Polymer Materials (PMP), specializing in hot-melt adhesives for the consumer electronics sector.
- December 2021: Under the Nuplaviva brand, Arkema introduced a new range of disposable hygiene adhesive solutions formulated with bio-based renewable content.
- October 2021: 3M introduced a new generation of acrylic adhesives, including 3M Scotch-Weld Low Odor Acrylic Adhesive 8700NS Series, 3M Scotch-Weld Flexible Acrylic Adhesive 8600NS Series, and 3M Scotch-Weld Nylon Bonder Structural Adhesive DP8910NS.
China Adhesives Market Report Scope
Aerospace, Automotive, Building and Construction, Footwear and Leather, Healthcare, Packaging, Woodworking and Joinery are covered as segments by End User Industry. Hot Melt, Reactive, Solvent-borne, UV Cured Adhesives, Water-borne are covered as segments by Technology. Acrylic, Cyanoacrylate, Epoxy, Polyurethane, Silicone, VAE/EVA are covered as segments by Resin.
End User Industry
| Aerospace |
| Automotive |
| Building and Construction |
| Footwear and Leather |
| Healthcare |
| Packaging |
| Woodworking and Joinery |
| Other End-user Industries |
Technology
| Hot Melt |
| Reactive |
| Solvent-borne |
| UV Cured Adhesives |
| Water-borne |
Resin
| Acrylic |
| Cyanoacrylate |
| Epoxy |
| Polyurethane |
| Silicone |
| VAE/EVA |
| Other Resins |
| End User Industry | Aerospace |
| Automotive | |
| Building and Construction | |
| Footwear and Leather | |
| Healthcare | |
| Packaging | |
| Woodworking and Joinery | |
| Other End-user Industries | |
| Technology | Hot Melt |
| Reactive | |
| Solvent-borne | |
| UV Cured Adhesives | |
| Water-borne | |
| Resin | Acrylic |
| Cyanoacrylate | |
| Epoxy | |
| Polyurethane | |
| Silicone | |
| VAE/EVA | |
| Other Resins |
Need A Different Region or Segment?
Customize Now
Market Definition
- End-user Industry - Building & Construction, Packaging, Automotive, Aerospace, Woodworking & Joinery, Footwear & Leather, Healthcare, and Others are the end-user industries considered under the adhesives market.
- Product - All adhesive products are considered in the market studied
- Resin - Under the scope of the study, resins like Polyurethane, Epoxy, Acrylic, Cyanoacrylate, VAE/EVA, and Silicone are considered
- Technology - For the purpose of this study, Water-borne, Solvent-borne, Reactive, Hot Melt, and UV Cured adhesive technologies are taken into consideration.
| Keyword | Definition |
|---|---|
| Hot-melt Adhesive | Hot melt adhesives are generally 100% solid formulations, based on thermoplastic polymers. They are solid at room temperature and are activated upon heating above their softening point, at which stage they are liquid, and hence, can be processed. |
| Reactive Adhesive | A reactive adhesive is made up of monomers that react in the adhesive curing process and do not evaporate from the film during use. Instead, these volatile components become chemically incorporated into the adhesive. |
| Solvent-borne Adhesive | Solvent-borne adhesives are mixtures of solvents and thermoplastic, or slightly cross-linked polymers, such as polychloroprene, polyurethane, acrylic, silicone, and natural and synthetic rubbers (elastomers). |
| Water-borne Adhesive | Water-borne adhesives use water as a carrier or diluting medium to disperse a resin. They are set by allowing the water to evaporate or be absorbed by the substrate. These adhesives are compounded with water as a diluent, rather than a volatile organic solvent. |
| UV Cured Adhesive | UV curing adhesives induce curing and create a permanent bond without heating by using ultraviolet (UV) light or other radiation sources. An aggregation of monomers and oligomers is cured or polymerized by ultraviolet (UV) or visible light in a UV adhesive. Because UV is a radiating energy source, UV adhesives are often referred to as radiation curing or rad-cure adhesives. |
| Heat-resistant Adhesive | Heat-resistant Adhesives refer to those that do not break down under high temperatures. One aspect of a complicated system of circumstances is the adhesive's capacity to withstand disintegration brought on by high temperatures. As the temperature rises, adhesives may liquefy. They can withstand stresses resulting from differing coefficients of expansion and contraction, which might be an additional advantage. |
| Reshoring | Reshoring is the practice of moving commodity production and manufacturing back to the nation where the business was founded. Onshoring, inshoring, and back shoring are further terms used. Offshoring, the practice of producing items abroad to lower labor and manufacturing costs, is the opposite of this. |
| Oleochemicals | Oleochemicals are compounds produced from biological oils or fats. They resemble petrochemicals, which are substances made from petroleum. The oleochemical business is built on the hydrolysis of oils or fats. |
| Nonporous Materials | Nonporous materials are substances that do not permit the passage of liquid or air. Nonporous materials are those that are not porous, such as glass, plastic, metal, and varnished wood. Since no air can get through, less airflow is required to raise these materials, negating the requirement for high airflow. |
| EU-Vietnam Free Trade Agreement | A trade agreement and an investment protection agreement were concluded between the European Union and Vietnam on June 30, 2019. |
| VOC content | Compounds with limited solubility in water and high vapor pressure are known as Volatile Organic Compounds (VOCs). Many VOCs are human-made chemicals that are used and produced in the manufacture of paints, pharmaceuticals, and refrigerants. |
| Emulsion Polymerization | Emulsion polymerization is a method of producing polymers or connected groups of smaller chemical chains known as monomers, in a water solution. The method is often used to make water-based paints, adhesives, and varnishes, in which the water stays with the polymer and is marketed as a liquid product. |
| 2025 National Packaging Targets | In 2018, the Australian Environment Ministry set the following 2025 National Packaging Targets: 100% of the packaging must be reusable, recyclable, or compostable by 2025, 70% of plastic packaging must be recycled or composted by 2025, 50% of average recycled content must be included in packaging by 2025, and problematic and unnecessary single-use plastic packaging must be phased out by 2025. |
| Russian Government’s Import Substitution Policy | The Western sanctions suspended the distribution of several high-tech items to Russia, including those required by the raw material export sectors and the military-industrial complex. In response, the government launched an "import substitution" scheme, appointing a special commission to oversee its implementation in early 2015. |
| Paper Substrate | Paper substrates are paper sheets, reels, or boards with a base weight of up to 400 g/m2 that has not been converted, printed or otherwise altered. |
| Insulation Material | A material that inhibits or blocks heat, sound, or electrical transmission is known as Insulation Material. The variety of insulation materials includes thick fibers like fiberglass, rock and slag wool, cellulose, and natural fibers as well as stiff foam boards and sleek foils. |
| Thermal Shock | A temperature change known as thermal shock generates stress in a material. It commonly results in material breakdown and is especially prevalent in brittle materials like ceramics. When there is a quick temperature change, either from hot to cold or vice versa, this process occurs abruptly. It occurs more frequently in materials with poor heat conductivity and insufficient structural integrity. |
Need More Details on Market Definition?
Ask a Question
Research Methodology
Mordor Intelligence follows a four-step methodology in all our reports.
- Step-1: Identify Key Variables: The quantifiable key variables (industry and extraneous) pertaining to the specific product segment and country are selected from a group of relevant variables & factors based on desk research & literature review; along with primary expert inputs. These variables are further confirmed through regression modeling (wherever required).
- Step-2: Build a Market Model: In order to build a robust forecasting methodology, the variables and factors identified in Step-1 are tested against available historical market numbers. Through an iterative process, the variables required for market forecast are set and the model is built on the basis of these variables.
- Step-3: Validate and Finalize: In this important step, all market numbers, variables and analyst calls are validated through an extensive network of primary research experts from the market studied. The respondents are selected across levels and functions to generate a holistic picture of the market studied.
- Step-4: Research Outputs: Syndicated Reports, Custom Consulting Assignments, Databases & Subscription Platforms

Get More Details On Research Methodology
Download PDF


