
Market Overview
| Study Period | 2020 - 2031 |
|---|---|
| Forecast Data Period | 2026 - 2031 |
| Historical Data Period | 2020 - 2024 |
| Market Size (2026) | USD 17.22 Billion |
| Market Size (2031) | USD 25.13 Billion |
| Growth Rate (2026 - 2031) | 7.85 % |
| Market Concentration | Low |
Major Players *Disclaimer: Major Players sorted in no particular order Image © Mordor Intelligence. Reuse requires attribution under CC BY 4.0. | |
China Active Pharmaceutical Ingredients Market Analysis by Mordor Intelligence
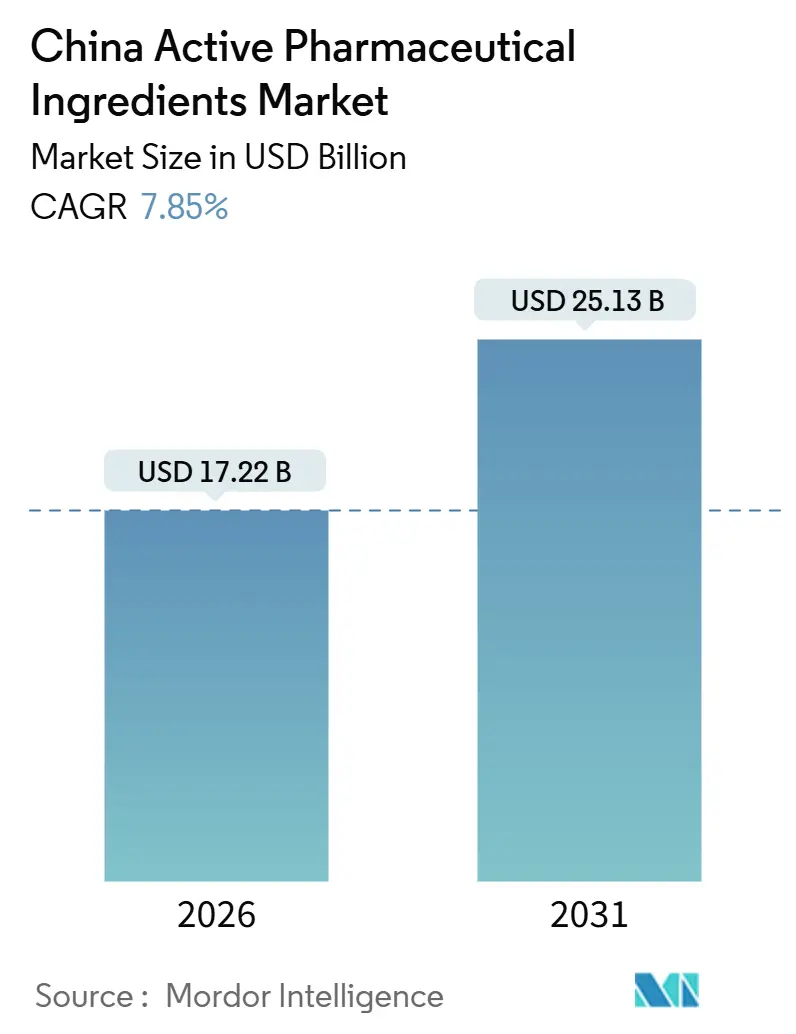
The China Active Pharmaceutical Ingredients Market size is estimated at USD 17.22 billion in 2026, and is expected to reach USD 25.13 billion by 2031, at a CAGR of 7.85% during the forecast period (2026-2031).
The market trajectory rides on expedited review pathways, vertically integrated cost advantages, and expanding merchant capacity that link upstream coal-based solvents to downstream crystallization. At the same time, national volume-based procurement (VBP) and U.S. security legislation are pressuring margins, forcing suppliers to pivot toward complex, high-value molecules. Biotech APIs are growing fastest, buoyed by a domestic biologics pipeline that moved 3,575 candidates into active development between 2015 and 2024. Currency depreciation strengthens export pricing, yet volatile coal and solvent costs offset part of that benefit. Competitive strategies now revolve around green manufacturing upgrades, regional satellite plants, and niche technologies such as peptide synthesis and antibody-drug conjugates.
Key Report Takeaways
- By business model, merchant API operations led with 58.55% of the China active pharmaceutical ingredients market share in 2025; captive plants are projected to trail as merchant capacity expands at an 8.25% CAGR to 2031.
- By synthesis type, synthetic routes commanded 70.53% of the China active pharmaceutical ingredients market size in 2025, while biotech APIs are forecast to post the highest 11.85% CAGR through 2031.
- By drug type, generic molecules held 73.63% share of the China active pharmaceutical ingredients market size in 2025, but branded APIs are set to grow at 10.87% CAGR between 2026 and 2031.
- By application, oncology maintained a 24.3% revenue share in 2025; neurology APIs are advancing at a 12.81% CAGR through 2031 as Alzheimer’s and Parkinson’s prevalence climbs.
Note: Market size and forecast figures in this report are generated using Mordor Intelligence’s proprietary estimation framework, updated with the latest available data and insights as of January 2026.
China Active Pharmaceutical Ingredients Market Trends and Insights
Drivers Impact Analysis*
| Driver | (~) % Impact on CAGR Forecast | Geographic Relevance | Impact Timeline |
|---|---|---|---|
| Rising prevalence of chronic & lifestyle diseases | +1.4% | Eastern provinces | Long term (≥ 4 years) |
| Growing domestic use of biologics & biosimilars | +1.8% | Beijing, Shanghai, Suzhou | Medium term (2-4 years) |
| Yuan depreciation widens export price advantage | +0.9% | Zhejiang, Jiangsu, Shandong | Short term (≤ 2 years) |
| Supply-chain friend-shoring boosts China CDMO orders | +1.2% | Global | Medium term (2-4 years) |
| Government policies favoring local manufacturing | +1.1% | National | Long term (≥ 4 years) |
| Rising demand for affordable generics | +1.0% | National | Medium term (2-4 years) |
| Source: Mordor Intelligence | |||


Rising Prevalence Of Chronic & Lifestyle Diseases
Cardiovascular disease, diabetes, and cancer account for more than 80% of Chinese mortality, and 75% of citizens aged 60 plus manage at least one chronic condition[1]Chinese CDC, “Chronic Disease Trends 2025,” chinacdc.cn. The burden guarantees sustained ordering of statins, metformin precursors, and oncology intermediates despite VBP price compressions. Diagnosed diabetes cases reached 140 million, locking in high baseline demand for antidiabetic APIs. Provincial cancer-screening mandates introduced under Healthy China 2030 further accelerate orders for PD-1 and kinase inhibitor intermediates. Because the population aged 65 plus will top 300 million by 2030, demand for neurology and osteoporosis APIs is projected to remain resilient across the forecast window.
Growing Domestic Use Of Biologics & Biosimilars
China initiated 4,382 innovative drug programs between 2015 and 2024, and 18 Chinese-origin products won overseas approvals, catalyzing local demand for monoclonal-antibody and recombinant-protein APIs[2]Nature Biotechnology Editors, “China’s Biologics Innovation Landscape,” nature.com. Kelun-BPC invested in ADC intermediates, while Luye Pharma advanced nanomedicine capabilities to retain more value margins that generic VBP has eroded. Streamlined biosimilar review rules introduced in 2020 helped trastuzumab follow-ons capture sizeable domestic share within 18 months. Cytiva’s 2025 index rated China 5.72 in biomanufacturing capacity and reported that 61% of surveyed sponsors plan to increase regional sourcing. These indicators underpin the 11.85% CAGR outlook for biotech APIs over 2026-2031.
Yuan Depreciation Widens Export Price Advantage
A gradual yuan weakening improved dollar-denominated unit costs for Zhejiang and Jiangsu exporters by 3-4% when currency slipped 5% versus the U.S. dollar. The benefit is strongest for high-volume pain and vitamin molecules, yet firms with dollar debt or imported catalysts experience offsetting cost inflation. Vertically integrated producers such as CSPC, which source acetone and methanol domestically, capture the full currency benefit. Buyers, however, increasingly insert quarterly price adjustment clauses, shifting FX risk back to suppliers.
Supply-Chain Friend-Shoring Boosts China CDMO Orders
Despite political rhetoric, friend-shoring has lifted near-term CDMO volumes because alternate regions lack equivalent reactor capacity. WuXi AppTec’s Taixing and Changzhou plants passed FDA inspections without observations in March 2025, reinforcing foreign client confidence. Asymchem opened a U.K. site in 2024, and Pharmaron purchased facilities in Cramlington and Coventry, offering Western domiciles while retaining core Chinese manufacturing. Yet the U.S. Biosecure Act introduced in 2024 caused sponsors to pause new orders, cutting WuXi Advanced Therapies revenue 17% through Q3 2024. The duality is expected to persist through 2027.
Restraints Impact Analysis*
| Restraint | (~) % Impact on CAGR Forecast | Geographic Relevance | Impact Timeline |
|---|---|---|---|
| Drug-price control & national volume-based procurement | -1.6% | Tier-1 and Tier-2 cities | Short term (≤ 2 years) |
| Fierce competition & stricter GMP / environmental rules | -1.1% | Coastal clusters | Medium term (2-4 years) |
| Emerging U.S./EU tariffs on critical-drug raw materials | -0.7% | Zhejiang, Jiangsu, Shandong | Short term (≤ 2 years) |
| Volatile coal & solvent prices squeezing small producers | -0.5% | National | Short term (≤ 2 years) |
| Source: Mordor Intelligence | |||
Drug-Price Control & National Volume-Based Procurement
The 2024 VBP extension to oncology triggered API cost-down requests that erased 1.6 percentage points from market CAGR projections. CSPC’s bulk-drug revenue dipped 1.6% year-over-year in 2024 despite higher volumes, illustrating margin erosion. The policy accelerates commoditization by neutralizing brand differentiation, forcing suppliers toward complex peptides and HPAPIs where VBP leverage is weaker.
Fierce Competition & Stricter GMP / Environmental Rules
The 14th Five-Year Plan mandates wastewater and emission upgrades that can cost RMB 50 million for a mid-size plant. Zhejiang Huahai’s June 2025 FDA warning letter for data-integrity lapses highlighted rising compliance scrutiny. Smaller firms face exit risks if they cannot recoup capital under compressed VBP pricing, accelerating consolidation in Jiangsu and Zhejiang clusters.
*Our forecasts treat driver/restraint impacts as directional, not additive. The impact forecasts reflect baseline growth, mix effects, and variable interactions.
Segment Analysis
By Business Model: Merchant Operations Secure Greater Volume Share
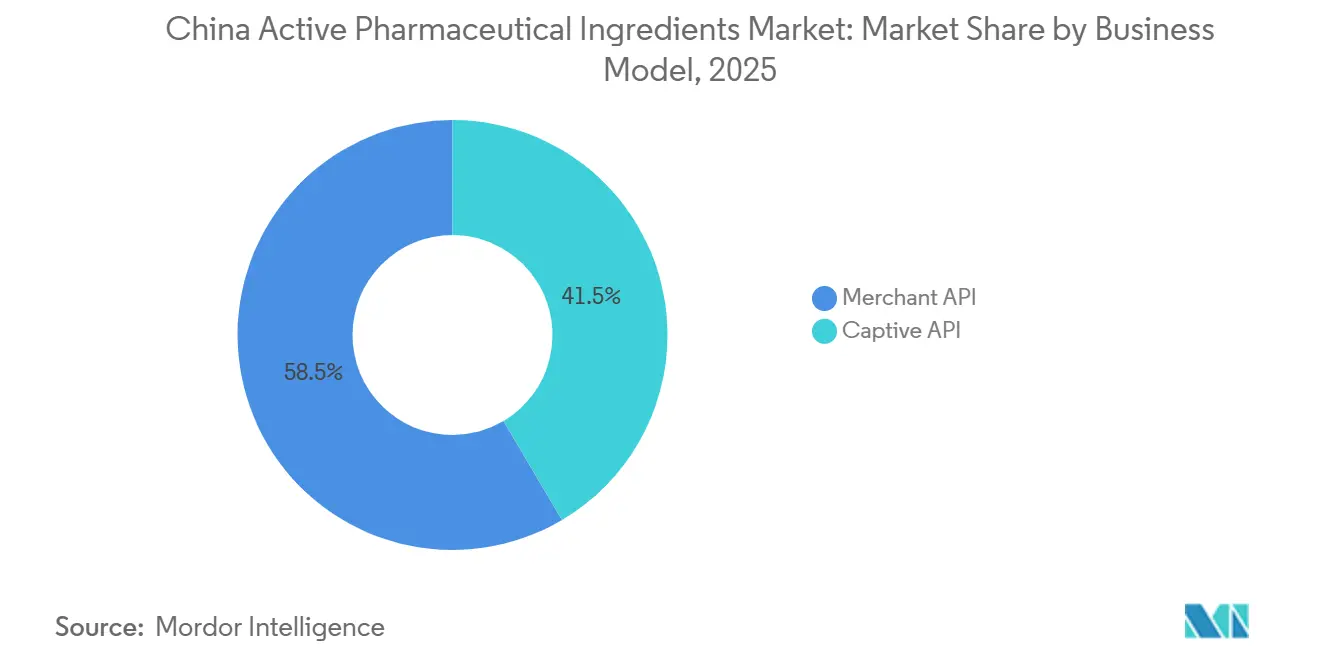
Merchant players captured 58.55% of 2025 revenue in the China active pharmaceutical ingredients market and are tracking an 8.25% CAGR to 2031. Western pharma is outsourcing to preserve R&D budgets, and multi-client portfolios help spread fixed costs. WuXi’s Taixing complex, spanning 169 acres with over 1,000 m³ reactors, demonstrates the scale advantage. Captive facilities risk low utilization whenever pipeline assets fail or patents expire, while merchant suppliers can redeploy capacity quickly. However, reliance on a concentrated foreign client base leaves merchant firms vulnerable to geopolitical shocks such as the Biosecure Act suspension wave that dented WuXi Advanced Therapies revenue in 2024.
The merchant model also eases geographic diversification. Asymchem’s U.K. acquisition and Pharmaron’s British sites allow Chinese CDMOs to list Western regulatory addresses while retaining low-cost mainland production. High-potency and peptide lines command premium pricing, insulating margins from VBP, and are the focal points of most new merchant CAPEX through 2031.

By Synthesis Type: Biotech Route Records Fastest Growth
Synthetic chemistry still holds 70.53% of the 2025 market value in the China active pharmaceutical ingredients market, yet biotech APIs are scaling at an 11.85% CAGR courtesy of an accelerated biologics pipeline. Mammalian cell-culture capacity is expanding in Suzhou and Shanghai parks, with Cytiva rating Chinese biomanufacturing at 5.72 in its 2025 index.
Biotech APIs earn 3-5 times the unit price of small molecules, cushioning suppliers against input price swings. Synthetic APIs face shrinking spreads as VBP covers more molecules, nudging chemistries toward chiral intermediates and HPAPIs where specialized containment justifies higher quotations.
By Drug Type: Branded Molecules Gain Momentum
Generic molecules represented 73.63% of the 2025 China active pharmaceutical ingredients market size, but branded APIs are advancing at 10.87% CAGR, lifted by a surge in in-licensed Chinese pipeline assets that hit 31% in 2024. Branded intermediates enjoy stronger pricing power under exclusivity and often include profit-sharing clauses.
Generic APIs continue to underpin cash flow; CSPC reported vitamin C sales of RMB 1,994 million in 2024, up 3.4% year-over-year. Nonetheless, suppliers are redirecting CAPEX toward continuous manufacturing and enzymatic synthesis platforms to defend margins on branded APIs as the NMPA’s expedited review compresses launch timelines.

By Application: Neurology Surges On Aging Demographics
Oncology maintained 24.3% revenue share in 2025, but neurology APIs are slated for a 12.81% CAGR as Alzheimer’s and Parkinson’s incidence grows with an aging base. Healthy China 2030 screening and therapy expansion underpin the oncology baseline.
Neurology growth reflects newfound product success abroad; disease-modifying treatments approved in the U.S. catalyze analogous Chinese trials, prompting Luye Pharma to invest in CNS-targeted nanomedicines. Pulmonology APIs remain stable, while cardiology stays volume heavy yet margin thin under VBP.
Geography Analysis
Provincial output is concentrated: Jiangsu, Zhejiang, and Shandong contribute significant percentage of national API volume by leveraging feedstock proximity, port logistics, and industrial-park incentives[3]Zhejiang Medicine Co., “Corporate Presentation 2025,” zmc.com.cn. Jiangsu’s Taizhou and Lianyungang plants specialize in analgesic and penicillin intermediates; Zhejiang’s clusters command vitamins E and biotin; Shandong leverages coal-chemicals for antibiotic precursors.
Export dynamics show a split strategy. High-value HPAPIs and peptides go to North America and Europe, while commodity APIs serve ASEAN, Latin America, and Africa. Yet 59% of Chinese plants await FDA inspection, a risk spotlighted in Wall Street Journal coverage. Section 301 tariffs and the U.S. Biosecure Act add uncertainty, prompting WuXi to plan a Singapore site for 2027 and Asymchem to establish capacity in the U.K..
Domestic consumption is diffusing into Tier-2 and Tier-3 cities as VBP penetrates county hospitals, widening API distribution grids. Cold-chain needs for biologics and provincial QC bottlenecks challenge logistics, yet the shift reduces reliance on volatile export revenue over the long term.
Regulatory Landscape
China's API market operates under the National Medical Products Administration (NMPA) framework and the Drug Administration Law, with a notable 2026 update from the State Council: the revised Implementing Regulations were promulgated on January 27, 2026 and take effect on May 15, 2026. The 2026 Regulations formalize bundled review and approval of chemical APIs by upgrading the prior "notice" concept to a "Certificate of Approval" and establishing a legal basis for transferring that Certificate of Approval, a change that directly affects how chemical API registrations and supply relationships can be structured between API holders and downstream MAHs.
In parallel, the NMPA is advancing implementation of drug trial data protection in 2026, including data protection for drugs containing new chemical substances and market exclusivity provisions for eligible pediatric medicines and drugs for rare diseases. For API suppliers and CDMOs, these moves increase the importance of compliant, traceable registration ownership and lifecycle management for chemical APIs, while strengthening incentives around innovative and complex programs that sit upstream of branded and biologics manufacturing demand.
Competitive Landscape
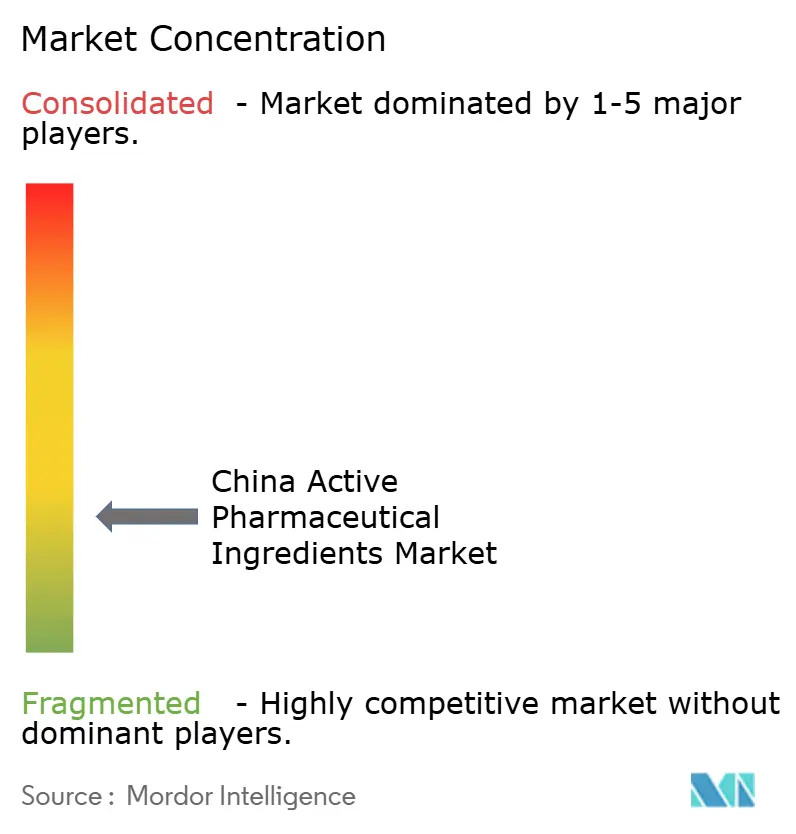
China’s API arena is fragmented. The top 10 suppliers command a significant percentage of revenue, leaving a long tail of small firms focused on commoditized molecules. Leading CDMOs are capturing high-potency niches: Asymchem launched an OEB5 facility in Tianjin with 500 kg annual capacity in July 2025. WuXi AppTec raised HKD 7.7 billion in July 2025 to fund overseas expansion and green upgrades.
Strategy divides along scale lines. Large firms deploy satellite plants abroad to reassure Western clients, while specialists triple down on flow chemistry, controlled substances, or agrochemical adjacencies. Viva Biotech and Porton Pharma integrate CRO, CMC, and API services, shortening lead times for biotech sponsors.
Technology adoption remains uneven. Continuous manufacturing is concentrated among tier-one CDMOs, yet the 14th Five-Year Plan’s green mandates are pushing even smaller facilities to invest in closed-loop solvent recovery. Regulatory compliance is a decisive moat; Zhejiang Huahai’s FDA letter underscores reputational stakes and accelerates industry consolidation.
China Active Pharmaceutical Ingredients Industry Leaders
Reyoung Pharmaceuticals
Sandoz Group AG
CSPC Pharmaceutical Group Ltd.
WuXi AppTec (STA Pharmaceutical)
Lonza Guangzhou Ltd.
- *Disclaimer: Major Players sorted in no particular order

Market Opportunities and Future Outlook
A clear whitespace sits in complex modalities and higher-value drug substance work where pricing is less tied to commoditized generic procurement cycles. WuXi AppTec disclosed an at-least 17% increase in 2026 capital expenditure (RMB 6.5-7.5 billion) to expand drug substance and drug product manufacturing capacity, and it reported growth in its TIDES D&M business in Q1 2026 (28% year-over-year increase in customers and 59% increase in molecules). This combination points to active demand for peptides and oligonucleotide-adjacent supply chains and supports opportunities for domestic suppliers that can provide high-containment, specialized synthesis, and integrated CMC-to-API scale-up services.
Regulatory changes in 2026 also open opportunity around transferable API registrations and stronger innovation protections. The May 15, 2026 effectiveness of the revised Implementing Regulations of the Drug Administration Law, including formalized chemical API "Certificate of Approval" mechanisms and a legal foundation for certificate transfer, creates room for more flexible partnering between merchant API producers, MAHs, and CDMOs. CSPC's 2025 annual report emphasis on AI-driven drug discovery and advanced therapy areas (including gene therapy and cell therapy) further underscores the strategic push toward technology platforms and differentiated pipelines, which in turn expands demand for specialized intermediates and enabling chemistries rather than purely volume-driven commodity APIs.
Recent Industry Developments
- June 2026: WuXi AppTec announced acceleration of manufacturing capacity expansion globally, including two new small molecule API plants at Taixing site expected to become operational in 2026 and two additional plants for oligonucleotide, peptide, and PMO production under construction for 2027. The expansion strengthens downstream supply capacity for core markets and complex modalities. The move broadens WuXi AppTec's manufacturing footprint and capabilities in high value APIs.
- March 2026: CSPC Pharmaceutical Group Ltd. annual report reaffirmed global strategy, upgrading from overseas product expansion to technology platform and platform-based partnerships. The shift emphasizes strategic R&D collaborations and platform driven growth. It positions CSPC to leverage AI enabled delivery technologies through new partnerships.
- January 2026: CSPC Pharmaceutical Group Ltd. entered second strategic collaboration with AstraZeneca focusing on AI small molecule, long-acting delivery technology, and peptide drug platforms. The deal broadens CSPC's technology platform and co development potential with a leading multinational. It signals CSPC's push into AI enabled delivery and peptide platforms.


Research Methodology Framework and Report Scope
Market Definition and Coverage
This market covers the value of active pharmaceutical ingredients produced and sold within China for use in finished drug manufacturing, whether supplied to third parties or used internally by integrated drug makers. Values are expressed in USD at the API manufacturer level.
Scope exclusions: It excludes finished dosage forms, excipients, packaging, and distribution markups that do not reflect API manufacturing value.
Segmentation Overview
- By Business Mode
- Captive API
- Merchant API
- By Synthesis Type
- Synthetic
- Biotech
- By Drug Type
- Generic
- Branded
- By Application
- Cardiology
- Oncology
- Pulmonology
- Neurology
- Orthopedic
- Ophthalmology
- Other Applications
Data Sources, Market Sizing, and Validation
Desk Research
Desk research is used to map China API supply and demand signals into a consistent data backbone, then align those signals with how the industry reports production and trade. We typically lean on public sources such as the National Bureau of Statistics of China, China Customs trade statistics, the National Medical Products Administration announcements, and World Health Organization and World Bank macro series to keep denominators consistent.
On top of that, we use company annual reports, exchange filings, investor presentations, association releases, and reputed business press to confirm capacity additions, compliance events, and product focus shifts. Where needed, paid subscriptions for company financials, shipment-level import and export records, patents, and news and financials are used to speed up validation and reduce missing inputs in the model. The sources listed here are illustrative only, and many other public and paid references were checked for data collection, cross-verification, and clarification.
Primary Interviews and Surveys
Primary work is done through expert interviews and structured surveys with API manufacturers, distributors, procurement teams at drug makers, and consultants who track plant utilization and regulatory changes. We use these inputs to confirm what is actually selling in China, how pricing shifts by molecule complexity, and where desk research is weaker, for example, in captive versus merchant splits.
For a China-only market, we also cover key manufacturing provinces through respondents with direct operating exposure, which helps us pressure-test assumptions before finalizing the model.
Distribution of primary research fieldwork respondents
| Company type | Respondent position |
|---|---|
| Top tier: 26% | CXOs: 13% |
| Mid tier: 56% | Functional/Unit leaders: 29% |
| Smaller Players: 18% | Managers: 58% |
Market-Sizing & Forecasting
Sizing starts with a top-down build where China API demand is reconstructed using a treated demand pool view across major therapy needs, mapped to API intensity, and then checked against production and trade flows reported in official statistics. The model is then corroborated with selective bottom-up approximations such as sampled manufacturer revenue splits, channel checks on merchant API volumes, and ASP times volume sanity checks for high-visibility molecules.
Key inputs that move the totals include API export value and volume trends, domestic formulation output signals, plant capacity and utilization direction, environmental and GMP compliance actions that constrain supply, and the shift toward higher-complexity APIs that lifts average selling prices. For forecasting, we mainly use scenario analysis supported by trend lines on utilization, export momentum, and price progression, and then adjust assumptions based on what interviewees expect for procurement pressure and new capacity coming online. Where product-level revenue is not disclosed, gaps are handled through proxy allocation using production indicators and validated ASP bands rather than forcing a full supplier roll-up.
Data Validation & Update Cycle
Before sign-off, results are cross-checked against independent signals such as customs exports, sector revenue trends, and disclosed API revenue in listed company filings, and then large variances are reviewed in a second analyst pass. If an outlier is driven by a single assumption, we re-check the input series, revisit currency conversion timing, and reconnect with a small set of respondents to confirm whether the change is real or only a reporting lag.
Reports are refreshed annually, and interim updates are triggered when material events occur, such as major regulatory actions, sharp price swings in key APIs, or step changes in export volumes. Right before delivery, an analyst performs a fresh scan of the newest public data points so clients receive the latest updated view.
Mordor Intelligence's China Active Pharmaceutical Ingredients Market Sizing Compared With Other Published Estimates
Published market numbers for China APIs often do not align, and the gaps usually come from timing, scope boundaries, and how pricing is treated across molecules with very different value per kilogram. Even a small difference in year-average FX timing, or how captive API is treated versus merchant sales, can move the USD total.
Because the model is refreshed when new trade series and listed-company disclosures are released, and because ASP progression is re-fitted using updated mix signals instead of a flat escalation, the 2026 starting point used by Mordor Intelligence can differ from figures that were set on an earlier currency window or a simpler price curve.
Benchmark comparison
| Source | Market Size | Gaps in Research Methodology |
|---|---|---|
| Mordor Intelligence | USD 17.22 B (2026) | |
| Trade Journal A | USD 15.90 B (2025) | Uses a prior-year starting point and presents a single national total, with limited visibility on captive versus merchant API and a simpler approach to USD conversion timing. |
| Industry Blog B | USD 23.30 B (2030) | Leans on a forward year that may reflect a more optimistic mix shift and pricing uplift, with less evidence shown on how compliance-driven capacity constraints were treated. |
Overall, the spread is best explained by year selection and how price and mix are updated, rather than a disagreement that one single number is right for every use case. By keeping assumptions tied to observable trade and production signals and then re-validating with interviews, the estimate stays traceable to steps that can be repeated as new data comes out.


Key Questions Answered in the Report
How large is the China active pharmaceutical ingredients market in 2026?
It is valued at USD 17.22 billion and is projected to reach USD 25.13 billion by 2031, registering a 7.85% CAGR.
Which segment is expanding fastest by synthesis type?
Biotech-derived APIs are growing at an 11.85% CAGR thanks to a robust domestic biologics pipeline.
What share do merchant suppliers hold?
Merchant operations controlled 58.55% of 2025 revenue and are on track for an 8.25% CAGR through 2031.
Why is neurology API demand accelerating?
Rising Alzheimer's and Parkinson's prevalence in an aging population drives a 12.81% CAGR for neurology molecules.
How is VBP affecting API profitability?
National procurement demands price cuts of 30% or more, squeezing margins on generic APIs and pushing producers toward high-value niches.
What environmental rules shape future investments?
The 14th Five-Year Plan requires costly wastewater and emission upgrades, compelling smaller plants to consolidate or exit the market.
Page last updated on:


 Your data is secure and never sold or shared.


