
Chilled Processed Food Market Size and Share
Market Overview
| Study Period | 2021 - 2031 |
|---|---|
| Market Size (2026) | USD 0.9 Trillion |
| Market Size (2031) | USD 1.21 Trillion |
| Growth Rate (2026 - 2031) | 6.10 % |
| Fastest Growing Market | Asia Pacific |
| Largest Market | Europe |
| Market Concentration | Medium |
Major Players
*Disclaimer: Major Players sorted in no particular order Image © Mordor Intelligence. Reuse requires attribution under CC BY 4.0. |
|
Chilled Processed Food Market Analysis by Mordor Intelligence
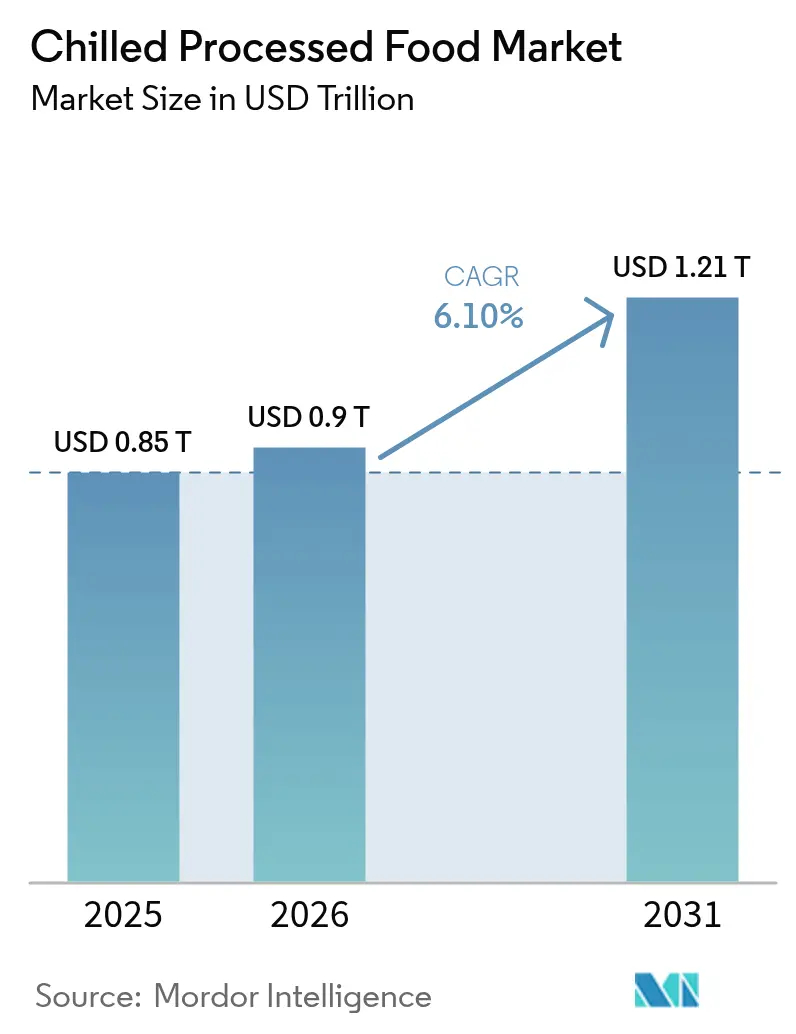
The chilled processed food market size in 2026 is estimated at USD 0.9 trillion, growing from 2025 value of USD 0.85 trillion with 2031 projections showing USD 1.21 trillion, growing at 6.10% CAGR over 2026-2031. The widespread adoption of advanced cold chain systems, coupled with the accelerating pace of urban migration and consistent investments in innovative product preservation technologies, is collectively driving this market expansion. Consumers with limited time increasingly prefer convenient ready-to-eat and ready-to-cook product formats, while the growing demand for protein-rich options, such as poultry and seafood, continues to support volume growth. In response to stringent sustainability regulations in key economies, companies are redesigning packaging solutions to achieve a balance between environmental responsibility and maintaining optimal shelf-life performance. Although the competitive intensity remains moderate, leading global players are leveraging strategies such as vertical integration and the implementation of digital traceability systems to safeguard their profit margins. These efforts align with the preferences of health-conscious consumers who value products that retain nutrients and minimize waste.
Key Report Takeaways
- By product category, processed poultry led with 24.12% of the chilled processed food market share in 2025; ready meals are projected to expand at a 7.62% CAGR through 2031.
- By packaging type, pouches accounted for 40.55% revenue share in 2025, while boxes are set to grow at a 6.31% CAGR through 2031.
- By form, ready-to-eat products captured 62.68% share of the chilled processed food market size in 2025; the ready-to-cook segment is advancing at an 8.19% CAGR to 2031.
- By distribution channel, off-trade held 64.02% share in 2025, whereas on-trade is forecast to recover at a 7.65% CAGR through 2031.
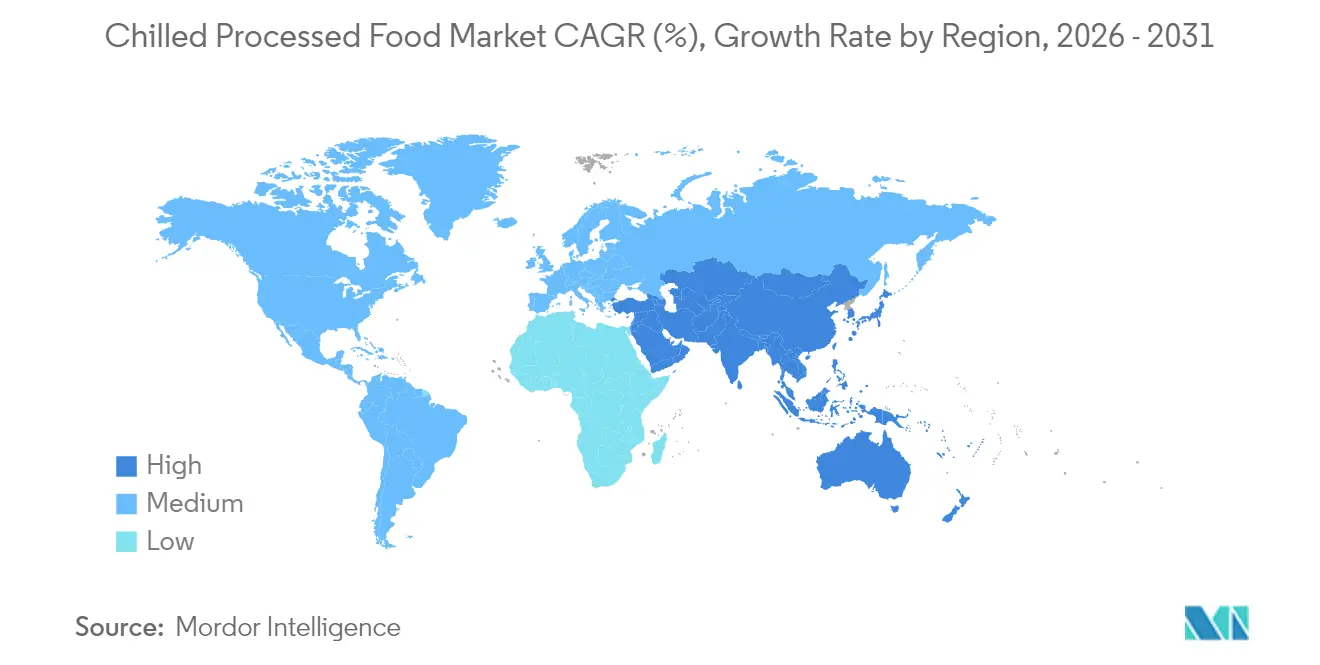
- By geography, Europe commanded 33.10% share in 2025, while Asia-Pacific is positioned for the fastest 7.92% CAGR through 2031.
Note: Market size and forecast figures in this report are generated using Mordor Intelligence’s proprietary estimation framework, updated with the latest available data and insights as of 2026.
Global Chilled Processed Food Market Trends and Insights
Drivers Impact Analysis*
| DRIVER | (~) % IMPACT ON CAGR FORECAST | GEOGRAPHIC RELEVANCE | IMPACT TIMELINE |
|---|---|---|---|
| Urbanization and hectic lifestyles fuel demand for ready meals | +1.2% | Global, strongest in Asia-Pacific megacities | Medium term (2-4 years) |
| Advances in preservation technologies surge demand for processed food | +0.9% | North America and Europe, spreading to Asia-Pacific | Long term (≥ 4 years) |
| Increased awareness boosts demand for protein-rich chilled meats | +0.8% | High-income regions worldwide | Short term (≤ 2 years) |
| Expansion of cold chain logistics infrastructure globally | +1.1% | Asia-Pacific core, spill-over to Middle East and South America | Long term (≥ 4 years) |
| Retail and online food distribution expansion bolsters product supply | +0.6% | Global | Medium term (2-4 years) |
| Innovation in packaging extends product shelf life | +0.8% | Global, strongest in Asia-Pacific | Medium term (2-4 years) |
| Source: Mordor Intelligence | |||
Urbanization and hectic lifestyles fuel demand for ready meals
Urban population growth is driving significant changes in food consumption patterns, with ready meals experiencing rapid adoption as time-constrained consumers increasingly prioritize convenience over traditional meal preparation. The rise in dual-income households is a key factor propelling this demand. According to the Bureau of Labor Statistics[1]Source: Bureau of Labor Statistics, "Employment Characteristics of Families 2024", www.bls.gov, in 2024, 49.6% of married-couple families in the United States had both spouses employed, highlighting the growing dependence on Ready-to-Eat foods as efficient meal solutions for busy households. The USDA's livestock and poultry outlook forecasts beef production to reach 25.79 billion pounds by 2025, ensuring a stable supply of processed meats to meet the rising demand for ready meal applications[2]Source: USDA Economic Research Service, “Livestock and Poultry Outlook May 2025,” www.usda.gov. This demographic shift is driving consistent demand for portion-controlled, shelf-stable products tailored to the constraints of urban lifestyles. The convergence of urbanization and the increase in dual-income households is further accelerating this trend, as available time for meal preparation continues to decline. Regulatory frameworks are evolving to address these changes. For instance, Canada’s upcoming front-of-package nutrition labeling requirements, effective January 2026, will mandate clearer nutritional information on prepackaged foods exceeding specified thresholds for sodium, saturated fat, and sugar, ensuring greater transparency for consumers.
Advances in preservation technologies surge demand for processed food
Advancements in chilling and preservation technologies are transforming product quality and shelf life. The increasing standard cold storage temperatures can significantly lower energy consumption without compromising food safety, signaling potential efficiency gains across the industry. Innovations in packaging materials, such as ethylene-vinyl acetate-vinyl alcohol copolymers regulated under 21 CFR 177.1360, support extended shelf life while adhering to food contact safety regulations. These technological improvements not only minimize food waste but also enhance distribution reach, particularly in emerging markets with underdeveloped cold chain infrastructure. Additionally, the FDA's draft guidance on hazard analysis and risk-based preventive controls highlights the critical role of technology in maintaining food safety throughout the supply chain.
Increased awareness boosts demand for protein-rich chilled meats
With the growing emphasis on health consciousness among consumers, there is a significant shift toward protein-focused dietary habits. Chilled meat products are gaining traction due to their perceived freshness compared to frozen alternatives, while also offering an extended shelf life relative to fresh meat. According to the USDA, pork production is anticipated to reach 28.51 billion pounds by 2025, driven by the increasing demand for protein-enriched processed meat products. In the United Kingdom, a strategic investment of GBP 200 million in the Animal and Plant Health Agency laboratories aims to enhance biosecurity measures, safeguard livestock health, and strengthen the country's competitive edge in the global processed meat export market[3]Source: UK Department for Environment Food & Rural Affairs, “Food Security Report 2024,” www.gov.uk. Furthermore, the implementation of HACCP requirements under 9 CFR Part 417 necessitates a comprehensive hazard analysis for meat processing facilities. This regulatory framework not only ensures product safety but also supports the premium positioning of protein-rich chilled meat products in the market.
Expansion of cold chain logistics infrastructure globally
The chilled processed food market is experiencing significant growth, primarily driven by the expansion of cold chain logistics infrastructure to meet the rising demand for perishable food items and temperature-sensitive products. Government investments targeted at strengthening food security and reducing post-harvest losses are driving significant advancements in cold chain infrastructure. These initiatives are enabling businesses to expand their market presence in previously underserved regions, creating new growth opportunities. In the United Kingdom, a GBP 43 million investment in truckstop facilities is enhancing logistics networks, which are essential for maintaining the integrity of temperature-controlled food distribution systems[4]Source: UK Department of Transport, "National Lorry Week", www.gov.uk. This investment underscores the importance of robust infrastructure in ensuring supply chain efficiency. Similarly, China's 2025 policy framework prioritizes large-scale equipment upgrades, supported by financial instruments such as special bonds and subsidies. These measures aim to modernize cold chain systems, particularly within the agricultural and food processing sectors, thereby improving operational capabilities and fostering market expansion. Furthermore, compliance with refrigeration equipment regulations under 21 CFR 1250.34 requires the adoption of advanced systems for precise temperature monitoring and contamination prevention. These regulatory standards are instrumental in elevating the technical quality, reliability, and overall performance of cold chain infrastructure, ensuring alignment with global best practices.
Restraints Impact Analysis*
| RESTRAINT | (~) % IMPACT ON CAGR FORECAST | GEOGRAPHIC RELEVANCE | IMPACT TIMELINE |
|---|---|---|---|
| Competition from fresh alternatives hinders growth | -0.7% | Developed markets with dense fresh supply chains | Short term (≤ 2 years) |
| Strict food safety regulations restricts growth | -0.5% | North America and Europe, increasingly global | Medium term (2-4 years) |
| High capital investment requirements increases the cost of final product | -0.4% | Asia-Pacific | Short term (≤ 2 years) |
| Short shelf life of chilled foods lessens demand | -0.5% | Global | Medium term (2-4 years) |
| Source: Mordor Intelligence | |||
Competition from fresh alternatives hinders growth
Fresh food alternatives are intensifying competitive dynamics by capitalizing on perceived quality and health benefits. Consumer preferences are shifting toward minimally processed options, even at the expense of convenience. The growing local food movement is disrupting the positioning of processed foods, particularly in developed markets where shorter supply chains facilitate access to fresh products. The 2024 UK Food Security Report highlights the alignment of global food production with population growth, ensuring a steady supply of fresh foods that directly compete with processed alternatives. Seasonal price volatility in fresh produce creates periodic margin pressures for processed food manufacturers, especially during peak harvest seasons. The USDA's initiatives to minimize food loss and waste through enhanced fresh food handling are expected to extend product shelf life, further intensifying competition with processed foods. Consumer education campaigns promoting fresh food consumption are eroding the market share of processed foods, compelling manufacturers to innovate in areas such as convenience and nutritional value to sustain their competitive edge.
Strict food safety regulations restricts growth
Rising regulatory compliance costs are impacting businesses as food safety standards become increasingly stringent. The FDA's HACCP implementation requirements now mandate detailed hazard analysis and preventive control systems. Additionally, the FDA's Food Traceability Final Rule compels processed food manufacturers to enhance supply chain documentation, leading to higher operational costs and complexity. International trade investigations, such as antidumping duties on shrimp from China and India, highlight regulatory actions that can disrupt supply chains and escalate expenses. The USDA's mandatory testing for interstate dairy cattle movement, aimed at controlling the spread of H5N1, demonstrates how disease control measures can restrict supply chain flexibility. Packaging regulations under 21 CFR 177.1360, which set extractive limitations for food contact materials, require extensive testing and validation, increasing product development costs and delaying time-to-market. Furthermore, the Association of Food and Drug Officials' HACCP guidance for specialized retail processes underscores the need for regulatory approval of innovative processing methods, potentially slowing the adoption of new technologies.
*Our forecasts treat driver/restraint impacts as directional, not additive. The impact forecasts reflect baseline growth, mix effects, and variable interactions.
Segment Analysis
By Product Type: Ready Meals Drive Innovation
Processed poultry maintained the largest 24.12% slice of the chilled processed food market share in 2025, underpinned by efficient feed-to-protein conversion and broad recipe versatility. However, ready meals are leading the growth trajectory with a 7.62% CAGR, as urban consumers increasingly demand convenient, heat-and-eat solutions that deliver balanced nutrition. Robust livestock production in North America and consistent global vegetable supplies ensure a stable ingredient pipeline, essential for large-scale entrée manufacturing. Companies are differentiating their offerings through ethnic flavor innovations and portion-controlled packaging designed for single-person households.
The chilled processed food market is enhancing its value proposition by integrating premium nutritional features, such as high-fiber grain blends and reduced-sodium sauces. Seafood ready meals are experiencing strong growth, supported by government initiatives promoting omega-3 consumption, including the UK's Seafood Fund grant for freezing technology upgrades at Denholm Seafoods. Additionally, products like pizza, soup, and noodles are leveraging their comfort-food positioning to maintain demand, even as consumers adjust their discretionary spending amid economic uncertainties.


By Packaging: Sustainability Drives Box Growth
In 2025, pouches accounted for 40.55% of market revenue, driven by cost efficiencies associated with lightweight freight. However, boxes are anticipated to grow at a 6.31% CAGR as retailers increasingly adopt fiber-based packaging formats aligned with circular economy objectives. The market for chilled processed foods is expected to witness significant growth in recyclable carton solutions, contingent on the implementation of standardized on-pack labeling schemes that simplify household sorting. Leading converters are integrating moisture-resistant coatings, enabling freezer-ready packaging without compromising structural integrity.
Adoption of monomaterial pouches and paper-based trays is accelerating as companies work to meet the 2026 European packaging waste compliance thresholds. Meanwhile, boxes offer large printable surfaces ideal for nutritional graphics that align with Canada’s forthcoming front-of-package labeling requirements, making them a preferred choice for premium SKUs targeting health-conscious consumers. Manufacturers are evaluating investments in carton-line automation against potential long-term cost savings from reduced extended producer responsibility fees. Over the forecast period, packaging innovation will prioritize balancing barrier functionality with recyclability at the end of the product lifecycle.
By Form: Ready-to-Cook Gains Momentum
Ready-to-eat items commanded 62.68% of the 2025 total revenue, reflecting entrenched demand for immediate consumption convenience. Conversely, the ready-to-cook segment is experiencing significant growth, with a CAGR of 8.19%, driven by consumers seeking a more engaging cooking experience without the need to procure raw ingredients. As at-home dining gains renewed importance in the post-pandemic era, the chilled processed food market, particularly marinated proteins and par-fried vegetables, is expected to expand further. Retailers are addressing this demand by offering meal-kit style bundles that integrate seasoned meats, sauces, and side vegetables at consolidated price points.
HACCP compliance ensures product safety during partial cooking and blast-chilling processes, enhancing consumer trust in pathogen control measures. The ready-to-cook category is also leveraging the growing adoption of air fryers, emphasizing the ability to deliver crisp textures with minimal oil usage. Nutritional transparency is appealing to health-conscious millennials, who value the flexibility to adjust seasoning to their preferences. Furthermore, as energy costs fluctuate, products designed for quick preparation in ovens or on stovetops provide a cost-efficient alternative to traditional, longer cooking methods.
By Distribution Channel: On-Trade Recovery Accelerates
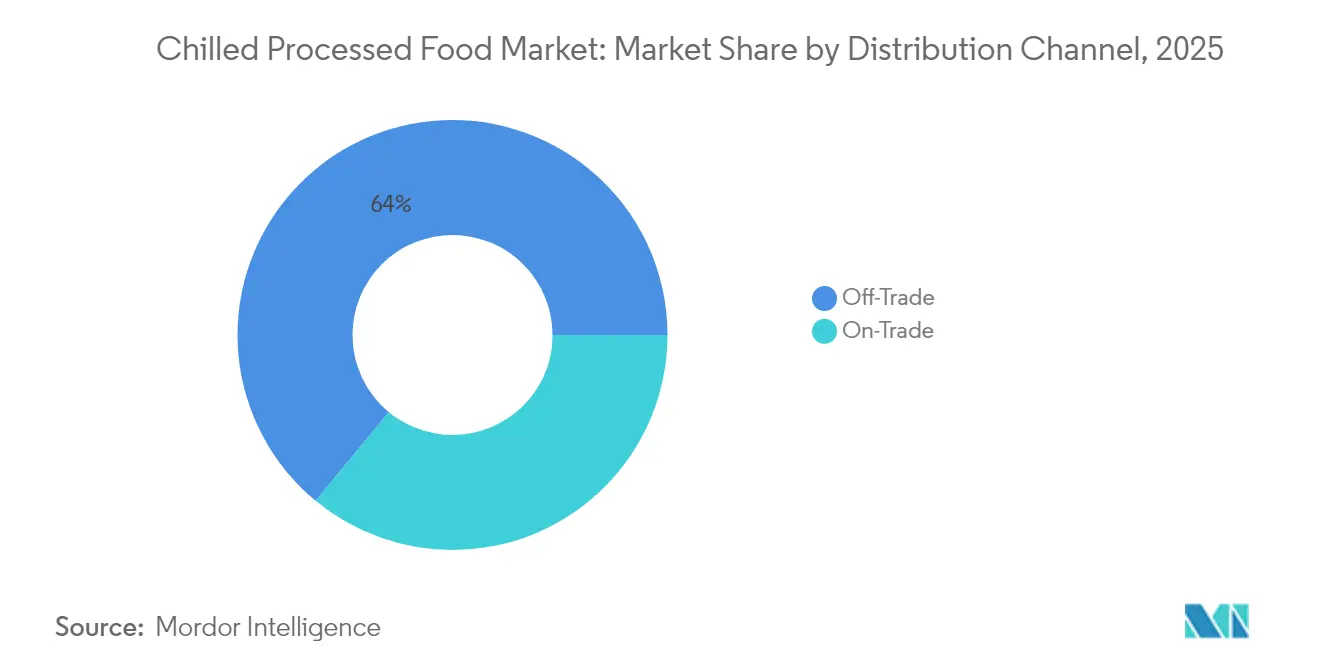
In 2025, off-trade sales dominated the market, contributing 64.02% to total revenue. Supermarkets, club stores, and e-commerce platforms capitalized on pandemic-driven consumer behaviors to maintain their stronghold. Digital grocery platforms are driving growth in the chilled processed food market by utilizing targeted promotions and bundled offers. Additionally, retail private labels are launching exclusive chilled product lines to strengthen customer retention strategies and protect profit margins.
On-trade sales are experiencing a robust recovery, with a 7.65% CAGR. Restaurants, cafeterias, and hotels are enhancing their menus by integrating chilled ingredients that ensure consistent year-round availability. The UK’s domestic freight movement, which reached 207 billion tonne-kilometres in 2023, underscores the revitalization of hospitality supply chains. Industry operators are adopting IQF vegetables and pre-portioned proteins to optimize kitchen operations and reduce food waste. The segment's growth is driven by the demand for premium ingredient authenticity and reliable sensory quality, meeting the evolving expectations of consumers.
Geography Analysis
Europe held 33.10% of 2025 revenue, underlining its long-established cold-chain reach and diverse consumer base. EU sustainability regulations are driving brands to deliver measurable waste reduction and recyclable packaging solutions, creating a premium segment with higher average selling prices. According to Eurostat, slight declines in bovine and pig herds have tightened the regional supply of chilled meats, supporting price stability for value-added products. Innovation efforts are now focused on fortified, convenient meal solutions tailored to the ageing population while maintaining authentic regional flavors.
Asia-Pacific is the fastest-growing region, with a 7.92% CAGR projected through 2031, driven by urbanization and rising disposable incomes. Government initiatives, such as subsidies aimed at upgrading cold-storage infrastructure, are playing a pivotal role in accelerating the rural electrification of refrigerated depots. These efforts are expanding the availability of protein products, particularly in tier-three cities, thereby addressing growing consumer demand. Additionally, the customization of flavors and portion sizes remains a strategic priority for businesses to effectively meet the diverse and dynamic culinary preferences across the Asia-Pacific markets.
North America continues to exert significant influence, supported by robust supply chains and a consumer base familiar with freezer categories. The USDA projects sufficient beef production to meet both domestic and export demands, ensuring stable raw material inputs for meal manufacturers. In Canada, the upcoming 2026 nutrition labeling regulations are prompting reformulations and clearer front-panel communication. The market's growth will depend on balancing indulgence with the increasing demand for clean-label products, as retailers emphasize plant-based chilled options alongside traditional proteins.

Regulatory Landscape
Food safety and traceability compliance tightened across major chilled processed food markets in 2026, raising documentation and validation requirements for ready-to-eat and temperature-controlled supply chains. In the United States, the FDA FSMA rule on Requirements for Additional Traceability Records for Certain Foods reached its compliance date on January 20, 2026, expanding recordkeeping expectations across listed foods and related cold chain nodes. In the European Union, Regulation (EU) 2024/2895 (amending microbiological criteria under Regulation (EC) 2073/2005) became applicable on July 1, 2026, strengthening Listeria monocytogenes requirements for ready-to-eat foods across the full shelf life and increasing the emphasis on shelf-life studies, environmental monitoring, and packaging-performance validation.
Trade-facing controls also added operational checkpoints for global manufacturers and exporters. In China, GACC Decree 280 implementation guidance (effective June 1, 2026) introduced facility registration and official recommendation requirements that extend to overseas cold storage facilities handling terrestrial animal and aquatic products, affecting inbound compliance workflows for chilled meat and seafood. At the global level, the Codex Alimentarius Commission in July 2026 adopted revisions to guidance for controlling Campylobacter and Salmonella in chicken meat and Listeria monocytogenes in foods, reinforcing harmonized reference points that shape national inspection focus and customer audit standards in multinational chilled processed food supply chains.
Value Chain Analysis
The chilled processed food value chain runs from agricultural and livestock inputs (meat, poultry, seafood, dairy, and vegetables) through ingredient processing, formulation and cooking or partial cooking, rapid chilling, packaging, and cold storage before distribution via refrigerated transport to retail and foodservice. Compliance-driven controls (HACCP programs, microbiological criteria for ready-to-eat foods, and traceability recordkeeping) increasingly influence process design, packaging selection, and shelf-life validation. Temperature integrity also depends on continuous refrigeration across warehouses, cross-docks, and last-mile delivery.
Cold chain infrastructure and transport availability remain key cost and service determinants. In North America, Americold opened a 335,000-square-foot import-export hub in Kansas City (August 2025) with CPKC to support refrigerated intermodal flows between the United States and Mexico, and the company also added a Port of Jebel Ali cold storage site in partnership with DP World (September 2025) with 40,000 pallet positions for regional distribution. At the same time, tightening reefer trucking capacity adds execution risk in peak seasons. C.H. Robinson reported a materially higher 2026 U.S. refrigerated truckload cost-per-mile outlook linked to carrier capacity constraints, which is pushing manufacturers and retailers toward earlier planning, intermodal options, and network consolidation to protect service levels for chilled ready meals and protein products.
Competitive Landscape
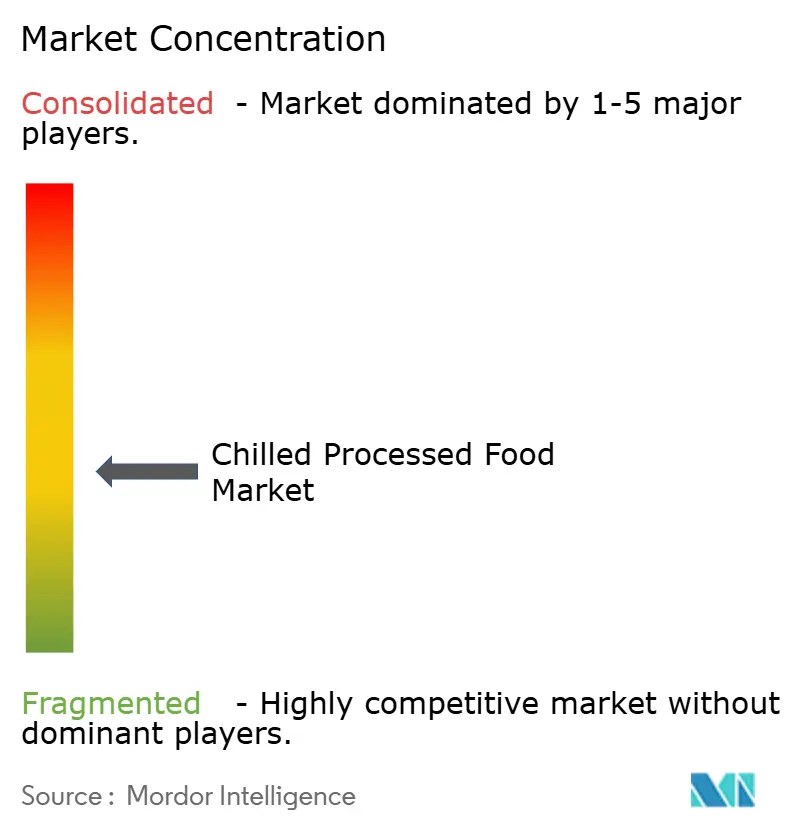
The market for chilled processed food is moderately fragmented, with vendors competing in terms of innovation, pricing, and distribution. Processed food needs to be stored at a very low temperature so as to maintain quality, which requires high capital investment. Hence, they are considered a major challenge to the vendors. Some of the major key players in the chilled processed food market include Nestlé S.A., Kraft Heinz Company, Vion Food Group, Conagra Brands, Inc., and General Mills, Inc.
Midsize players are strategically positioning themselves by focusing on niche markets such as allergen-friendly and high-protein specialties. These companies frequently leverage co-manufacturing agreements to penetrate export markets, enabling them to expand their reach without incurring substantial capital expenditures. Investments in advanced freezing technologies and the implementation of smart warehouse automation systems are enhancing operational efficiency. These advancements not only increase throughput but also reduce energy consumption, providing a significant cost advantage in a competitive market landscape.
As consumer preferences continue to evolve alongside changing regulatory requirements, companies that prioritize the development of clean-label, fresh, convenient, and environmentally sustainable products are well-positioned to secure market leadership. By integrating technological advancements and optimizing supply chain operations, these businesses are capitalizing on growth opportunities within this rapidly expanding sector.
Chilled Processed Food Industry Leaders
-
Kraft Heinz Company
-
Vion Food Group
-
Conagra Brands, Inc.
-
General Mills, Inc.
-
Nestlé S.A.
- *Disclaimer: Major Players sorted in no particular order

Market Opportunities and Future Outlook
Regulatory tightening around ready-to-eat safety and traceability is increasing demand for proven shelf-life extension and monitoring solutions in chilled processed foods, including higher-frequency environmental controls, validated packaging performance, and supply-chain-wide documentation. The EU application of Regulation (EU) 2024/2895 on July 1, 2026 increased operational emphasis on Listeria management across the entire shelf life, and the Chilled Food Association issued guidance in January 2026 to support implementation. This combination creates a clearer pathway for manufacturers to standardize verification approaches and justify investments in process controls and packaging formats that protect chilled quality.
Opportunities also concentrate in scalable, multi-temperature production and distribution nodes that simplify national coverage for ready meals and chilled meal solutions. In Canada, Factor Meals opened a 50,000 sq ft kitchen and distribution center in Calgary in June 2026 to support nationwide delivery. In the United Kingdom, Compass Group announced a 10,000 sqm food factory in Derby (July 2026) with a stated capacity of 70 million meals annually, highlighting continuing capacity build-out for prepared-meal offerings. Logistics and trade infrastructure investments also widen whitespace for chilled portfolios, such as the June 2026 agreement to develop 38 hectares at the Rotterdam Food Hub with cold/frozen storage and terminal infrastructure, supporting higher-throughput import, processing, and distribution flows for temperature-controlled foods in Europe.
Recent Industry Developments
- June 2026: The Kraft Heinz Company announced a new global operating structure effective July 1, 2026, reorganizing into three regions and centralizing Procurement and Supply Chain. The change is intended to tighten end-to-end control over sourcing and cold chain execution for processed and chilled portfolios while simplifying decision-making across markets.
- July 2025: BRF introduced a chilled chicken line in Saudi Arabia to expand its domestic presence in the Kingdom. The launch increases local availability of chilled protein products and supports broader chilled assortment depth as cold chain capacity and modern retail formats expand.
- August 2024: Mars Incorporated completed its acquisition of Kellanova, adding brands such as Eggo breakfast foods and MorningStar Farms to its portfolio. The deal strengthens scale in packaged food categories that overlap with convenience-led consumption occasions and can influence channel leverage in retail and foodservice.


Research Methodology Framework and Report Scope
Market Definition and Coverage
For this study, the market covers packaged foods that are processed and sold in a chilled state, which are kept under refrigeration through storage, transport, and retail until purchase and consumption.
Scope exclusions: We exclude frozen processed foods, shelf-stable ambient packaged foods, and fresh unprocessed meat, seafood, and produce sold without a processed format.
Segmentation Overview
-
By Product Type
- Processed Red Meat
- Processed Poultry
- Processed Fish and Seafood
- Processed Vegetables and Potatoes
- Bakery Products
- Ready Meals
- Pizza, Soup and Noodles
-
By Packaging
- Pouches
- Boxes
- Others
-
By Form
- Ready-to-Eat (RTE)
- Ready-to-Cook (RTC)
-
By Distribution Channel
-
Off-Trade
- Supermarkets/Hypermarkets
- Convenience/Grocery Stores
- Online Retail Stores
- Other Distribution Channels
- On-Trade
-
Off-Trade
-
By Geography
-
North America
- United States
- Canada
- Mexico
- Rest of North America
-
Europe
- Germany
- United Kingdom
- Italy
- France
- Spain
- Netherlands
- Poland
- Belgium
- Sweden
- Rest of Europe
-
Asia-Pacific
- China
- India
- Japan
- Australia
- Indonesia
- South Korea
- Thailand
- Singapore
- Rest of Asia-Pacific
-
South America
- Brazil
- Argentina
- Colombia
- Chile
- Peru
- Rest of South America
-
Middle East and Africa
- South Africa
- Saudi Arabia
- United Arab Emirates
- Nigeria
- Egypt
- Morocco
- Turkey
- Rest of Middle East and Africa
-
North America
Data Sources, Market Sizing, and Validation
Desk Research
Desk research was used to set the market boundaries and to build a consistent fact base on refrigerated food supply, cold-chain penetration, and retail dynamics. We typically refer to public sources such as the USDA, Eurostat, FAO, and national statistical offices for consumption and price series, and then check trade flows using UN Comtrade where it is relevant for processed food categories.
To keep assumptions realistic, we also review company annual reports and investor presentations for category exposure and geographic mix, along with trade association updates and reputable press coverage on chilled logistics, packaging, and food safety topics. Patent databases were used selectively to understand where processing and packaging improvements were being commercialized, including shelf-life extension and barrier packaging. The desk sources listed here are not exhaustive, and many other public references were also used for data collection, cross-checking, and clarification.
Primary Interviews and Surveys
Primary work focused on validating what is actually sold as chilled processed food across key regions, and on stress-testing inputs like price movement, channel shares, and category-level growth. We spoke with a mix of manufacturers, distributors, retailers, and cold-chain stakeholders. Feedback was compared across APAC, EMEA, and the Americas so the assumptions did not anchor to a single demand pattern.
Distribution of primary research fieldwork respondents
| Company type | Respondent position | Region |
|---|---|---|
| Top tier: 37% | CXOs: 20% | APAC: 47% |
| Mid tier: 43% | Functional/Unit leaders: 25% | EMEA: 35% |
| Smaller Players: 20% | Managers: 55% | Americas: 18% |
Market-Sizing & Forecasting
Sizing starts with a top-down build where packaged food consumption is reconstructed into a chilled processed demand pool using refrigeration-linked indicators, then totals are distributed by region using retail and foodservice splits that came up repeatedly in expert inputs. After the first pass, we used selective bottom-up approximations as a reality check, such as sampled category volumes multiplied by observed price ranges and channel checks.
A few market fingerprints treated as key inputs include the share of modern grocery and e-grocery in food sales, cold-chain storage and transport availability, average price progression in chilled categories, private label share trends, and the typical shelf-life and waste rates that drive replenishment intensity. When a data gap appeared in a country series, we used proxy indicators from a comparable market and adjusted the proxy using interview feedback so it stayed consistent with local retail structure.
For forecasting, scenario analysis was used, since growth in chilled processed foods is sensitive to consumer income, inflation-driven trade-down, and how fast cold-chain and last-mile capacity expands. The final outlook was set only after reviewing the variable paths with primary respondents, and the model outputs were kept within realistic ranges versus historical demand behavior.
Data Validation & Update Cycle
Outputs were checked through multiple steps, starting with consistency checks across regions, category totals, and implied per-capita consumption, followed by variance reviews on price and growth assumptions. When the model produced an unusual jump in a country or channel, we traced the driver back to a single input, then re-tested against independent signals such as retail expansion, cold storage rollouts, and trade movement.
Before sign-off, the work is reviewed by another analyst, and re-contacts are triggered when a key assumption changes or when new public statistics materially shift the demand picture. Reports are refreshed annually, and interim updates are made when major events affect pricing, cold-chain constraints, or consumer spending. Right before delivery, a final update pass is completed so clients receive the most current view.
Mordor Intelligence's Chilled Processed Food Market Size Measured Against Other Published Estimates
Published numbers for chilled processed foods often vary because the product list counted as "chilled" is not consistent, and because some studies treat pricing and channels in different ways. Differences also come from whether value is measured at retail selling price versus earlier points in the supply chain, and from how quickly assumptions are refreshed when inflation and category mix shift.
The main gap comes from scope choices around what counts as chilled processed food, where Mordor Intelligence counts only refrigerated processed categories tracked through retail and relevant foodservice channels, instead of folding in chilled beverages or fresh-cut produce kits that are sometimes grouped under broader chilled foods.
Benchmark comparison
| Source | Market Size | Gaps in Research Methodology |
|---|---|---|
| Mordor Intelligence | USD 0.90 T (2026) | |
| Industry Publisher A | USD 684.00 B (2024) | Uses a 2024 base year and can reflect a different scope and pricing point, with some definitions emphasizing selected chilled categories and country roll-ups that may not align with a strict processed-food-only treatment. |
| Global Consultancy B | USD 190.78 B (2026) | Represents values at factory gate and includes adjacent chilled items such as fresh-cut produce kits and chilled beverages, which can compress the comparable processed-food total and shift channel weighting. |
The spread in the table is mostly explained by what is counted in-scope and where value is measured in the chain, which then changes the implied price per unit and growth base. By keeping the inputs tied to clear chilled processed categories, realistic channel splits, and observable price movement, the final number stays traceable to repeatable steps rather than one-off assumptions.


Key Questions Answered in the Report
What is the current size of the chilled processed food market?
The chilled processed food market size reached USD 0.9 trillion in 2026 and is projected to grow to USD 1.21 trillion by 2031.
Which region is expanding fastest in this sector?
Asia-Pacific leads growth with an expected 7.92% CAGR through 2031, driven by urbanization, rising incomes, and rapid cold-chain build-outs.
What product category shows the strongest future growth?
Ready meals are forecast to post a 7.62% CAGR, outpacing all other product types as time-pressed consumers prioritize convenient complete dishes.
How are sustainability trends influencing packaging choices?
Brands are shifting toward fiber-based boxes and recyclable mono material pouches to comply with emerging waste regulations and meet consumer eco-preferences.
Page last updated on:


 Your data is secure and never sold or shared.


