
Market Overview
| Study Period | 2020 - 2031 |
|---|---|
| Forecast Data Period | 2026 - 2031 |
| Base Year Market Size (2025) | USD 4.63 Billion |
| Market Size (2026) | USD 4.79 Billion |
| Market Size (2031) | USD 5.65 Billion |
| Growth Rate (2026 - 2031) | 3.38 % |
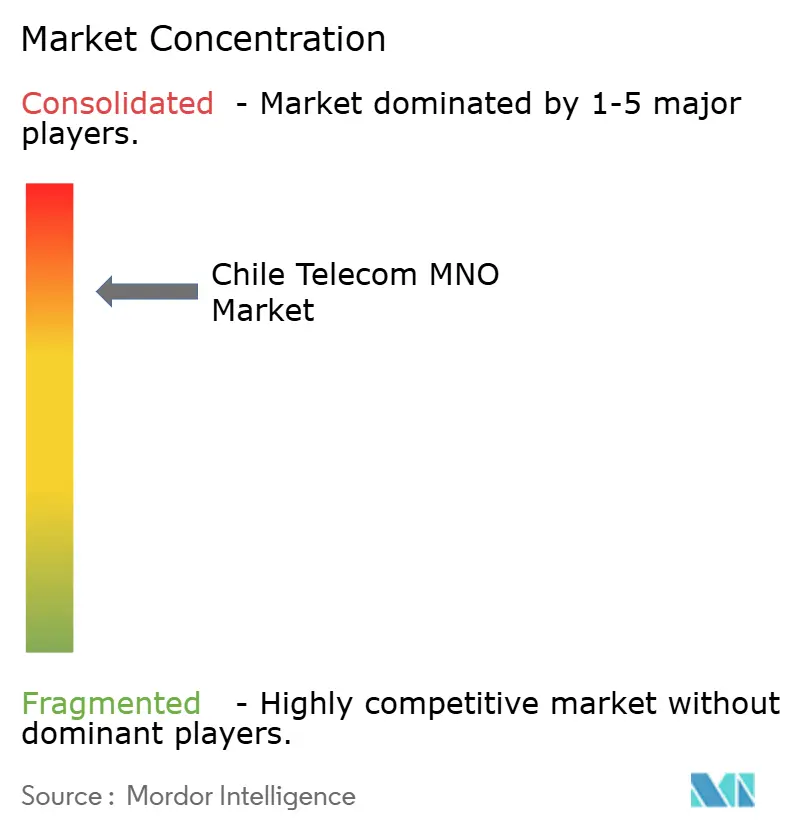
| Market Concentration | High |
Major Players *Disclaimer: Major Players sorted in no particular order Image © Mordor Intelligence. Reuse requires attribution under CC BY 4.0. | |
Chile Telecom MNO Market Analysis by Mordor Intelligence
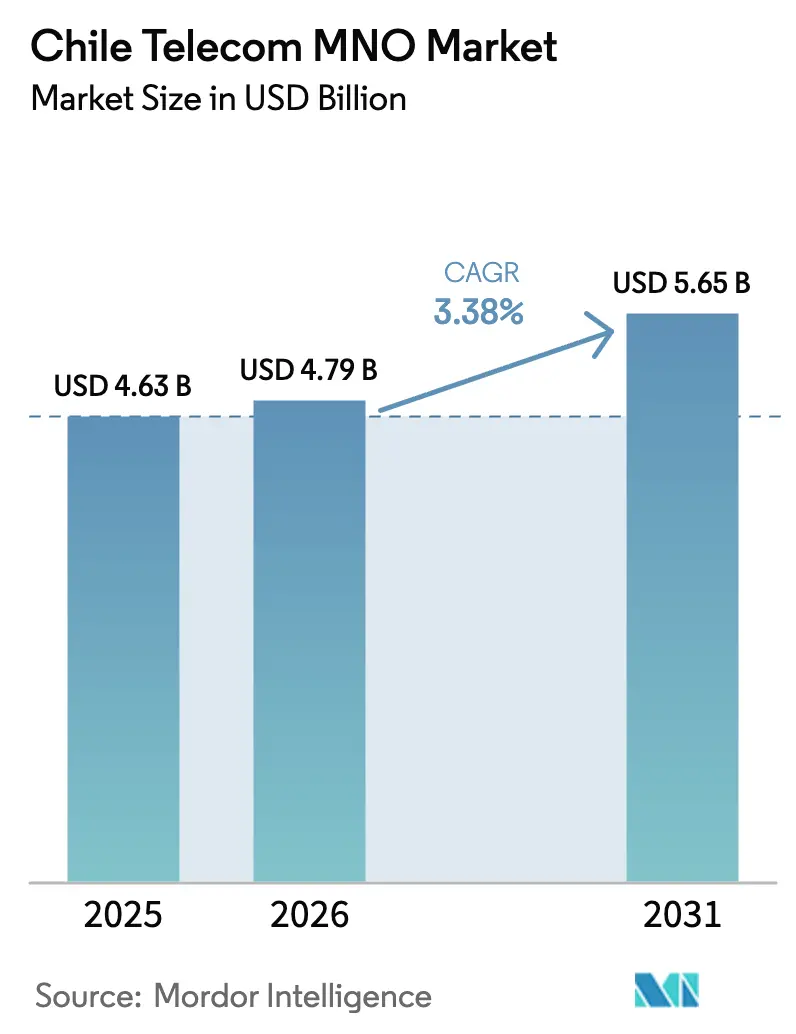
The Chile Telecom MNO Market size is expected to grow from USD 4.63 billion in 2025 to USD 4.79 billion in 2026 and is forecast to reach USD 5.65 billion by 2031 at 3.38% CAGR over 2026-2031.
Mobile data consumption, the transition to 5G, and enterprise digitalization propel revenue even as price competition constrains average revenue per user. Operators are expanding network capacity, embracing satellite back-up links, and adopting infrastructure-sharing models to ease capital requirements. Consumer demand for unlimited data plans continues to rise, while enterprises seek low-latency connectivity for IoT deployments in mining and logistics. Heightened financial pressure, illustrated by WOM’s bankruptcy filing and ClaroVTR’s multi-billion-dollar impairment, drives strategic asset sales and partnership deals that reshape competitive positioning.
Key Report Takeaways
- By service type, data and internet services held 43.81% of the Chile Telecom MNO market share in 2025, and IoT and M2M services are forecast to expand at a 3.55% CAGR to 2031.
- By end user, consumer connections accounted for 72.65% of the Chile Telecom MNO market size in 2025, while enterprise lines are projected to grow at a 3.84% CAGR through 2031.
Note: Market size and forecast figures in this report are generated using Mordor Intelligence’s proprietary estimation framework, updated with the latest available data and insights as of 2026.
Chile Telecom MNO Market Trends and Insights
Drivers Impact Analysis*
| Driver | (~)% Impact on CAGR Forecast | Geographic Relevance | Impact Timeline |
|---|---|---|---|
| 5G roll-outs and rapid smartphone upgrade cycle | +1.2% | National, with early gains in Santiago, Valparaíso, Concepción | Medium term (2-4 years) |
| Exploding mobile data and video consumption | +0.9% | Global | Short term (≤ 2 years) |
| Government digital-inclusion and spectrum-pricing reforms | +0.6% | National | Long term (≥ 4 years) |
| Enterprise IoT uptake in mining, utilities and logistics | +0.5% | Regional, concentrated in northern mining regions | Medium term (2-4 years) |
| Satellite "direct-to-cell" partnerships for remote zones | +0.3% | National, focusing on remote and rural areas | Long term (≥ 4 years) |
| Fintech-driven demand for secure mobile connectivity | +0.4% | Urban centers, expanding nationally | Short term (≤ 2 years) |
| Source: Mordor Intelligence | |||


5G roll-outs and rapid smartphone upgrade cycle
A four-operator race now covers 20% of total mobile lines with 5G service, led by Movistar’s 1.5 million 5G subscribers, and boosted by Claro’s spectrum win and network launch. Faster hand-set replacement pushes eSIM penetration toward 75% by 2030, while Entel invests USD 286 million to consolidate its 5G footprint and showcase extreme-environment coverage in Antarctica [1]TelecomTalk, “Movistar Chile Announces 1.5 Million 5G Customer Milestone,” Telecomtalk.info. Elevated radio access spending prompts tower-sharing and campus small-cell roll-outs in cities to curb costs. Handset makers accelerate Chilean launches of premium 5G devices, reinforcing higher-tier data plans. The virtuous cycle between network speed and device availability ultimately widens the Chile Telecom MNO market.
Exploding mobile data and video consumption
Average smartphone traffic is set to leap from 4 GB per month in 2022 to 9.22 GB in 2029, reflecting video streaming hunger and cloud storage use. Operators add dense fiber back-haul; median 5G download speed already reaches 171.6 Mbps, justifying differentiated pricing tiers. Video, gaming, and real-time collaboration spur low-latency architecture with edge caching. As high-definition content migrates to mobile screens, advertisers redirect spend to in-app channels, supporting ancillary revenue. This sustained bandwidth demand underpins recurring investment across the Chile Telecom MNO market.
Government digital-inclusion and spectrum-pricing reforms
The National Data Centers Plan of December 2024 allocates USD 2.5 billion for regulatory incentives and green-powered campus builds, positioning Chile as a regional cloud hub [2]Investment Policy Monitor, “Chile – Launches National Data Centers Plan,” Investmentpolicy.unctad.org. Subtel’s auctions bind spectrum to coverage obligations, steering 5G to underserved zones and tightening roll-out timetables. Constitutional digital-rights guarantees compel operators and state entities to extend universal mobile service. While auction fees remain material, staggered payments and tax credits moderate cash-flow impact. Policy consistency lifts investor confidence and sustains long-run growth across the Chile Telecom MNO market.
Enterprise IoT uptake in mining, utilities and logistics
Industrial sectors deploy sensor networks to manage tailings dams, energy assets, and fleet logistics, boosting secure-SIM volumes by double digits annually. Movistar’s LTE-M launch supports 1.5 million IoT endpoints for smart lighting and tracking [3]Developing Telecoms, “Chile’s Movistar Empresas Launches LTE-M Network for IoT,” Developingtelecoms.com. Techint applies Sigfox devices to geolocate machinery on mega-projects, reducing downtime and enhancing worker safety. Northern copper mines adopt private LTE to automate haul trucks and drone inspections. As low-power networks mature, managed connectivity fees diversify operator revenue beyond consumer handsets, enriching the Chile Telecom MNO market.
Restraints Impact Analysis*
| Restraint | (~)% Impact on CAGR Forecast | Geographic Relevance | Impact Timeline |
|---|---|---|---|
| Fierce price wars eroding ARPU | -0.8% | National | Short term (≤ 2 years) |
| High spectrum-fee and coverage-obligation burden | -0.5% | National | Medium term (2-4 years) |
| WOM financial distress limiting 5G competition | -0.3% | National | Short term (≤ 2 years) |
| Supply-chain delays for fiber backhaul gear | -0.2% | National, with rural areas most affected | Medium term (2-4 years) |
| Source: Mordor Intelligence | |||
Fierce price wars eroding ARPU
Entel must pay WOM USD 2.2 billion after a court deemed its win-back promotions anticompetitive, exposing deep discounting tactics [4]Diario Financiero, “Tribunales Condenan a Entel,” Df.cl. Unlimited bundles at sub-USD 10 monthly have become table stakes, compressing voice and SMS yields. Convergent quad-play offers combine mobile, fiber, and OTT video, yet bundle discounts drag blended ARPU. Operators counter with upsell strategies around device financing and gaming passes, but pricing hostility persists, tempering Chile Telecom MNO market revenue expansion.
High spectrum-fee and coverage-obligation burden
WOM’s ICSID arbitration over USD 50 million in 5G fines illustrates capital strain from mandated rural build-outs. The 2024 auction drew only Entel and Claro, as Movistar abstained over fee concerns, reflecting unease with Chile’s upfront valuation of 3.5 GHz blocks. Aggressive obligations force cell-site densification in scarcely populated areas, extending payback periods. Smaller carriers postpone network upgrades or seek wholesale deals, reducing market rivalry. Elevated license cost weighs on free cash flow, compelling asset-light models and joint ventures to sustain national coverage across the Chile Telecom MNO market.
*Our forecasts treat driver/restraint impacts as directional, not additive. The impact forecasts reflect baseline growth, mix effects, and variable interactions.
Segment Analysis
By Service Type: Data traffic outpaces legacy voice
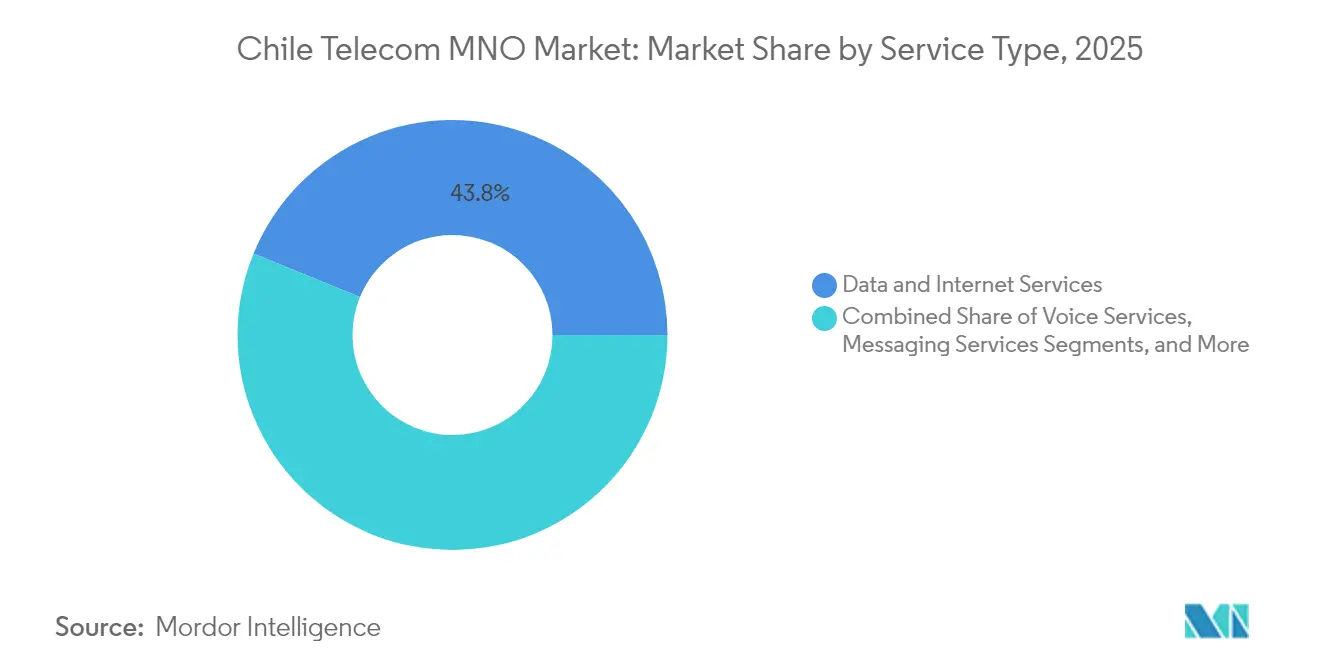
Data and internet services contributed 43.81% of the Chile Telecom MNO market share in 2025, cementing their role as the prime revenue engine. Voice revenue slides each quarter as OTT calling gains ground, while messaging traffic migrates to chat apps. The Chile Telecom MNO market size for IoT and M2M connections is projected to climb at a 3.55% CAGR through 2031, propelled by mining telemetry and smart-city contracts. Operators exploit network slicing to offer premium latency tiers for AR/VR and e-health. PayTV bundles face margin pressure, yet OTT partnerships keep churn low among high-value households. Value-added services such as cloud backup and device insurance round out revenue diversification, reinforcing overall growth.
Investment priorities mirror this shift. Radio-access modernizations dedicate more mid-band spectrum to downlink capacity, and cell-site fiberization accelerates. Edge nodes located in Santiago host video caches that slash latency during peak streaming. Converged operators channel savings from copper switch-off programs into 5G standalone cores, enabling carrier-grade network slicing for industrial customers. As consumption crosses the 10 GB per-month threshold by mid-decade, data-tiered pricing regains relevance, supporting monetization of the Chile Telecom MNO market.


By End User: Enterprises narrow the gap
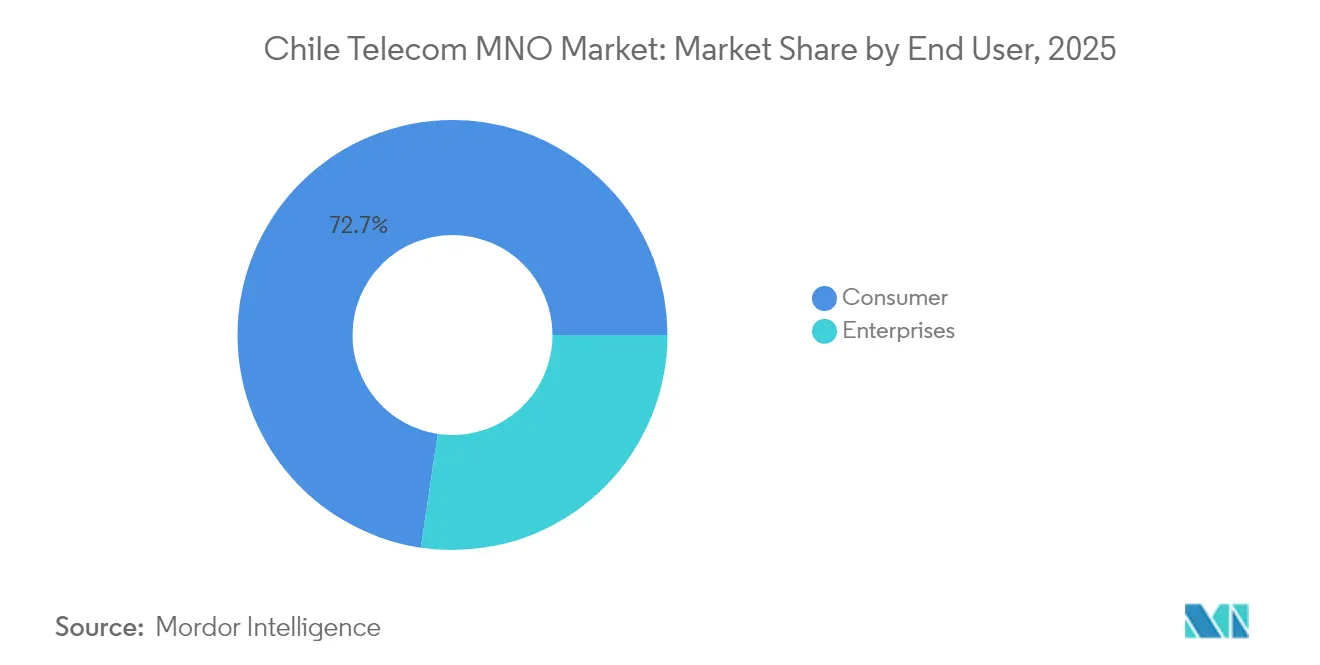
Consumers commanded 72.65% of the Chile Telecom MNO market size in 2025, favored by 91% mobile penetration and affordable smartphones. Prepaid still dominates low-income segments, but postpaid adoption edges upward, driven by handset instalment plans. 5G usage among consumers exceeds 20% of active SIMs, with unlimited bundles drawing younger demographics. Meanwhile, enterprise lines are expanding at a 3.84% CAGR as miners, utilities, and fintechs digitize field operations. Private LTE networks atop licensed spectrum secure operational data across remote pits and substations.
Enterprise growth seeds new revenue streams, managed security, mobile edge computing, and application programming interfaces for fintech payment flows. Chilean debit-card usage at 81% of transactions deepens demand for low-latency, highly secure mobile channels. Operators team with hyperscalers to embed cloud on-ramps inside metropolitan data centers, bundling connectivity with storage and AI platforms. Small firms adopt LTE-M asset trackers to audit cold-chain conditions or optimize delivery routes, broadening enterprise penetration within the Chile Telecom MNO market.
Geography Analysis
Regional performance aligns with population density and industrial clusters. Santiago, Valparaíso, and Concepción dominate early 5G coverage, supporting median 274.46 Mbps fixed-broadband and 38.30 Mbps mobile speeds. 5G reaches 20.83% of mobile lines nationwide; 2G/3G still covers 99% of the terrain for voice fallback. Fiber accounts for 70.9% of fixed accesses, led by Movistar’s 40.5% share, followed by Mundo Pacífico and Entel. The Chile Telecom MNO market benefits from 94.3% household internet access, the highest in Latin America.
Northern macro-regions host vast copper mines that demand ultra-reliable links for automated trucks and sensors. Satellite-to-cell services launching August 2025 with Entel and Starlink promise seamless coverage, addressing black-spots and supporting emergency response. Southern Patagonia sees lower population density yet hosts scientific bases requiring robust backhaul; 5G trials in Antarctica exemplify network resilience. Cross-border fiber routes traverse the Andes to Argentina, and subsea cables connect to Peru, boosting international capacity.
Chile’s ambition to serve as a digital gateway drives mega-projects such as the Humboldt cable, a USD 300-550 million trans-Pacific link operational in 2026 that anchors datacenter investors. The December 2024 National Data Centers Plan earmarks USD 2.5 billion to build energy-efficient campuses that attract hyperscalers, creating clusters that stimulate edge traffic and enterprise demand. Collectively, these regional initiatives bolster capacity, enhance redundancy, and sustain long-term expansion of the Chile Telecom MNO market.
Regulatory Landscape
Chile’s mobile market is governed by the Subsecretaria de Telecomunicaciones (SUBTEL), which continues to link spectrum awards to coverage and deployment obligations, while increasing scrutiny of milestone delivery. In 2026, SUBTEL reported national 5G adoption surpassing 10 million connections (10.37 million by March 2026) and tightened fiscal oversight of 5G roll-out commitments, including monitoring WOM and ClaroVTR to reduce the risk of delays and to enforce the phased deployment schedule under existing 5G awards.
SUBTEL has also advanced procedural and market-structure enablers for network densification. It announced a fast-track approach targeting an 83% reduction in permit response times and took steps to reorder the 3.5 GHz band toward more continuous blocks for 5G. At the same time, it promoted greater competition in satellite services by incorporating additional frequency bands and supported infrastructure resilience coordination with other ministries (for example, to urgently restore antennas and essential telecom services after severe weather events), reinforcing the role of backup connectivity such as direct-to-cell solutions for remote areas.
Competitive Landscape
Four nationwide operators vie for subscribers, creating intense rivalry. Entel leads with roughly 35% mobile lines but faces EBITDA pressure, prompting asset divestitures such as the USD 358 million fiber sale to OnNet Fibra. Movistar weighs a sale of its Chilean unit, signaling potential consolidation and foreign capital inflow. Claro and Entel jointly captured the latest 3.5 GHz licenses, enabling network densification, while WOM’s Chapter 11 filing curtails its 5G roll-out and shifts subscribers toward incumbents.
Technology investments distinguish providers. Entel integrates Starlink links into cellular towers, offering near-100% territorial coverage; Claro pilots direct-satellite handsets with Anatel; and Movistar upgrades to LTE-M for industrial IoT. Operators also adopt energy-saving software that lowers 4G base-station consumption by 20%, aligning with ESG goals. Infrastructure sharing gains pace: América Móvil and Liberty Latin America pool assets under ClaroVTR, yet post-merger impairments of USD 4.7 billion reveal integration obstacles. Price competition remains the primary acquisition lever, but network quality and converged bundles increasingly drive churn decisions within the Chile Telecom MNO market.
Credit metrics reflect an industry under strain. Entel and Telefónica carry BBB- ratings with stable-to-negative outlooks after revenue declines and spectrum obligations. Nevertheless, cash-flow bolstered by fixed-line spin-offs funds incremental 5G expansion. New entrants appear improbable given spectrum costs and established scale economies, suggesting the Chile Telecom MNO industry may coalesce around three well-capitalized players by 2027, enhancing pricing discipline.
Chile Telecom MNO Industry Leaders
Entel Chile
Movistar Chile (Telefónica)
WOM Chile
Claro Chile (América Móvil)
- *Disclaimer: Major Players sorted in no particular order

Market Opportunities and Future Outlook
The scale-up of 5G usage and the fiber-heavy direction in fixed access create whitespace for MNOs to monetize beyond basic consumer plans, using premium data tiers and enterprise services. SUBTEL’s reported 10.37 million 5G connections by March 2026 indicates that 5G is moving into mass adoption, and the fixed market’s shift toward fiber, reaching 85.3% of total fixed internet connections by March 2026, supports backhaul needs for denser mobile deployments and lower-latency offerings.
Coverage and reliability opportunities extend beyond dense urban areas, where satellite integration is being commercialized rather than limited to pilots. Entel’s March 2026 expansion of Starlink Direct to Cell to support applications such as WhatsApp and Google Maps provides a more direct way to improve user experience in coverage gaps and to support continuity for logistics, mining, and other field operations in remote zones. In parallel, enterprise demand from mining, logistics, ports, and precision agriculture supports packaged IoT connectivity (including LTE-M/LPWAN and secure SIM management) and managed service bundles, while SUBTEL’s permitting fast-track and ongoing 3.5 GHz reordering reduce friction for incremental site deployment and more efficient mid-band utilization.
Recent Industry Developments
- May 2026: WOM Chile reported Q1 2026 results, with total revenue up 5.2% YoY to 165.946 billion CLP, and it plans investment up to 200 million USD for 2026. The update centers on enterprise financial performance and 5G rollout obligations, which supports continuity around WOM's funding for its 5G deployment commitments.
- April 2026: Entel Chile announced planned investment of 575 billion CLP for 2026, split between 376 billion CLP for Chile and 197 billion CLP for Peru, targeting 5G deployment and fixed internet expansion. The plan points to significant capex for 5G and fixed broadband, reinforcing Entel’s position in mobile network expansion and capacity building across both markets.
- March 2026: Entel Chile expanded its Starlink Direct to Cell service to include apps such as WhatsApp, Google Maps, AccuWeather, and X. The change broadens satellite-backed connectivity for mobile networks by extending coverage reach and service value, with emphasis on low-latency and rural connectivity goals.


Research Methodology Framework and Report Scope
Market Definition and Coverage
This market is sized as the total value of telecom operator services delivered in Chile, covering mobile and fixed connectivity that consumers and enterprises pay for over the year, expressed in USD.
Scope exclusions: We exclude telecom equipment sales and private network build-outs that do not operate as public operator services.
Segmentation Overview
- Overall Telecom Revenue and ARPU
- Service Type
- Voice Services
- Data and Internet Services
- Messaging Services
- IoT and M2M Services
- OTT and PayTV Services
- Other Services (VAS, Roaming and International, Enterprise and Wholesale, etc.)
- End-user
- Enterprises
- Consumer
Data Sources, Market Sizing, and Validation
Desk Research
Desk research starts with building a clean fact base for Chile on demand and service availability, then mapping those signals to service revenue pools. We typically use official publications such as Chile Subsecretaria de Telecomunicaciones (SUBTEL) sector reports, national statistics releases, and spectrum and regulation documents, since they define subscriber concepts and service counting.
To cross-check the direction of demand and pricing, we also review sources such as ITU indicators, World Bank macro series, and OECD digital and connectivity statistics, along with public operator filings, investor presentations, and trusted press coverage of pricing and network rollouts. For financial normalization, paid subscriptions are used selectively for company financials and intelligence, news and financials, and patent databases when network technology changes need to be timed correctly. The desk sources named above are illustrative, and the overall desk research pull is not exhaustive because many other public documents and datasets were also used for collection, validation, and clarification.
Primary Interviews and Surveys
Primary work is used to validate how service revenues split across mobile, fixed broadband, and voice, and to sanity check ARPU direction, plan mix, and enterprise versus consumer weighting. We speak with operator-side functions, distribution and channel contacts, and industry experts in Chile so gaps from public data can be filled with what is actually being sold, and assumptions can be aligned to current plan structures and channel realities.
Distribution of primary research fieldwork respondents
| Company type | Respondent position |
|---|---|
| Top tier: 38% | CXOs: 14% |
| Mid tier: 47% | Functional/Unit leaders: 40% |
| Smaller Players: 15% | Managers: 46% |
Market-Sizing & Forecasting
Sizing is built by first reconstructing the demand pool from service-line indicators and operator service mix, and then converting those into annual revenue using observed pricing direction. For Chile, inputs include total telecom services counts reported by the regulator, mobile versus fixed access mix, broadband penetration direction, technology migration (4G to 5G), and typical ARPU and package changes seen in the market.
A top-down and bottom-up approach is applied. The top-down view is anchored on subscriber and access metrics, then corroborated through selective roll-ups from operator revenue disclosures and sampled ARPU time subscriber approximations. When bottom-up pieces are incomplete, gaps are handled using penetration-based proxies, conservative range checks, and consistency tests against regulated service definitions. For example, services that are not counted as public telecom in official reporting are not forced into the revenue pool. Forecasts are produced using scenario analysis supported by short-run smoothing on key drivers like subscriber growth, data usage intensity, and price progression, and then adjusted after primary feedback on plan inflation and competitive intensity.
Data Validation & Update Cycle
Outputs are validated through multiple checks so totals remain consistent with independent signals such as regulator-reported service counts, public revenue disclosures, and macro affordability trends in Chile. Outliers are flagged, assumptions are revisited, and follow-up outreach is triggered when a change in pricing, regulation, or network rollout could shift the mix materially.
Before sign-off, the model is reviewed in steps by another analyst to confirm formulas, currency conversions, and year alignment, then the narrative is checked against the final numbers. Reports are refreshed annually, with interim updates for material events, and a final pre-delivery pass is done so clients receive the latest updated view.
Mordor Intelligence's Chile Telecom Market Size Compared Against Other Published Estimates
Published market sizes for Chile telecom can look different because the scope line is not drawn the same way, and because revenue is sometimes mixed with adjacent digital services. Differences also come from how prices are converted into USD, how prepaid and postpaid ARPU is trended, and whether the figures are refreshed after regulatory definitions are updated.
Some external estimates fold pay-TV and broader internet access revenue into the total, which naturally lifts the number. In Mordor Intelligence, the market is counted as telecom operator service revenue tied to mobile and fixed connectivity, and OTT and pay-TV are only counted when they are reported as part of the operator service bundle rather than as a wider media spend.
Benchmark comparison
| Source | Market Size | Gaps in Research Methodology |
|---|---|---|
| Mordor Intelligence | USD 4.63 B (2025) | |
| Industry Study A | USD 6.70 B (2023) | Uses a broader telecoms and internet access revenue view and is anchored to an earlier year, so later subscriber mix shifts and USD conversion timing can widen the gap versus a 2025 base. |
| Trade Brief B | USD 4.99 B (2023) | Often reflects a narrower telecom-only revenue snapshot tied to 2023 and may not align to official service counting rules that exclude certain internet-based services, which changes what gets included. |
Taken together, the spread mostly traces back to what is included beyond core connectivity and the year used for the base value. By keeping the model tied to repeatable service metrics and clearly stated inclusion rules, the estimate stays traceable and easier to reconcile with what operators and regulators report.


Key Questions Answered in the Report
How large is the Chile Telecom MNO market today?
The Chile Telecom MNO market size stands at USD 4.79 billion in 2026, with a forecast of USD 5.65 billion by 2031.
What is the expected growth rate through 2031?
Aggregate revenue is projected to expand at a 3.38% CAGR during 2026-2031.
Which service category generates the most revenue?
Data and internet services lead with 43.81% of the 2025 Chile Telecom MNO market share, reflecting strong mobile data demand.
How many subscribers use 5G?
Movistar alone serves 1.5 million 5G customers, and 5G lines account for roughly 20% of total mobile connections.
Why did WOM file for bankruptcy?
The operator cited inability to refinance USD 348 million in debt amid fierce price competition and spectrum-related obligations.
Which regions have priority in 5G deployment?
Initial roll-outs concentrate on Santiago, Valparaíso, and Concepción, with planned expansion to mining regions in the north.
Page last updated on:


 Your data is secure and never sold or shared.


