
Market Overview
| Study Period | 2021 - 2031 |
|---|---|
| Forecast Data Period | 2026 - 2031 |
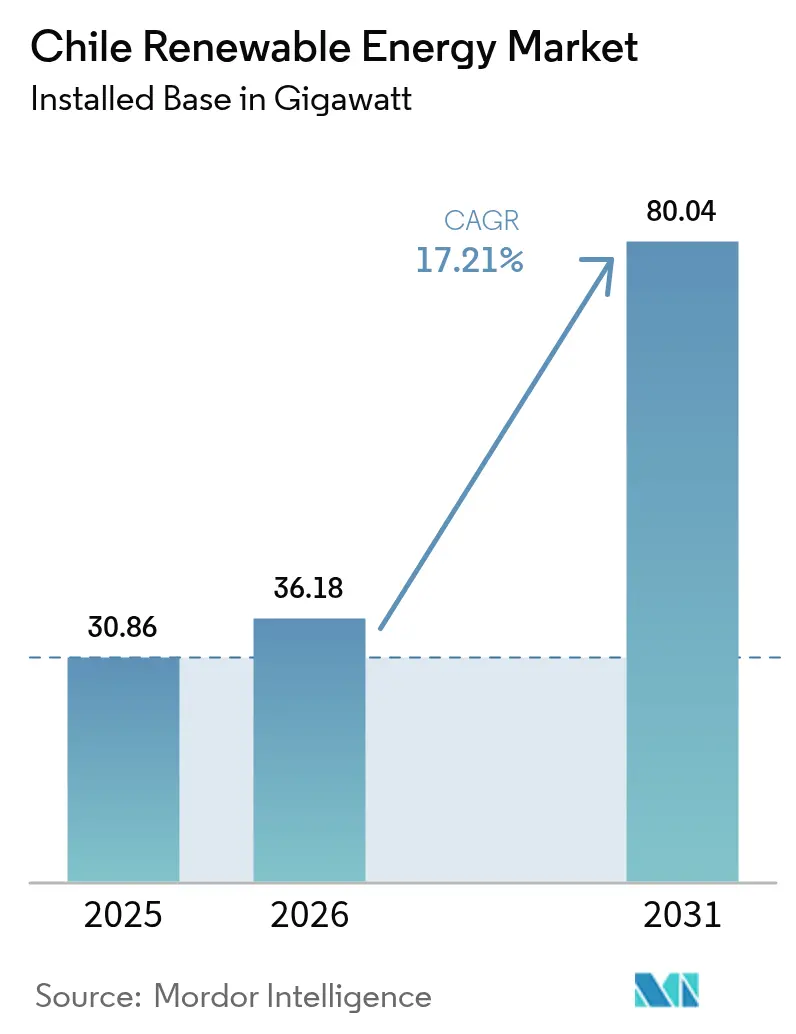
| Base Year Market Size (2025) | 30.86 gigawatt |
| Market Volume (2026) | 36.18 gigawatt |
| Market Volume (2031) | 80.04 gigawatt |
| Growth Rate (2026 - 2031) | 17.21 % |
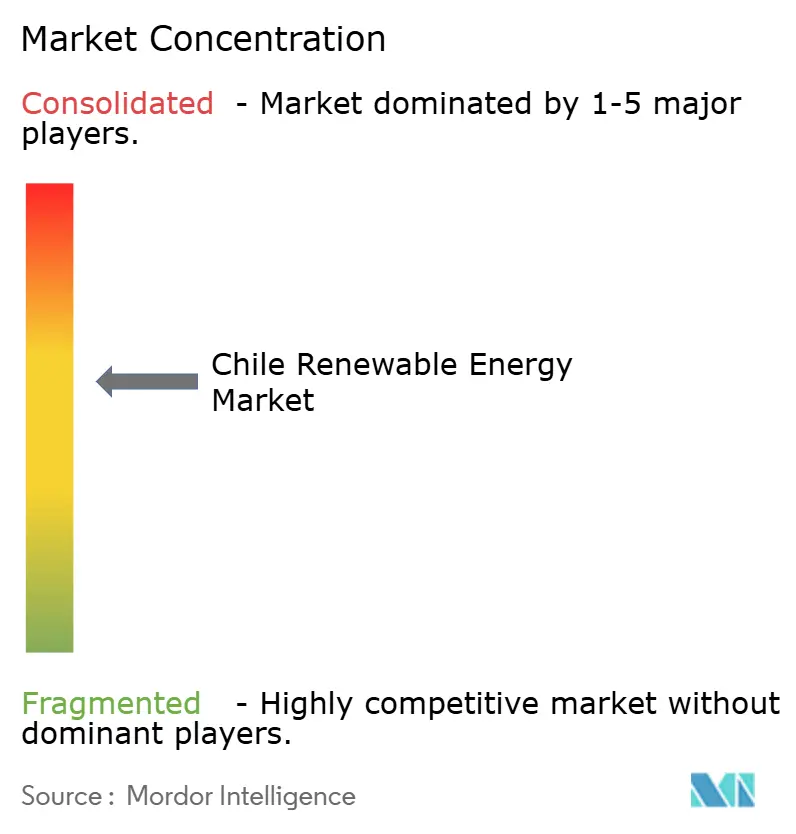
| Market Concentration | Medium |
Major Players *Disclaimer: Major Players sorted in no particular order Image © Mordor Intelligence. Reuse requires attribution under CC BY 4.0. | |
Chile Renewable Energy Market Analysis by Mordor Intelligence
Chile Renewable Energy market size in 2026 is estimated at 36.18 gigawatt, growing from 2025 value of 30.86 gigawatt with 2031 projections showing 80.04 gigawatt, growing at 17.21% CAGR over 2026-2031.
Intensifying decarbonization mandates, auction-driven price discovery, and multi-terawatt-hour power-purchase agreements (PPAs) signed by copper-mining operators are together reshaping the Chile renewable energy market and accelerating installation cycles. Solar assets already hold 45.8% of capacity thanks to the Atacama Desert’s record irradiation, while the geothermal pipeline is advancing at a 30.7% annual clip as exploration licenses unlock Andean volcanic reserves. Utilities still command the bulk of capacity at 62.2%, yet mining-led commercial and industrial (C&I) offtake is advancing at 21.5% CAGR, underpinning new project bankability. Transmission remains the binding constraint: curtailment rose to 14.5% in 1Q 2024 and wasted 2,046 GWh by mid-year, hastening developer pivots toward co-located storage and behind-the-fence green-hydrogen schemes that sidestep grid bottlenecks.[1]Comisión Nacional de Energía, “Estadísticas de Energía Renovable 2024,” cne.cl
Key Report Takeaways
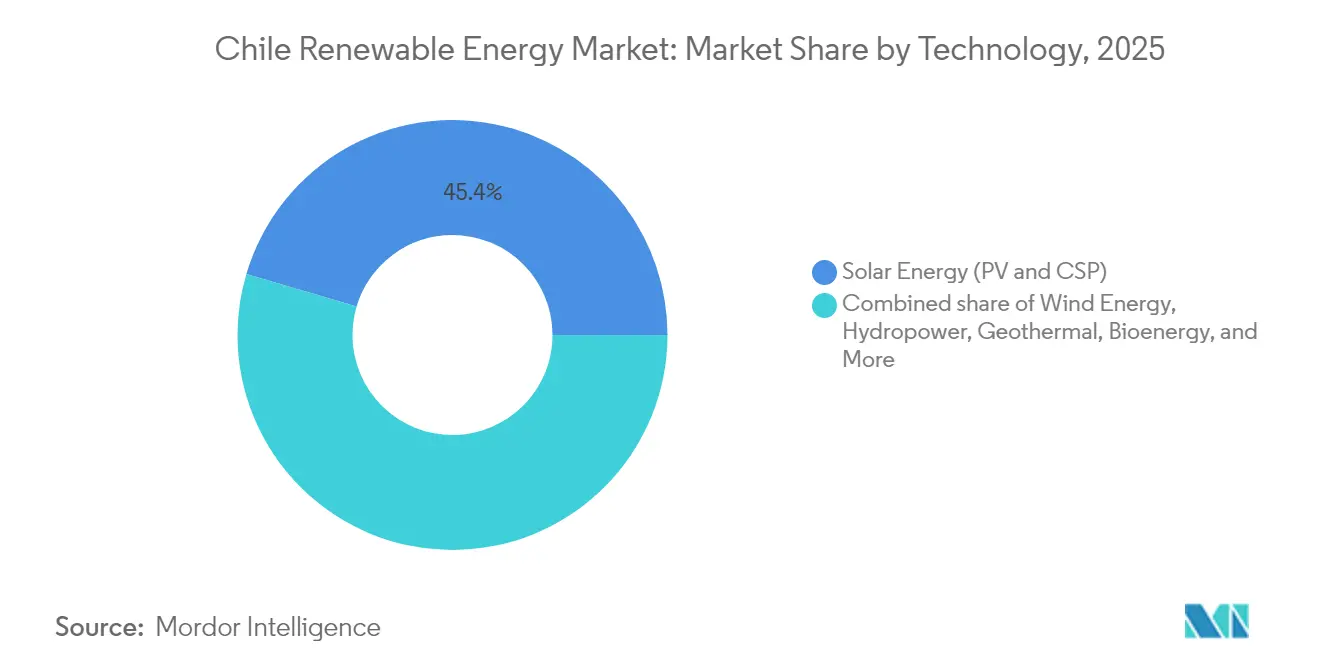
- By technology, solar energy led with 45.42% of Chile's renewable energy market share in 2025. Geothermal capacity is forecast to expand at a 29.17% CAGR through 2031, the fastest rate among all technologies.
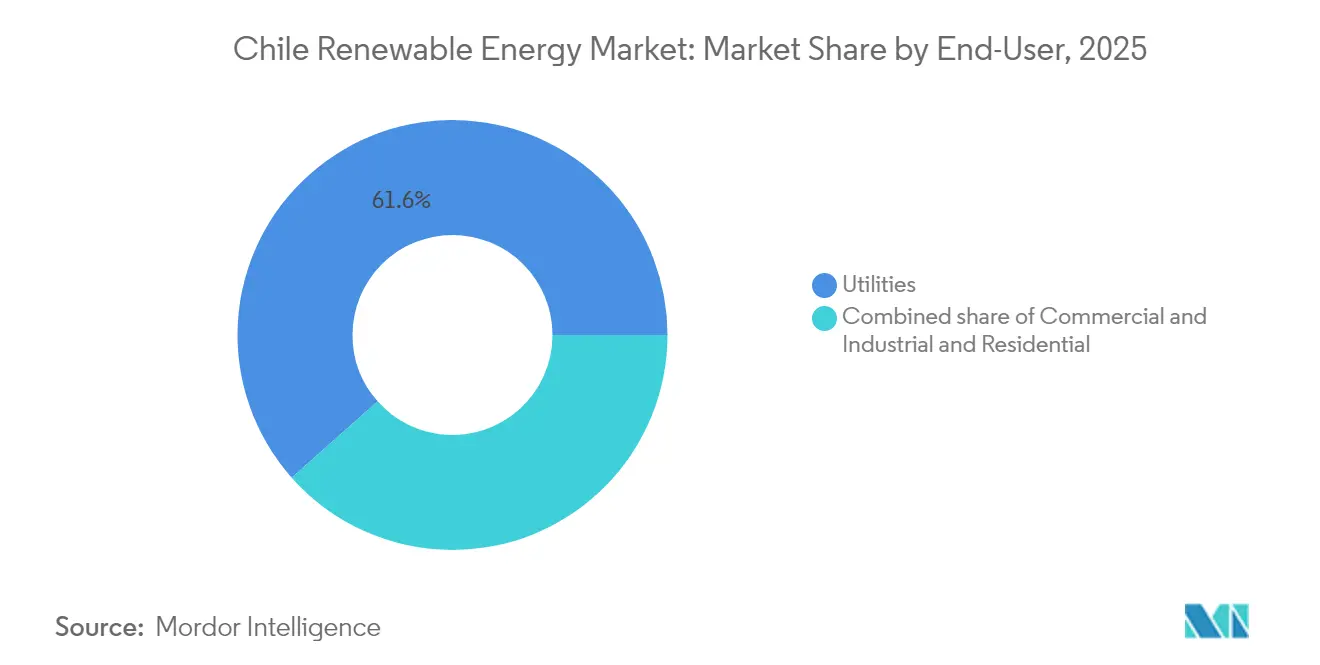
- By end-user, utilities accounted for a 61.55% share of the Chile renewable energy market size in 2025, while the C&I segment, anchored by mining groups, is projected to grow at a 21.22% CAGR to 2031.
Note: Market size and forecast figures in this report are generated using Mordor Intelligence’s proprietary estimation framework, updated with the latest available data and insights as of 2026.
Chile Renewable Energy Market Trends and Insights
Drivers Impact Analysis*
| Driver | (~) % Impact on CAGR Forecast | Geographic Relevance | Impact Timeline |
|---|---|---|---|
| Renewable energy auctions & competitive bidding | 3.2% | National, with concentration in Atacama and Antofagasta regions | Medium term (2–4 years) |
| Abundant solar & wind resources | 4.5% | Atacama (solar), Patagonia (wind), spillover to central grid | Long term (≥4 years) |
| National decarbonization & carbon-neutrality targets | 3.8% | National, early gains in Santiago, Valparaíso, Concepción | Long term (≥4 years) |
| Rapid cost decline plus auction framework for large-scale battery storage | 2.7% | Northern Chile (solar co-location), central grid stabilization | Medium term (2–4 years) |
| Grid-scale green-hydrogen pilot demand pull | 2.1% | Atacama and Antofagasta (export-oriented), Magallanes (wind-to-hydrogen) | Long term (≥4 years) |
| Copper-mining sector corporate PPAs for Scope-2 compliance | 2.9% | Northern Chile (Escondida, Spence, Collahuasi, Los Bronces mining districts) | Medium term (2–4 years) |
| Source: Mordor Intelligence | |||
Renewable Energy Auctions & Competitive Bidding
Chile’s competitive auction scheme now anchors almost every utility-scale addition. The 2025-2028 calendar allocates 22,500 GWh across four tenders, obliging bidders to pre-secure permits and transmission rights, which reduces speculative pipelines and aligns capital deployment with grid capacity. Clearing prices climbed to USD 56.70 per MWh in 2023, reflecting higher balance-of-system costs and tight transmission access, yet the price rebound improves debt service coverage ratios and draws in institutional lenders. Law 20.936 forces distribution utilities to procure supply via auctions, removing cost-plus tariffs and leveling the field for independent power producers that bundle storage for firm capacity. Six battery projects totaling 1,750 MW and 7,000 MWh cleared in 2023, signaling that dispatchability now trumps raw nameplate ratings. Quality-management certification under ISO 9001 and compliance with Chilean grid codes are prerequisites, raising the bar for smaller entrants.[2]Ministerio de Energía, “Calendario de Licitaciones 2025-2028,” energia.gob.cl
Abundant Solar & Wind Resources
Atacama records solar irradiation above 3,000 kWh /m² annually, enabling photovoltaic capacity factors near 30% and concentrated-solar-power storage windows of up to 17.5 hours. Patagonia posts average onshore wind speeds above 8 m/s, yielding capacity factors of 35–40% and theoretical offshore potential topping 200 GW. Levelized costs sit below USD 35 per MWh for utility-scale solar and USD 40–45 per MWh for onshore wind, beating combined-cycle gas on pure economics. However, 35 GW of solar proposals now chase limited north-to-central corridor capacity, triggering curtailment and midday negative prices. Developers respond by co-locating batteries that arbitrage diurnal spreads or by directing surplus power into green hydrogen and ammonia destined for export markets in Asia and Europe.
National Decarbonization & Carbon-Neutrality Targets
The 2022 Climate Change Framework Law codifies carbon neutrality by 2050 and an interim goal of 80% renewable electricity by 2030. A coal phase-out agreement retires all 5.5 GW of coal generation by 2040, half by 2025, creating guaranteed replacement demand. Mining conglomerates, responsible for 30% of Chilean load, lock in long-term PPAs to satisfy investor-driven Scope 2 targets, with BHP, Antofagasta Minerals, and Codelco all committing to 100% renewable electricity before 2030. These corporate contracts slash financing spreads by up to 100 basis points versus merchant projects, crowding capital into the Chile renewable energy market and boosting pipeline certainty. Compliance with ISO 14001 and Equator Principles is standard in mining solicitations, raising due diligence rigor across the developer ecosystem.[3]Gobierno de Chile, “Ley Marco de Cambio Climático,” gob.cl
Rapid Cost Decline Plus Auction Framework for Large-Scale Battery Storage
Chile’s 2023 storage auction cleared four-hour lithium-ion systems at USD 150–200 per kWh, leveraging domestic lithium reserves that account for 36% of global proven resources. AES Andes’ 112-MW/560-MWh Bess Andes system posted 92% round-trip efficiency and cut neighboring solar curtailment by 18%. New regulations permit revenue stacking across energy, capacity, and ancillary-service markets, lifting internal rates of return by up to 300 basis points. Grid codes now outline battery participation in primary frequency response, unlocking additional value as coal plants exit. Suppliers, including Huawei Digital Power and ABB, have localized inverter and BMS assembly to meet ISO 9001 standards and compress import lead times, bolstering supply-chain resilience.
Restraints Impact Analysis*
| Restraint | (~) % Impact on CAGR Forecast | Geographic Relevance | Impact Timeline |
|---|---|---|---|
| Transmission bottlenecks (North-South corridor) | -2.4% | Atacama and Antofagasta (generation zones) to central load centers | Medium term (2–4 years) |
| Policy uncertainty on distributed generation tariffs | -1.1% | Central Chile (Santiago, Valparaíso), residential and small C&I segments | Short term (≤2 years) |
| Scarcity of skilled O&M workforce in remote zones | -0.8% | Atacama Desert (solar farms), Patagonia (wind farms), remote hydro sites | Medium term (2–4 years) |
| Water constraints limiting hydro expansion | -1.2% | Central and Southern Chile (reservoir-dependent hydro), Andean watersheds | Long term (≥4 years) |
| Source: Mordor Intelligence | |||
Transmission Congestion Limits Northern Solar Evacuation
The 753-km Cardones–Polpaico 500-kV corridor can shift only 1,400 MW southward, yet 19.9 GW of solar capacity is already contracted or under construction in the same region. Curtailment touched 2,046 GWh by June 2024, wiping out revenue and delaying project commercial operation dates. The 3,000-MW Kimal–Lo Aguirre HVDC link aims to relieve pressure by December 2029 but faces permitting challenges that could slip into 2030. Interim fixes, including co-located storage, reduce waste by 15–20% but raise capex by USD 300–400 per kW. ISA Interchile's proposed USD 1.648 billion expansion would lift regional transfer capacity to 3,100 MVA, yet cost-allocation rules and seismic-design compliance extend timelines, keeping congestion as the single largest drag on Chile's renewable energy market growth.
Distributed-Generation Tariff Revisions Create Residential Uncertainty
Chile shifted its PMGD framework from net metering to net billing in 2022, lowering export compensation to volatile spot prices and stretching rooftop paybacks to 10–12 years. The tariff overhaul paused financing for small-scale installers and lengthened grid-connection approvals by nine months, freezing the residential pipeline that historically centered on Santiago and Valparaíso. C&I customers in the 1–5 MW bracket see similar economics unless paired with batteries to boost self-consumption. Distribution utilities have meanwhile proposed fixed grid-access charges to recoup sunk-network costs, a move that could add USD 15–20 per kW-month and further erode returns. The Ministry of Energy’s 2024 consultation paper would grandfather existing contracts through 2030, but legislative approval remains pending, leaving small investors in limbo.
*Our forecasts treat driver/restraint impacts as directional, not additive. The impact forecasts reflect baseline growth, mix effects, and variable interactions.
Segment Analysis
By Technology: Solar Dominance Meets Geothermal Acceleration
Solar held 45.42% of installed capacity in 2025, making it the spine of the Chile renewable energy market. The segment enjoys photovoltaic LCOEs below USD 35 /MWh and benefits from a mature project-finance ecosystem that has lowered debt spreads to 250–300 basis points. Concentrated solar power demonstrates dispatchability, Cerro Dominador provides 17.5-hour thermal storage, yet the capex of USD 4,500–5,000 per kW restricts replication. Geothermal is forecast to grow at a 29.17% CAGR, lifting its slice of the Chile renewable energy market size as CORFO’s risk-mitigation scheme covers up to 60% of exploration drilling costs. Enel Green Power’s 48-MW Cerro Pabellón achieved a 95% capacity factor in 2024, reinforcing investor confidence.
Solar’s dominance also shapes supporting industries: module vendors JinkoSolar and Trina Solar shipped 400,000 panels to Chile in 2024, while Huawei Digital Power localized inverter repairs in Antofagasta to serve mining clients. Wind occupies the number-two slot, powered by Patagonia’s 8 m/s gusts and grid-scale projects such as Acciona’s 183-MW San Gabriel farm. Hydropower, once the backbone, now pivots toward pumped storage as drought squeezes reservoir levels. Bioenergy and ocean energy remain niche, although tidal pilots in the Magallanes Strait keep technology optionality open.


By End-User: Utilities Lead While Mining Drives C&I Surge
Utilities covered 61.55% of installed capacity and dominate auction volumes, anchoring the Chile renewable energy market through 15- to 20-year regulated PPAs. Their role is evolving as coal retirement obliges them to firm variable renewables with storage or flexible gas. Commercial and industrial buyers, led by copper miners, expand at a 21.22% CAGR and increasingly sign 300-GWh-plus contracts that include capacity payments, reducing curtailment risk for developers. Mining PPAs carry ISO 14001 environmental clauses and Equator Principles adherence, cutting financing costs by up to 100 basis points.
Residential uptake is slower: net-billing reduced payback attractiveness, capping rooftop additions at 180 MW in 2024. However, high-income districts with tariffs above USD 150 /MWh still see installations paired with 10-kWh lithium-ion packs to maximize self-consumption. Data centers and cold-storage operators in the 1–5 MW bracket also embrace behind-the-meter arrays that trim bills by 25–35%, forging a diversified demand base that underpins lifecycle O&M markets for inverter, tracker, and battery suppliers.
Geography Analysis
Northern Chile, covering Atacama and Antofagasta, held 51.62% of renewable capacity in 2025 and is projected to grow 18.95% CAGR through 2031, outpacing national expansion as solar-plus-storage hybrids and hydrogen electrolyzers absorb curtailment. The region’s proximity to the world’s largest copper mines guarantees anchor demand even before grid upgrades arrive. Central Chile, Santiago, Valparaíso, and O’Higgins, hosts 32.18% of current installations and functions as the grid’s balancing hub, yet transmission saturation curtails further solar influx until the Kimal–Lo Aguirre HVDC line is energized.
Southern Chile, encompassing Los Lagos, Aysén, and Magallanes, accounts for 16.20% of capacity but is set to accelerate at 17.78% CAGR, aided by Patagonia’s wind resources and nascent offshore pilots. The region’s 6,435-km coastline positions it as a logical export springboard for green ammonia aimed at Asian buyers. Across all zones, SEIA environmental assessments and ILO 169 indigenous consultations stretch timelines to 18-24 months, particularly in Mapuche-dominated areas, yet they also reduce legal challenges post-financial close, improving bankability for projects entering the Chile renewable energy market.
Regulatory Landscape
Chile's renewable power market is governed primarily by the Ley General de Servicios Electricos (LGSE), with implementation through sector bodies such as the Ministerio de Energia and the Comision Nacional de Energia (CNE). The 2022 Climate Change Framework Law codifies national decarbonization targets, including carbon neutrality by 2050 and an interim goal of 80% renewable electricity by 2030, while procurement continues to be anchored by auction-based mechanisms under the distribution supply framework (including reforms associated with Law 20.936). This structure supports long-tenor contracted revenue for utility-scale renewables.
In 2026, regulatory activity has centered on system planning and technical standard-setting. The CNE set its 2026 Annual Normative Plan through Res. Ex. 779/2025 and issued definitive bases in January 2026 for technical studies covering 2026-2030 for Sistemas Medianos. Separately, Ley N 21.804 (published February 13, 2026) introduced improvements to the regulation of Medium Systems, while the Ministry's planning instruments, PELP 2023-2027 and the formal start of the PELP 2028-2032 process in late 2025, provide policy scaffolding for transmission, storage integration, and renewable build-out sequencing.
Competitive Landscape
The top five players, Enel Green Power, AES Andes, Engie Energía Chile, Colbún, and Acciona Energía, hold roughly 55% of operational capacity, indicating moderate concentration in the Chile renewable energy market. Integrated utilities are shifting toward hybrid generation portfolios that bundle storage and sell firm renewable blocks catering to mining profiles. Independent power producers such as Atlas Renewable Energy and Mainstream Renewable Power counter by pre-permitting land with transmission access and bidding hybrids at strike prices 8–12% below incumbents. Auctions thus double as consolidation filters; winners often flip partially derisked projects to pension-fund investors seeking long-dated cash flows.
Technology suppliers localize to secure after-sales margins: Vestas opened a Santiago service hub supporting 1.2 GW of turbines, while Huawei Digital Power’s Antofagasta center now offers 48-hour inverter turnaround. AES Andes filed patents for grid-forming inverters that supply synthetic inertia, crucial as synchronous coal units retire. Digital O&M advances, such as drone thermography, trim downtime by 15% and raise internal rates of return. Joint ventures around green-hydrogen anchor loads proliferate, accelerating consolidation among developers targeting the next wave of demand.
Chile Renewable Energy Industry Leaders
Enel Green Power Chile SpA
AES Andes S.A.
Engie Energía Chile S.A.
Colbún S.A.
Acciona Energía
- *Disclaimer: Major Players sorted in no particular order

Market Opportunities and Future Outlook
Storage-led firming and congestion management are key focus areas as curtailment and north-to-center transfer constraints affect project design and offtake structures. In April 2026, the Ministry of Energy showed 38 storage systems under construction totaling 4,852 MW and 19,875 MWh, alongside 45 generation plants (2,857 MW) under construction. The pipeline indicates that developers and offtakers are increasingly procuring dispatchability in parallel with low-cost generation, consistent with auction and grid-code requirements that enable storage to participate across multiple revenue channels, particularly in higher-curtailment zones.
Permitting and transmission works also define near-term investable pathways for incremental renewable integration. In April 2026, 103 power generation projects were in environmental assessment under SEIA, representing USD 20,118 million of investment, which expands the pool of projects seeking bankable offtake and grid access. On the network side, the 2025 Annual Transmission Expansion Plan approved by the CNE in early 2026 includes 23 new or expanded works (about USD 320 million). In May 2026, the Ruta Energetica 2026-2030 launched an execution framework covering grid security, infrastructure development, and investment facilitation, including enabling actions around electrification that can broaden load growth and improve renewable absorption in the SEN.
Recent Industry Developments
- July 2026: Grenergy signed a 15-year PPA to supply 1 TWh per year of nighttime electricity backed by its Elena 3.5 GWh battery energy storage system in Chile. The contract structure underscores a shift from selling mainly daytime solar output toward firm, time-shaped renewable supply supported by large-scale storage.
- May 2025: ENGIE commenced construction of the 151 MW PV and 199 MWh BESS Libelula project in Chile's Metropolitan Region, with an investment of about USD 130 million. The build adds a utility-scale solar-plus-storage reference in the central grid zone, where flexibility and peak support have become more valuable as renewable penetration rises.
- June 2024: Chile's Coordinador Electrico Nacional reported rising renewable curtailment as transmission congestion constrained north-to-center evacuation, with wasted energy reaching 2,046 GWh by mid-2024. The operational outcome increased offtaker interest in storage-backed contracts and encouraged developers to redesign projects around hybridization and alternative demand sinks.


Research Methodology Framework and Report Scope
Market Definition and Coverage
For this study, the market is defined as Chile's renewable electricity generation capacity, measured as installed capacity in gigawatts across renewable technologies connected to the national power system.
Scope exclusions: Excludes fossil based generation assets, transmission and distribution networks, and stand-alone behind-the-meter equipment that is not reported as installed generation capacity.
Segmentation Overview
- By Technology
- Solar Energy (PV and CSP)
- Wind Energy (Onshore and Offshore)
- Hydropower (Small, Large, PSH)
- Bioenergy
- Geothermal
- Ocean Energy (Tidal and Wave)
- By End-User
- Utilities
- Commercial and Industrial
- Residential
Data Sources, Market Sizing, and Validation
Desk Research
Desk work started by mapping Chile's power-sector facts that can be checked in public records, and then aligning them to consistent definitions and time periods. We relied on sources such as the Ministry of Energy (Ministerio de Energia) publications, the national electricity coordinator's system statistics (Coordinador Electrico Nacional), the energy regulator's official datasets, and grid connection and auction documents where these were publicly available.
To keep inputs grounded, the model was also supported with series like customs trade data for major renewable equipment categories, climate and hydrology series where relevant for generation patterns, and peer-reviewed energy policy and power-systems papers that describe structural shifts. Company filings, investor presentations, and credible press reporting were used to confirm commissioning dates, retirements, and project pipeline status, and a paid subscription for company financials and intelligence helped cross-check ownership and asset timelines. This list is not exhaustive, and many other public sources were also used for data collection, validation, and clarification.
Primary Interviews and Surveys
We speak with Chile-based developers, utilities, equipment specialists, regulators, and industrial users through expert interviews and surveys. Their views help verify plant status, capacity additions, utilization, delays, and missing records. We use the evidence to check secondary data, resolve gaps, and triangulate assumptions and final analysis before sign-off.
Distribution of primary research fieldwork respondents
| Company type | Respondent position |
|---|---|
| Top tier: 30% | CXOs: 20% |
| Mid tier: 45% | Functional/Unit leaders: 30% |
| Smaller Players: 25% | Managers: 50% |
Market-Sizing & Forecasting
Sizing was built by first reconstructing Chile's renewable installed base from capacity additions and retirements, which were then aligned to the study definition and the technology set covered. A top-down approach was used where official installed-capacity series, grid connection updates, and auction and permitting signals were converted into yearly capacity by technology, then summed to a total that can be checked back to system-level published totals.
To ensure the totals are realistic, we corroborated them with selective bottom-up approximations, such as a sampled roll-up of project pipelines and commissioning schedules, plus typical capacity blocks. We then checked whether implied build rates match observed procurement and construction cycles. Inputs treated as key drivers included awarded capacity from tenders and PPAs, grid connection timing and curtailment notes, hydrology availability for hydro where it affects practical utilization, technology-level commissioning lead times, and policy targets that change developer behavior.
For forecasting, scenario analysis was used, since buildout in Chile is sensitive to permitting timelines, transmission constraints, and financing conditions that can shift quickly. When project-level detail was incomplete, gaps were handled through weighted timing assumptions based on pipeline maturity and historical slippage, and then reviewed again with interview feedback so the final series stays explainable and repeatable.
Data Validation & Update Cycle
Validation was handled through multiple cross-checks so the final numbers do not rely on a single dataset. We compared outputs against independent signals such as national generation mix reporting, public project trackers, and observed commissioning cadence, and then flagged outliers for deeper review.
Before sign-off, the model went through step-by-step analyst checks, including unit consistency tests, year-on-year variance checks, and logic reviews for technology additions versus stated policy and grid constraints. Reports are refreshed annually, and interim updates are triggered when material events occur (for example, rule changes, major auction outcomes, or large commissioning delays). Right before delivery, a final analyst pass is done so clients receive the most current view available.
Mordor Intelligence's Chile Renewable Energy Market Size Measured Against Other Published Estimates
Published figures for Chile's renewable energy market often do not match, even when they appear to measure the same thing. The most common reasons are differences in what gets counted as the market output, what sits inside the renewable scope, and whether the estimate is built from capacity facts or from revenue and spending assumptions.
In practice, the gap usually comes from mixing installed capacity with market value, where price, project cost, or power sales are used as a proxy even though the underlying drivers move differently year to year. Currency timing, whether pipeline projects are counted before commissioning, and how curtailment or grid constraints are treated can also shift the totals, especially in a market where build schedules can change after permitting and connection updates.
Benchmark comparison
| Source | Market Size | Gaps in Research Methodology |
|---|---|---|
| Mordor Intelligence | USD 30.86 B (2025) | |
| Industry Research Publisher A | USD 7.83 B (2024) | Uses a value-based market estimate in USD that is likely tied to project spending or sector revenue, which is not directly comparable to an installed-capacity series and can compress totals when only active-year flows are counted. |
| Industry Research Publisher B | USD 15.67 B (2032) | Reports a longer-dated USD projection to 2032, which can differ due to assumed price escalation, currency conversion timing, and whether announced projects are included before they reach commercial operation. |
Project CAPEX and electricity sales sit outside Mordor Intelligence's scope, so the benchmark is anchored to installed renewable capacity in GW and then validated with commissioning and pipeline timing checks. This explains the spread versus USD-based market value estimates.


Key Questions Answered in the Report
How big is the Chile renewable energy market in 2026?
Installed capacity reaches 36.18 GW in 2026, on track for 80.04 GW by 2031.
Which technology leads new capacity additions?
Solar remains dominant, supported by Atacama irradiation and auctions that prioritize low-cost photovoltaic bids with storage.
Why are mining companies critical buyers of clean power?
Copper miners consume 30% of national electricity and use multi-terawatt-hour PPAs to meet investor-mandated Scope 2 decarbonization goals.
What curtailment challenges do developers face?
Northern grid congestion forced 2,046 GWh of renewable waste in 1H 2024, a problem that will ease only after the KimalLo Aguirre HVDC link goes live.
How is Chile supporting large-scale battery deployment?
Storage auctions allow revenue stacking across energy, capacity, and ancillary markets, and 1,750 MW/7,000 MWh cleared in 2024 at USD 165 /kWh.
What is the outlook for green hydrogen?
A 25 GW electrolyzer target by 2030, USD 1 billion in multilateral finance, and 17 projects under review position Chile as a future ammonia exporter.
Page last updated on:


 Your data is secure and never sold or shared.


