| Study Period | 2018 - 2030 |
| Base Year For Estimation | 2024 |
| Forecast Data Period | 2025 - 2030 |
| Market Volume (2025) | 338.3 MW |
| Market Volume (2030) | 554.5 MW |
| CAGR | 10.38 % |
| Market Concentration | Medium |
Major Players*Disclaimer: Major Players sorted in no particular order |

Chile Data Center Market Analysis
The Chile Data Center Market size is estimated at 338.3 MW in 2025, and is expected to reach 554.5 MW by 2030, growing at a CAGR of 10.38%. Further, the market is expected to generate colocation revenue of USD 2,591 Million in 2025 and is projected to reach USD 4,530.5 Million by 2030, growing at a CAGR of 11.82% during the forecast period (2025-2030).
The Chilean data center market is experiencing a significant transformation driven by the rapid digitalization of businesses and government services. The public sector has emerged as a substantial contributor to IT spending, accounting for 17% of all IT company expenditure in 2022, reflecting the government's commitment to digital transformation. This digital push has led to increased demand for advanced data center infrastructure, particularly in Santiago, which hosts over 85% of the country's data center capacity. The convergence of public and private sector initiatives has created a robust ecosystem for data center operations, with many organizations implementing hybrid IT strategies that leverage both hosted data centers and multi-cloud architectures.
The market is witnessing a notable shift in payment technologies and e-commerce infrastructure, which is driving demand for sophisticated data center services. Recent data shows that cards are the predominant payment method for internet purchases in Chile, accounting for 55% of transactions, while digital wallets and bank transfers represent 14% and 13%, respectively. This diverse payment ecosystem requires robust data processing capabilities and secure infrastructure, leading to increased investments in advanced data center facilities that can handle complex financial transactions and ensure data security.
The evolution of data center tiers is reshaping the market landscape, with a clear preference for higher-tier facilities. The market structure shows a distinctive distribution with Tier 4 facilities commanding 60.7% of the market share, followed by Tier 3 facilities at 37.9%, while Tier 1 and 2 facilities account for only 1.4%. This distribution reflects the industry's focus on reliability and uptime, with organizations increasingly migrating to higher-tier facilities that offer enhanced redundancy and operational excellence. The trend is particularly evident in the financial and e-commerce sectors, where uninterrupted service availability is crucial for business operations.
The market is characterized by significant infrastructure developments and strategic expansions by major cloud service providers. Companies like Google, Oracle, and Microsoft are establishing cloud data center regions in Chile, while Amazon Web Services (AWS) is planning to build a cloud data center area in Santiago, complementing its existing CloudFront Edge site. These developments are accompanied by the construction of new data center facilities, with operators focusing on Tier 3 and Tier 4 certifications to meet the growing demand for high-reliability services. The expansion is particularly notable in Santiago's digital hub, which serves both local businesses and regional cloud requirements, positioning Chile as a strategic location for data center operations in Latin America.
Chile Data Center Market Trends
Rollout of the 5G network, and increasing data usage for business, entertainment, and education drives the market growth
- The total data traffic per smartphone in the country was 4.00 GB in 2022 and is expected to witness a CAGR of 12.67% during the forecast period, reaching a value of 9.22 GB by 2029.
- The year 2022 was notable for the rollout of the 5G network, as Entel managed to complete 100% of its first stage within the first year, being present in all regions, covering 270 communes, and having more than one million subscribers who could utilize this new technology. The use of mobile data in that year increased by 33% over the national average, whether it was for business, entertainment, or education. Comparing December 2021 and December 2022, the Norte Grande's three regions—Tarapacá, Antofagasta, Arica, and Parinacota—stood out among those with the highest growth rates. These three regions saw significant gains of 78%, 72%, and 68%, respectively. The increased internet usage and the adoption of more smartphones are factors contributing to the rise in smartphone internet traffic.

Understand The Key Trends Shaping This Market
Download PDF
The high internet penetration and smartphone technology adoption by various businesses and growing digital usage across the businesses drives the market demand
- The total number of smartphone users in the country was 15.01 million in 2022 and is expected to witness a CAGR of 3.01% during the forecast period, reaching a value of 19.26 million by 2029.
- In Chile, smartphone usage increased by more than 4% between 2020 and 2021, indicating that more individuals turned to cellphones during the COVID-19 pandemic. Notably, smartphone penetration has been growing significantly in recent years. Consequently, more people are purchasing cell phones, and this trend is expected to continue, leading to an increase in the number of smartphone users nationwide.
- E-commerce is also experiencing steady growth throughout the country. In 2020, Chile's average annual revenue per paying user amounted to USD 913. Chilean shoppers make a high percentage of cross-border e-commerce purchases, with 69% of these transactions being international. As a result, vast amounts of data are generated, leading to an increased demand for data centers across the nation.
- The growing smartphone usage has led to a higher demand for servers that power these devices. To accommodate the unpredictable data flow generated by the expanding use of smart devices, increased storage space is required. Consequently, the rising need for smart devices in the market necessitates the expansion of data centers.

OTHER KEY INDUSTRY TRENDS COVERED IN THE REPORT
- Adoption of 5G network services, rising inclination towards adopting social media, and growing internet population drives the market growth
- Government initiatives and increasing partnerships among market players expanding the fiber rollouts
- Increase fiber rollout, uninterrupted high-speed data services, 24-hour remote customer assistance, and online payments drives the market growth
Segment Analysis: By Data Center Size
Large Segment in Chile Data Center Market
The large data center segment dominates the Chilean market with approximately 41% market share in 2024, representing an IT load capacity of 123.16 MW. The segment's prominence is driven by the increasing processing capacity requirements and extensive use of cloud services across industries. Santiago hosts the maximum concentration of large data centers, with more than 60% being Tier 3 certified facilities, while the remaining are Tier 4 facilities. Major operators like Ascenty maintain a significant market presence with substantial IT load capacities, while other key players such as EdgeConnex, Scala Data Centers, and Ascenty continue to invest in constructing new large data center facilities to meet growing demand.
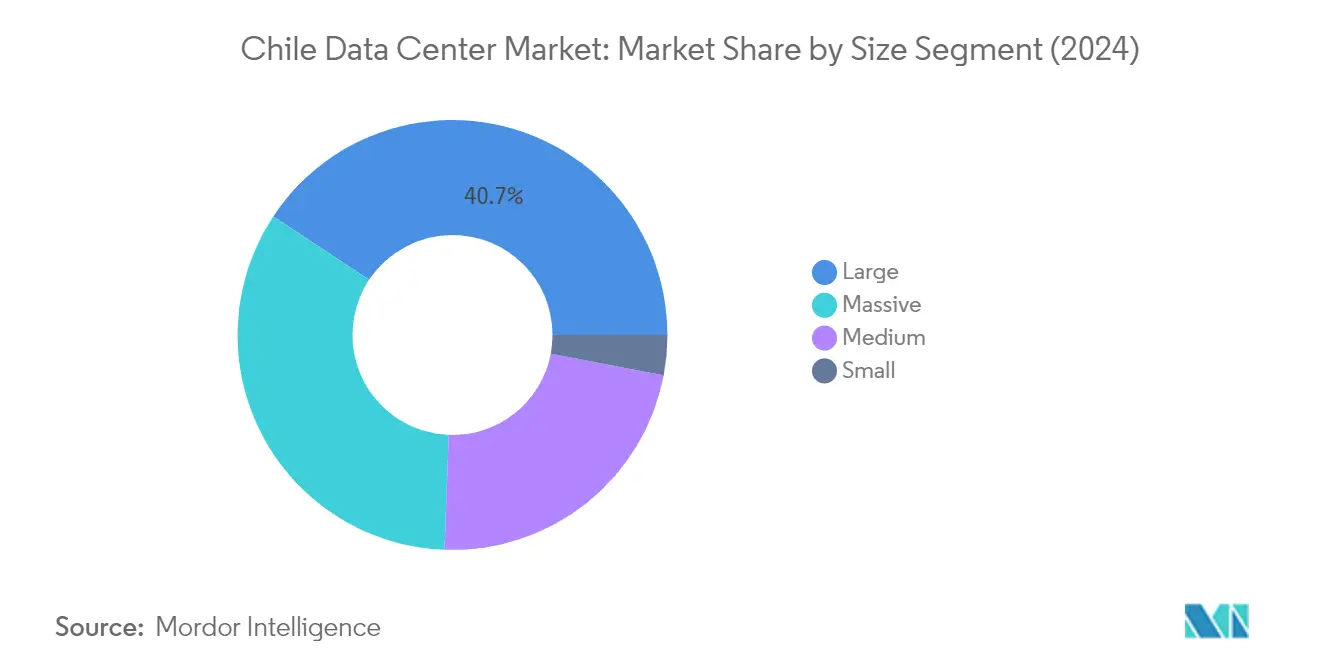
Massive Segment in Chile Data Center Market
The massive data center segment is projected to exhibit the highest growth rate of approximately 19% during 2024-2029, driven by increasing demand for high-capacity data processing and storage facilities. The segment's robust growth is supported by ongoing data center construction projects from prominent operators like ODATA and Scala Data Centers. The expansion is particularly notable in Santiago, where these facilities are being developed to accommodate the rising needs of cloud service providers, telecommunications companies, and large enterprises. The implementation of 5G technology and industrial digitalization are key factors propelling the demand for massive data centers, as they provide the necessary infrastructure to handle large-scale data processing requirements.
Remaining Segments in Data Center Size Market
The medium and small segments play crucial roles in serving specific market niches within Chile's data center landscape. Medium-sized facilities cater primarily to regional businesses and organizations requiring moderate data processing capabilities, with most facilities maintaining Tier 3 certification standards. The small segment, while representing a smaller market share, continues to serve local businesses and organizations with specific data processing needs. These segments provide important diversity in the market, offering solutions for businesses with varying scales of operation and data processing requirements. The market currently has no mega data centers, though future developments may emerge as the digital infrastructure continues to evolve.
Segment Analysis: By Tier Type
Tier 4 Segment in Chile Data Center Market
The Tier 4 segment dominates the Chile data center market, commanding approximately 51% market share in 2024, while also exhibiting the strongest growth trajectory with a projected growth rate of nearly 20% during 2024-2029. The segment's prominence is driven by the increasing demand from hyperscale data center facilities, which are experiencing high demand due to extensive cloud services adoption and Industry 4.0 implementation. Major operators like SONDA, ODATA, Equinix Inc., and Claro are actively operating Tier 4 certified facilities in Santiago, with ODATA leading the segment with a 28 MW capacity facility. The segment's robust growth is further supported by the rising processing capacity requirements and the deployment of advanced technologies across various industries, particularly in cloud computing, big data analytics, and IoT applications.
Remaining Segments in Tier Type Segmentation
The Tier 3 segment represents a significant portion of the market, offering a balance between reliability and cost-effectiveness for businesses. These facilities provide robust infrastructure with redundant components and multiple distribution paths, making them suitable for enterprises requiring high availability without the premium costs associated with Tier 4 facilities. Meanwhile, the Tier 1 & 2 segment caters to small companies and startups with basic requirements, offering the most affordable option with standard uptime guarantees. While these lower-tier facilities continue to serve specific market niches, their relative importance is gradually diminishing as businesses increasingly prioritize higher reliability and advanced infrastructure capabilities offered by Tier 3 and Tier 4 facilities.
Segment Analysis: By Absorption
Utilized Segment in Chile Data Center Market
The utilized segment dominates the Chilean data center market, accounting for approximately 67% of the total IT load capacity in 2024. This significant market share is driven by the increasing adoption of data center solutions by various end-users, including cloud service providers, e-commerce platforms, the BFSI sector, telecom operators, and other businesses. The segment is experiencing robust growth due to the rapid digital transformation across industries, with end customers increasingly utilizing racks and servers for their operations. The expansion is particularly notable in Santiago, where major cloud hyperscale data centers are relocating their operations. The segment's growth is further supported by Chile's position as one of the largest e-commerce markets in Latin America, necessitating increased server usage and driving higher absorption rates. Additionally, the rising demand for computation and storage to support high-end applications, coupled with the country's excellent connectivity infrastructure and favorable business environment, continues to attract both domestic and international players to utilize data center facilities.
Non-Utilized Segment in Chile Data Center Market
The non-utilized segment represents the available capacity in Chilean data centers that remains unoccupied but ready for deployment. This segment plays a crucial role in the market by providing the necessary flexibility and scalability options for future expansion. Data center management strategies are crucial as operators maintain this unused capacity to accommodate sudden surges in demand and support the growing digital infrastructure needs of businesses. The segment's dynamics are influenced by factors such as new facility construction, expansion projects, and the gradual absorption of space by end-users. Market players strategically manage their non-utilized capacity to ensure optimal resource allocation while maintaining the ability to respond to emerging opportunities. This approach allows data center operators to balance current utilization with future growth potential, ensuring sustainable market development and meeting the evolving needs of Chile's digital economy.
Chile Data Center Industry Overview
Top Companies in Chile Data Center Market
The data center market in Chile is characterized by continuous innovation and strategic expansion initiatives from leading players. Companies are focusing on enhancing their colocation data center services through advanced technologies, improved connectivity solutions, and expanded facility footprints. Operational excellence is being achieved through investments in energy-efficient infrastructure, renewable power sources, and state-of-the-art security systems. Market leaders are actively pursuing strategic partnerships with cloud service providers, telecom operators, and enterprise customers while simultaneously expanding their presence through new facility construction and existing site upgrades. The competitive landscape is further shaped by investments in emerging technologies like edge computing, artificial intelligence, and sustainable cooling solutions, alongside efforts to obtain key industry certifications and compliance standards.
Global Players Dominate Chilean Data Center Market
The Chilean data center market exhibits a mix of global infrastructure providers and regional telecommunications companies, with international players holding significant market share. Major global operators like Digital Realty (through Ascenty), Equinix, and EdgeConneX have established strong positions through strategic acquisitions and greenfield developments. The market shows moderate consolidation, with the top five players controlling a substantial portion of the total capacity, while regional players like ODATA and SONDA maintain competitive positions through their local expertise and established customer relationships.
The market has witnessed notable merger and acquisition activity, particularly with global players acquiring local operations to expand their Latin American footprint. These strategic moves are reshaping the competitive landscape, as international providers seek to capitalize on Chile's growing digital economy and its position as a regional tech hub. The presence of telecommunications companies transitioning into data center operations adds another dynamic layer to the market structure, creating opportunities for strategic partnerships and joint ventures.
Innovation and Sustainability Drive Future Success
Success in the Chilean data center market increasingly depends on providers' ability to deliver sustainable, high-performance infrastructure while maintaining competitive pricing. Incumbent providers are strengthening their market positions by investing in renewable energy solutions, expanding their interconnection capabilities, and developing edge computing facilities to serve emerging digital needs. The ability to offer comprehensive data center solutions that combine colocation services with cloud connectivity, managed services, and advanced security features has become crucial for maintaining competitive advantage.
For new entrants and challenger companies, differentiation through specialized services and strategic location selection presents opportunities for market penetration. Success factors include developing strong relationships with local enterprises, offering flexible deployment options, and maintaining high service quality standards. The regulatory environment, particularly regarding data protection and environmental sustainability, is becoming increasingly important in shaping competitive strategies. Companies must also address the growing demand for hybrid infrastructure solutions while managing the risk of cloud providers developing their own data center capabilities. Additionally, advancements in data center virtualization and data center automation are essential for optimizing operations and enhancing service delivery.
Chile Data Center Market Leaders
-
Ascenty (Digital Realty Trust Inc.)
-
EdgeConneX Inc.
-
Empresa Nacional de Telecomunicaciones SA (Entel)
-
Equinix Inc.
-
General Datatech L.P. (GDT)
- *Disclaimer: Major Players sorted in no particular order

Need More Details on Market Players and Competiters?
Download PDF
Chile Data Center Market News
- November 2022: Ascenty is expected to invest USD 290 million in constructing five new data centers in South America. The locations of the data centers will be Brazil, Chile, and Colombia.
- August 2022: In Santiago, Chile, Ascenty inaugurated its second data facility. The capital's Quilicura sector is home to the Santiago 2 facility, which has a 21,000 sq. m (226,000 sq. ft) floor area, 31 MW of IT load, and space for up to 3,550 racks.
- May 2022: Following the completion of the purchase of four data centers in Chile from Empresa Nacional De Telecomunicaciones SA ("Entel"), a Chilean telecommunications provider, Equinix Inc., the provider of digital infrastructure, announced it expanded Platform Equinix deeper into Latin America.
Free With This Report
We provide a complimentary and exhaustive set of data points on the country and regional level metrics that present the fundamental structure of the industry. Presented in the form of 50+ free charts, the sections cover difficult to find data on various countries on smartphone users, data traffic per smartphone, mobile and broadband data speed, fiber connectivity network, and submarine cables.


Chile Data Center Market Report - Table of Contents
1. EXECUTIVE SUMMARY & KEY FINDINGS
2. REPORT OFFERS
3. INTRODUCTION
- 3.1 Study Assumptions & Market Definition
- 3.2 Scope of the Study
- 3.3 Research Methodology
4. MARKET OUTLOOK
- 4.1 It Load Capacity
- 4.2 Raised Floor Space
- 4.3 Colocation Revenue
- 4.4 Installed Racks
- 4.5 Rack Space Utilization
- 4.6 Submarine Cable
5. Key Industry Trends
- 5.1 Smartphone Users
- 5.2 Data Traffic Per Smartphone
- 5.3 Mobile Data Speed
- 5.4 Broadband Data Speed
- 5.5 Fiber Connectivity Network
-
5.6 Regulatory Framework
- 5.6.1 Chile
- 5.7 Value Chain & Distribution Channel Analysis
6. MARKET SEGMENTATION (INCLUDES MARKET SIZE IN VOLUME, FORECASTS UP TO 2030 AND ANALYSIS OF GROWTH PROSPECTS)
-
6.1 Hotspot
- 6.1.1 Santiago
- 6.1.2 Rest of Chile
-
6.2 Data Center Size
- 6.2.1 Large
- 6.2.2 Massive
- 6.2.3 Medium
- 6.2.4 Small
-
6.3 Tier Type
- 6.3.1 Tier 1 and 2
- 6.3.2 Tier 3
- 6.3.3 Tier 4
-
6.4 Absorption
- 6.4.1 Non-Utilized
- 6.4.2 Utilized
- 6.4.2.1 By Colocation Type
- 6.4.2.1.1 Hyperscale
- 6.4.2.1.2 Retail
- 6.4.2.1.3 Wholesale
- 6.4.2.2 By End User
- 6.4.2.2.1 BFSI
- 6.4.2.2.2 Cloud
- 6.4.2.2.3 E-Commerce
- 6.4.2.2.4 Government
- 6.4.2.2.5 Manufacturing
- 6.4.2.2.6 Media & Entertainment
- 6.4.2.2.7 Telecom
- 6.4.2.2.8 Other End User
7. COMPETITIVE LANDSCAPE
- 7.1 Market Share Analysis
- 7.2 Company Landscape
-
7.3 Company Profiles (includes Global Level Overview, Market Level Overview, Core Business Segments, Financials, Headcount, Key Information, Market Rank, Market Share, Products and Services, and Analysis of Recent Developments).
- 7.3.1 Ascenty (Digital Realty Trust Inc.)
- 7.3.2 Century Link (Lumen Technologies Inc.)
- 7.3.3 EdgeConneX Inc.
- 7.3.4 EdgeUno Inc.
- 7.3.5 Empresa Nacional de Telecomunicaciones SA (Entel)
- 7.3.6 Equinix Inc.
- 7.3.7 General Datatech L.P. (GDT)
- 7.3.8 IPXON Networks
- 7.3.9 Nabiax
- 7.3.10 NetActuate Inc.
- 7.3.11 ODATA (Patria Investments Ltd)
- 7.3.12 SONDA SA
- 7.4 LIST OF COMPANIES STUDIED
8. KEY STRATEGIC QUESTIONS FOR DATA CENTER CEOS
9. APPENDIX
-
9.1 Global Overview
- 9.1.1 Overview
- 9.1.2 Porter’s Five Forces Framework
- 9.1.3 Global Value Chain Analysis
- 9.1.4 Global Market Size and DROs
- 9.2 Sources & References
- 9.3 List of Tables & Figures
- 9.4 Primary Insights
- 9.5 Data Pack
- 9.6 Glossary of Terms
You Can Purchase Parts Of This Report. Check Out Prices For Specific Sections
Get Price Break-up Now
List of Tables & Figures
- Figure 1:
- VOLUME OF IT LOAD CAPACITY, MW, CHILE, 2018 - 2030
- Figure 2:
- VOLUME OF RAISED FLOOR AREA, SQ.FT. ('000), CHILE, 2018 - 2030
- Figure 3:
- VALUE OF COLOCATION REVENUE, USD MILLION, CHILE, 2018 - 2030
- Figure 4:
- VOLUME OF INSTALLED RACKS, NUMBER, CHILE, 2018 - 2030
- Figure 5:
- RACK SPACE UTILIZATION, %, CHILE, 2018 - 2030
- Figure 6:
- COUNT OF SMARTPHONE USERS, IN MILLION, CHILE, 2018 - 2030
- Figure 7:
- DATA TRAFFIC PER SMARTPHONE, GB, CHILE, 2018 - 2030
- Figure 8:
- AVERAGE MOBILE DATA SPEED, MBPS, CHILE, 2018 - 2030
- Figure 9:
- AVERAGE BROADBAND SPEED, MBPS, CHILE, 2018 - 2030
- Figure 10:
- LENGTH OF FIBER CONNECTIVITY NETWORK, KILOMETER, CHILE, 2018 - 2030
- Figure 11:
- VOLUME OF IT LOAD CAPACITY, MW, CHILE, 2018 - 2030
- Figure 12:
- VOLUME OF HOTSPOT, MW, CHILE, 2018 - 2030
- Figure 13:
- VOLUME SHARE OF HOTSPOT, %, CHILE, 2018 - 2030
- Figure 14:
- VOLUME SIZE OF SANTIAGO, MW, CHILE, 2018 - 2030
- Figure 15:
- VOLUME SHARE OF SANTIAGO, MW, HOTSPOT, %, CHILE, 2018 - 2030
- Figure 16:
- VOLUME SIZE OF REST OF CHILE, MW, CHILE, 2018 - 2030
- Figure 17:
- VOLUME SHARE OF REST OF CHILE, MW, HOTSPOT, %, CHILE, 2018 - 2030
- Figure 18:
- VOLUME OF DATA CENTER SIZE, MW, CHILE, 2018 - 2030
- Figure 19:
- VOLUME SHARE OF DATA CENTER SIZE, %, CHILE, 2018 - 2030
- Figure 20:
- VOLUME SIZE OF LARGE, MW, CHILE, 2018 - 2030
- Figure 21:
- VOLUME SIZE OF MASSIVE, MW, CHILE, 2018 - 2030
- Figure 22:
- VOLUME SIZE OF MEDIUM, MW, CHILE, 2018 - 2030
- Figure 23:
- VOLUME SIZE OF SMALL, MW, CHILE, 2018 - 2030
- Figure 24:
- VOLUME OF TIER TYPE, MW, CHILE, 2018 - 2030
- Figure 25:
- VOLUME SHARE OF TIER TYPE, %, CHILE, 2018 - 2030
- Figure 26:
- VOLUME SIZE OF TIER 1 AND 2, MW, CHILE, 2018 - 2030
- Figure 27:
- VOLUME SIZE OF TIER 3, MW, CHILE, 2018 - 2030
- Figure 28:
- VOLUME SIZE OF TIER 4, MW, CHILE, 2018 - 2030
- Figure 29:
- VOLUME OF ABSORPTION, MW, CHILE, 2018 - 2030
- Figure 30:
- VOLUME SHARE OF ABSORPTION, %, CHILE, 2018 - 2030
- Figure 31:
- VOLUME SIZE OF NON-UTILIZED, MW, CHILE, 2018 - 2030
- Figure 32:
- VOLUME OF COLOCATION TYPE, MW, CHILE, 2018 - 2030
- Figure 33:
- VOLUME SHARE OF COLOCATION TYPE, %, CHILE, 2018 - 2030
- Figure 34:
- VOLUME SIZE OF HYPERSCALE, MW, CHILE, 2018 - 2030
- Figure 35:
- VOLUME SIZE OF RETAIL, MW, CHILE, 2018 - 2030
- Figure 36:
- VOLUME SIZE OF WHOLESALE, MW, CHILE, 2018 - 2030
- Figure 37:
- VOLUME OF END USER, MW, CHILE, 2018 - 2030
- Figure 38:
- VOLUME SHARE OF END USER, %, CHILE, 2018 - 2030
- Figure 39:
- VOLUME SIZE OF BFSI, MW, CHILE, 2018 - 2030
- Figure 40:
- VOLUME SIZE OF CLOUD, MW, CHILE, 2018 - 2030
- Figure 41:
- VOLUME SIZE OF E-COMMERCE, MW, CHILE, 2018 - 2030
- Figure 42:
- VOLUME SIZE OF GOVERNMENT, MW, CHILE, 2018 - 2030
- Figure 43:
- VOLUME SIZE OF MANUFACTURING, MW, CHILE, 2018 - 2030
- Figure 44:
- VOLUME SIZE OF MEDIA & ENTERTAINMENT, MW, CHILE, 2018 - 2030
- Figure 45:
- VOLUME SIZE OF TELECOM, MW, CHILE, 2018 - 2030
- Figure 46:
- VOLUME SIZE OF OTHER END USER, MW, CHILE, 2018 - 2030
- Figure 47:
- VOLUME SHARE OF MAJOR PLAYERS, %, CHILE
Chile Data Center Industry Segmentation
Santiago are covered as segments by Hotspot. Large, Massive, Medium, Small are covered as segments by Data Center Size. Tier 1 and 2, Tier 3, Tier 4 are covered as segments by Tier Type. Non-Utilized, Utilized are covered as segments by Absorption.| Hotspot | Santiago | |||
| Rest of Chile | ||||
| Data Center Size | Large | |||
| Massive | ||||
| Medium | ||||
| Small | ||||
| Tier Type | Tier 1 and 2 | |||
| Tier 3 | ||||
| Tier 4 | ||||
| Absorption | Non-Utilized | |||
| Utilized | By Colocation Type | Hyperscale | ||
| Retail | ||||
| Wholesale | ||||
| By End User | BFSI | |||
| Cloud | ||||
| E-Commerce | ||||
| Government | ||||
| Manufacturing | ||||
| Media & Entertainment | ||||
| Telecom | ||||
| Other End User | ||||
Need A Different Region or Segment?
Customize Now
Market Definition
- IT LOAD CAPACITY - The IT load capacity or installed capacity, refers to the amount of energy consumed by servers and network equipments placed in a rack installed. It is measured in megawatt (MW).
- ABSORPTION RATE - It denotes the extend to which the data center capacity has been leased out. For instance, a 100 MW DC has leased out 75 MW, then absorption rate would be 75%. It is also referred as utilization rate and leased-out capacity.
- RAISED FLOOR SPACE - It is an elevated space build over the floor. This gap between the original floor and the elevated floor is used to accommodate wiring, cooling, and other data center equipment. This arrangement assist in having proper wiring and cooling infrastructure. It is measured in square feet (ft^2).
- DATA CENTER SIZE - Data Center Size is segmented based on the raised floor space allocated to the data center facilities. Mega DC - # of Racks must be more than 9000 or RFS (raised floor space) must be more than 225001 Sq. ft; Massive DC - # of Racks must be in between 9000 and 3001 or RFS must be in between 225000 Sq. ft and 75001 Sq. ft; Large DC - # of Racks must be in between 3000 and 801 or RFS must be in between 75000 Sq. ft and 20001 Sq. ft; Medium DC # of Racks must be in between 800 and 201 or RFS must be in between 20000 Sq. ft and 5001 Sq. ft; Small DC - # of Racks must be less than 200 or RFS must be less than 5000 Sq. ft.
- TIER TYPE - According to Uptime Institute the data centers are classified into four tiers based on the proficiencies of redundant equipment of the data center infrastructure. In this segment the data center are segmented as Tier 1,Tier 2, Tier 3 and Tier 4.
- COLOCATION TYPE - The segment is segregated into 3 categories namely Retail, Wholesale and Hyperscale Colocation service. The categorization is done based on the amount of IT load leased out to potential customers. Retail colocation service has leased capacity less than 250 kW; Wholesale colocation services has leased capacity between 251 kW and 4 MW and Hyperscale colocation services has leased capacity more than 4 MW.
- END CONSUMERS - The Data Center Market operates on a B2B basis. BFSI, Government, Cloud Operators, Media and Entertainment, E-Commerce, Telecom and Manufacturing are the major end-consumers in the market studied. The scope only includes colocation service operators catering to the increasing digitalization of the end-user industries.
| Keyword | Definition |
|---|---|
| Rack Unit | Generally referred as U or RU, it is the unit of measurement for the server unit housed in the racks in the data center. 1U is equal to 1.75 inches. |
| Rack Density | It defines the amount of power consumed by the equipment and server housed in a rack. It is measured in kilowatt (kW). This factor plays a critical role in data center design and, cooling and power planning. |
| IT Load Capacity | The IT load capacity or installed capacity, refers to the amount of energy consumed by servers and network equipment placed in a rack installed. It is measured in megawatt (MW). |
| Absorption Rate | It denotes how much of the data center capacity has been leased out. For instance, if a 100 MW DC has leased out 75 MW, then the absorption rate would be 75%. It is also referred to as utilization rate and leased-out capacity. |
| Raised Floor Space | It is an elevated space built over the floor. This gap between the original floor and the elevated floor is used to accommodate wiring, cooling, and other data center equipment. This arrangement assists in having proper wiring and cooling infrastructure. It is measured in square feet/meter. |
| Computer Room Air Conditioner (CRAC) | It is a device used to monitor and maintain the temperature, air circulation, and humidity inside the server room in the data center. |
| Aisle | It is the open space between the rows of racks. This open space is critical for maintaining the optimal temperature (20-25 °C) in the server room. There are primarily two aisles inside the server room, a hot aisle and a cold aisle. |
| Cold Aisle | It is the aisle wherein the front of the rack faces the aisle. Here, chilled air is directed into the aisle so that it can enter the front of the racks and maintain the temperature. |
| Hot Aisle | It is the aisle where the back of the racks faces the aisle. Here, the heat dissipated from the equipment’s in the rack is directed to the outlet vent of the CRAC. |
| Critical Load | It includes the servers and other computer equipment whose uptime is critical for data center operation. |
| Power Usage Effectiveness (PUE) | It is a metric which defines the efficiency of a data center. It is calculated by: (𝑇𝑜𝑡𝑎𝑙 𝐷𝑎𝑡𝑎 𝐶𝑒𝑛𝑡𝑒𝑟 𝐸𝑛𝑒𝑟𝑔𝑦 𝐶𝑜𝑛𝑠𝑢𝑚𝑝𝑡𝑖𝑜𝑛)/(𝑇𝑜𝑡𝑎𝑙 𝐼𝑇 𝐸𝑞𝑢𝑖𝑝𝑚𝑒𝑛𝑡 𝐸𝑛𝑒𝑟𝑔𝑦 𝐶𝑜𝑛𝑠𝑢𝑚𝑝𝑡𝑖𝑜𝑛). Further, a data center with a PUE of 1.2-1.5 is considered highly efficient, whereas, a data center with a PUE >2 is considered highly inefficient. |
| Redundancy | It is defined as a system design wherein additional component (UPS, generators, CRAC) is added so that in case of power outage, equipment failure, the IT equipment should not be affected. |
| Uninterruptible Power Supply (UPS) | It is a device that is connected in series with the utility power supply, storing energy in batteries such that the supply from UPS is continuous to IT equipment even during utility power is snapped. The UPS primarily supports the IT equipment only. |
| Generators | Just like UPS, generators are placed in the data center to ensure an uninterrupted power supply, avoiding downtime. Data center facilities have diesel generators and commonly, 48-hour diesel is stored in the facility to prevent disruption. |
| N | It denotes the tools and equipment required for a data center to function at full load. Only "N" indicates that there is no backup to the equipment in the event of any failure. |
| N+1 | Referred to as 'Need plus one', it denotes the additional equipment setup available to avoid downtime in case of failure. A data center is considered N+1 when there is one additional unit for every 4 components. For instance, if a data center has 4 UPS systems, then for to achieve N+1, an additional UPS system would be required. |
| 2N | It refers to fully redundant design wherein two independent power distribution system is deployed. Therefore, in the event of a complete failure of one distribution system, the other system will still supply power to the data center. |
| In-Row Cooling | It is the cooling design system installed between racks in a row where it draws warm air from the hot aisle and supplies cool air to the cold aisle, thereby maintaining the temperature. |
| Tier 1 | Tier classification determines the preparedness of a data center facility to sustain data center operation. A data center is classified as Tier 1 data center when it has a non-redundant (N) power component (UPS, generators), cooling components, and power distribution system (from utility power grids). The Tier 1 data center has an uptime of 99.67% and an annual downtime of <28.8 hours. |
| Tier 2 | A data center is classified as Tier 2 data center when it has a redundant power and cooling components (N+1) and a single non-redundant distribution system. Redundant components include extra generators, UPS, chillers, heat rejection equipment, and fuel tanks. The Tier 2 data center has an uptime of 99.74% and an annual downtime of <22 hours. |
| Tier 3 | A data center having redundant power and cooling components and multiple power distribution systems is referred to as a Tier 3 data center. The facility is resistant to planned (facility maintenance) and unplanned (power outage, cooling failure) disruption. The Tier 3 data center has an uptime of 99.98% and an annual downtime of <1.6 hours. |
| Tier 4 | It is the most tolerant type of data center. A Tier 4 data center has multiple, independent redundant power and cooling components and multiple power distribution paths. All IT equipment are dual powered, making them fault tolerant in case of any disruption, thereby ensuring interrupted operation. The Tier 4 data center has an uptime of 99.74% and an annual downtime of <26.3 minutes. |
| Small Data Center | Data center that has floor space area of ≤ 5,000 Sq. ft or the number of racks that can be installed is ≤ 200 is classified as a small data center. |
| Medium Data Center | Data center which has floor space area between 5,001-20,000 Sq. ft, or the number of racks that can be installed is between 201-800, is classified as a medium data center. |
| Large Data Center | Data center which has floor space area between 20,001-75,000 Sq. ft, or the number of racks that can be installed is between 801-3,000, is classified as a large data center. |
| Massive Data Center | Data center which has floor space area between 75,001-225,000 Sq. ft, or the number of racks that can be installed is between 3001-9,000, is classified as a massive data center. |
| Mega Data Center | Data center that has a floor space area of ≥ 225,001 Sq. ft or the number of racks that can be installed is ≥ 9001 is classified as a mega data center. |
| Retail Colocation | It refers to those customers who have a capacity requirement of 250 kW or less. These services are majorly opted by small and medium enterprises (SMEs). |
| Wholesale Colocation | It refers to those customers who have a capacity requirement between 250 kW to 4 MW. These services are majorly opted by medium to large enterprises. |
| Hyperscale Colocation | It refers to those customers who have a capacity requirement greater than 4 MW. The hyperscale demand primarily originates from large-scale cloud players, IT companies, BFSI, and OTT players (like Netflix, Hulu, and HBO+). |
| Mobile Data Speed | It is the mobile internet speed a user experiences via their smartphones. This speed is primarily dependent on the carrier technology being used in the smartphone. The carrier technologies available in the market are 2G, 3G, 4G, and 5G, where 2G provides the slowest speed while 5G is the fastest. |
| Fiber Connectivity Network | It is a network of optical fiber cables deployed across the country, connecting rural and urban regions with high-speed internet connection. It is measured in kilometer (km). |
| Data Traffic per Smartphone | It is a measure of average data consumption by a smartphone user in a month. It is measured in gigabyte (GB). |
| Broadband Data Speed | It is the internet speed that is supplied over the fixed cable connection. Commonly, copper cable and optic fiber cable are used in both residential and commercial use. Here, optic cable fiber provides faster internet speed than copper cable. |
| Submarine Cable | A submarine cable is a fiber optic cable laid down at two or more landing points. Through this cable, communication and internet connectivity between countries across the globe is established. These cables can transmit 100-200 terabits per second (Tbps) from one point to another. |
| Carbon Footprint | It is the measure of carbon dioxide generated during the regular operation of a data center. Since, coal, and oil & gas are the primary source of power generation, consumption of this power contributes to carbon emissions. Data center operators are incorporating renewable energy sources to curb the carbon footprint emerging in their facilities. |
Need More Details on Market Definition?
Ask a Question
Research Methodology
Mordor Intelligence follows a four-step methodology in all our reports.
- Step-1: Identify Key Variables: In order to build a robust forecasting methodology, the variables and factors identified in Step-1 are tested against available historical market numbers. Through an iterative process, the variables required for market forecast are set and the model is built on the basis of these variables.
- Step-2: Build a Market Model: Market-size estimations for the forecast years are in nominal terms. Inflation is not a part of the pricing, and the average selling price (ASP) is kept constant throughout the forecast period for each country.
- Step-3: Validate and Finalize: In this important step, all market numbers, variables and analyst calls are validated through an extensive network of primary research experts from the market studied. The respondents are selected across levels and functions to generate a holistic picture of the market studied.
- Step-4: Research Outputs: Syndicated Reports, Custom Consulting Assignments, Databases & Subscription Platforms

Get More Details On Research Methodology
Download PDF


