
Market Overview
| Study Period | 2020 - 2031 |
|---|---|
| Forecast Data Period | 2026 - 2031 |
| Base Year Market Size (2025) | USD 540 Million |
| Market Size (2026) | USD 562.09 Million |
| Market Size (2031) | USD 686.88 Million |
| Growth Rate (2026 - 2031) | 4.09 % |
| Market Concentration | Low |
Major Players *Disclaimer: Major Players sorted in no particular order Image © Mordor Intelligence. Reuse requires attribution under CC BY 4.0. | |
Chile Cold Chain Logistics Market Analysis by Mordor Intelligence
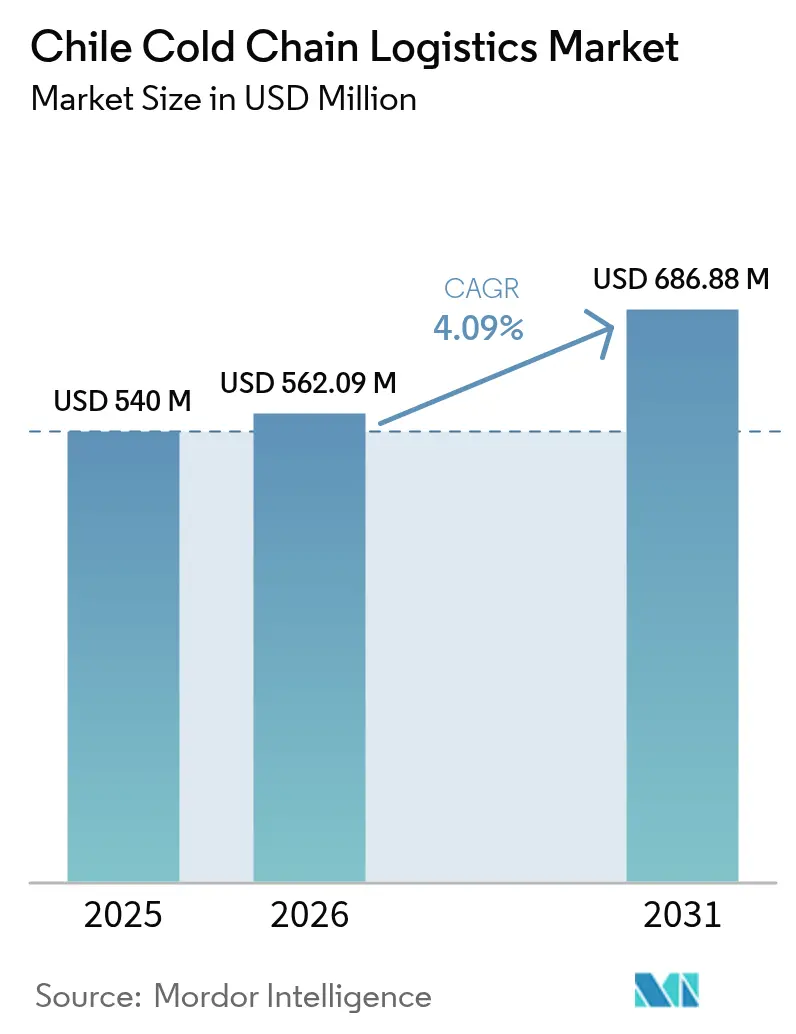
The Chile Cold Chain Logistics Market size was valued at USD 540 million in 2025 and estimated to grow from USD 562.09 million in 2026 to reach USD 686.88 million by 2031, at a CAGR of 4.09% during the forecast period (2026-2031).
Rising export volumes of high-value perishables, resilient domestic demand for frozen foods, renewable-energy incentives for temperature-controlled warehouses, and digital traceability mandates combine to sustain capital flows into temperature-controlled storage, transport, and value-added services. Global buyers reward exporters that document uninterrupted cold conditions from field to ship, prompting investments in IoT monitoring, ammonia-based refrigeration, and portside reefer capacity. Operators also improve energy efficiency through photovoltaic rooftops and battery storage to mitigate peak-season power tariffs, while micro-fulfillment hubs shorten last-mile delivery for e-grocery in Santiago, Valparaíso, and Concepción. Low market concentration enables regional specialists to coexist with multinationals pursuing acquisitions to build nationwide networks.
Key Report Takeaways
- By service type, refrigerated storage led with 40.35% of Chile cold chain logistics market share in 2025; value-added services are forecast to expand at a 4.12% CAGR through 2031.
- By temperature type, the frozen (-18 to 0 °C) band captured 38.55% of Chile cold chain logistics market share in 2025, while deep-frozen/ultra-low segments below -20 °C are projected to advance at a 4.68% CAGR to 2031.
- By application, fruits & vegetables accounted for 20.55% of the Chile cold chain logistics market size in 2025; vaccines & clinical-trial materials are set to grow at a 5.06% CAGR during 2026-2031.
Note: Market size and forecast figures in this report are generated using Mordor Intelligence’s proprietary estimation framework, updated with the latest available data and insights as of 2026.
Chile Cold Chain Logistics Market Trends and Insights
Drivers Impact Analysis*
| Driver | (~) % Impact on CAGR Forecast | Geographic Relevance | Impact Timeline |
|---|---|---|---|
| Surging fresh-fruit export volumes | +1.2% | Valparaíso, O’Higgins, Maule | Medium term (2-4 years) |
| Expansion of the salmon export industry | +0.8% | Los Lagos, Aysén | Long term (≥ 4 years) |
| Growing domestic frozen-food demand | +0.6% | Santiago, Valparaíso, Concepción | Short term (≤ 2 years) |
| Government incentives for PV-powered cold warehouses | +0.4% | Atacama, Antofagasta, nationwide | Long term (≥ 4 years) |
| Micro-fulfillment cold hubs for e-grocery | +0.3% | Santiago, Valparaíso, Concepción | Medium term (2-4 years) |
| Blockchain-based export-traceability mandates | +0.2% | National export corridors | Medium term (2-4 years) |
| Source: Mordor Intelligence | |||


Surging Fresh-Fruit Export Volumes
Cherry output is projected to reach 500,000 tons in marketing year 2024/25, up 6.8% year-on-year, reinforcing capital commitments to pre-cooling tunnels, controlled-atmosphere rooms, and 2,700 new reefer plugs installed at San Antonio port[1]F.A.S., “Chile Stone Fruit Annual,” fas.usda.gov. Table-grape exports are also poised to grow 7.8% to 570,000 tons, expanding the Chile cold chain logistics market as operators adopt modified-atmosphere liners and 0.5 °C cold-treatment regimes that add USD 1,000–2,000 to container costs yet guarantee market access in China. Blockchain pilots document each temperature checkpoint, preserving reputational premium in Asia. These dynamics stimulate suppliers of insulated containers, reefer vessels, and IoT probes, locking in mid-term revenue visibility.
Expansion of the Salmon Export Industry
Chile shipped 782,076 tons of salmon worth USD 6.37 billion in 2024 as processors optimized outbound logistics from Puerto Montt to Santiago airport, underpinning cold-chain service demand. Vertical integration drives investments in blast freezers and –35 °C plate freezers, while UNIDO-supported ammonia systems at Marine Farm cut energy use by 10% and trimmed 1.23 million kg CO₂, illustrating regulatory-aligned cost savings. Government scrutiny of farming density pushes operators toward efficiency, rewarding logistics partners that offer telemetry, hygienic design, and contingency power.
Growing Domestic Frozen-Food Demand
Urban households increased freezer ownership and online grocery orders during the pandemic, prompting logistician Loginsa to manage 75,000 SKUs across 22 sites until its 2024 sale to Ransa. National food waste of 5.18 million tons in 2021—48% fruits and 16% vegetables—highlights the scope for real-time temperature monitoring to extend shelf life. Retail chains are enlarging frozen aisles, stimulating multiclient warehouses that guarantee –18 °C across peak-season load spikes. This steady domestic pull complements export-centric revenue, flattening seasonal utilization curves.
Government Incentives for PV-Powered Cold Warehouses
The Energy Savings Insurance program underwrites photovoltaic retrofits for small and medium facilities, unlocking project financing of USD 36 million annually. High solar-insolation zones in Atacama and Antofagasta adopt rooftop arrays and 2-hour lithium BESS to shave peak tariffs, an approach endorsed by White & Case analysis showing 6 GW of BESS in the pipeline. Enel Chile’s goal of 100% renewable electricity by 2040 reinforces confidence in green power availability, while insurance-backed savings contracts hedge performance risk.
Restraints Impact Analysis*
| Restraint | (~) % Impact on CAGR Forecast | Geographic Relevance | Impact Timeline |
|---|---|---|---|
| First-mile challenges across Andean terrain | –0.7% | Rural fruit belts, Andean corridors | Long term (≥ 4 years) |
| Limited reefer-truck availability | –0.5% | National, acute in southern regions | Medium term (2-4 years) |
| Peak-season electricity tariff spikes | –0.4% | Industrial clusters nationwide | Short term (≤ 2 years) |
| Shortage of natural-refrigerant technicians | –0.3% | Urban centers | Long term (≥ 4 years) |
| Source: Mordor Intelligence | |||
First-Mile Challenges Across Andean Terrain
Chile’s 4,300-km length and steep altitudes complicate time-sensitive haulage from interior orchards to coastal pack houses, adding fuel, transit hours, and spoilage risk[2]International Transport Forum, “Logistics Observatory for Chile,” itf-oecd.org. Quarantine zones now cover one-fifth of cherry groves, forcing detours that raise cost per pallet and crowd the limited reefer supply. Public-private plans such as USD 5 billion “Chile Over Rails” freight upgrades promise relief by 2027, yet climate-driven droughts and landslides still threaten continuity.
Limited Reefer-Truck Availability
Seasonal export peaks absorb nearly all 300-hp tractor units fitted with dual-zone reefers, squeezing fisheries and pharma shippers competing for capacity. Deployment of CO₂ transcritical systems lags amid high ambient temperatures, and ammonia trailers demand technicians who are scarce and expensive. Smaller haulers wrestle with capex hurdles and insurance premiums, perpetuating a capacity pinch that curbs swift market-share gains for chilled categories.
*Our forecasts treat driver/restraint impacts as directional, not additive. The impact forecasts reflect baseline growth, mix effects, and variable interactions.
Segment Analysis
By Service Type: Storage Dominates, Value-Added Gains Momentum
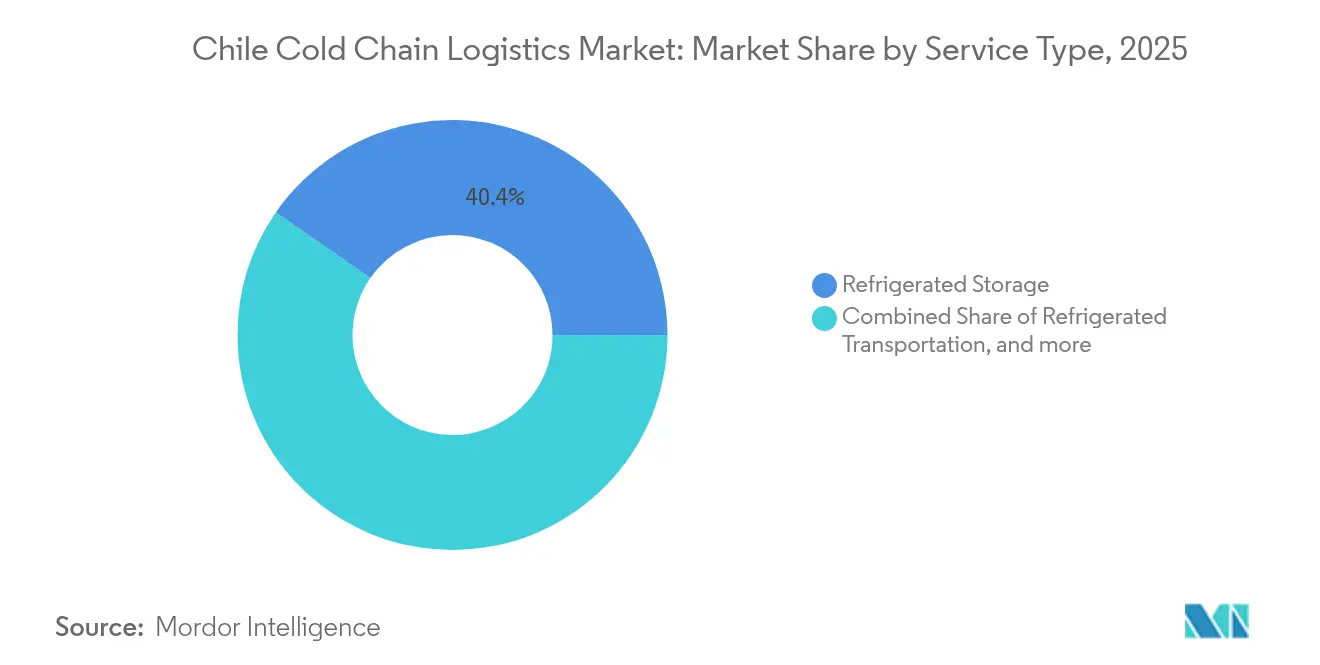
Refrigerated storage contributed 40.35% to the Chile cold chain logistics market share in 2025, underpinning large-scale cherry and salmon export cycles that rely on palletized inventories awaiting vessel slots. Consolidators such as Ice Star now operate eight nationwide depots exceeding 3 million ft³, while public warehouses lease modular cells to smaller packers seeking flexible space. The Chile cold chain logistics market size linked to storage expands modestly as capacity additions match crop growth, yet operators differentiate through ammonia retrofits, solar rooftops, and HACCP-certified handling protocols.
Value-added services capture shippers eager for end-to-end solutions encompassing ripeness profiling, RFID tagging, and export paperwork. At a projected 4.12% CAGR, this niche outpaces headline growth by integrating data analytics and blockchain records that pre-populate customs forms. IoT integration enables remote alarms that reduce incident-related cargo claims and justify premium rates. M&A activity favors firms with bespoke packing lines, pushing segment operators to form alliances with automation vendors.


By Temperature Type: Frozen Leads, Ultra-Low Surges
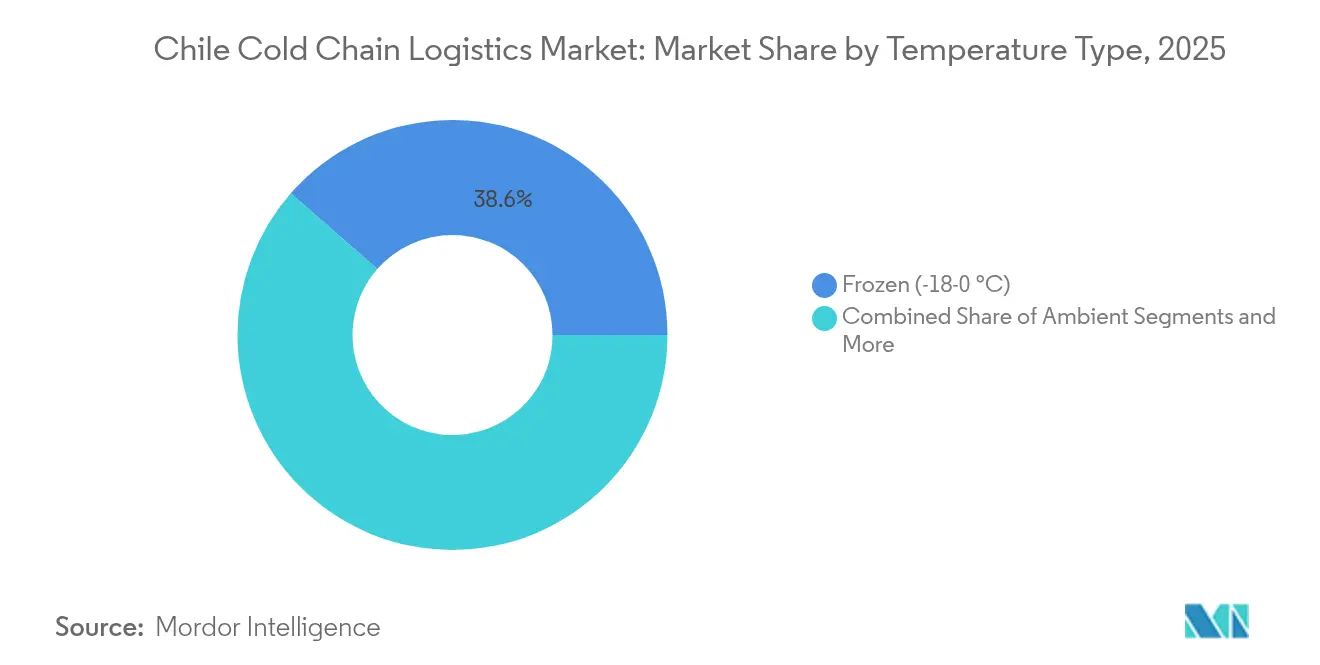
The frozen band between -18 and 0 °C accounted for 38.55% of Chile's cold chain logistics market share in 2025, anchored by salmon fillets and frozen berries destined for North America and Europe. Blast freezers in Puerto Montt achieve -35 °C core temperature within 4 hours, curbing histamine formation and securing higher export grades. The Chile cold chain logistics market size in the deep-frozen/ultra-low bracket is forecast to climb fastest at 4.68% CAGR as vaccination campaigns, mRNA trials, and biologic import flows demand -20 °C to -80 °C stability, especially for Santiago-based depots supplying regional hospitals.
Chilled 0 to 5 °C assets remain critical for fresh grapes, peaches, and avocados with voyage times of 20-30 days to Shanghai. Ambient zones handle processed foods but contribute minimal incremental revenue. Natural refrigerant uptake varies: CO₂ is favored in southern climates, while low-charge ammonia dominates in central valleys, contingent on technician availability and safety compliance.
By Application: Produce Still Largest, Pharma Tops Growth Charts
Fruits & vegetables held 20.55% share of the Chile cold chain logistics market size in 2025, reflecting counter-seasonal shipping windows that align with Northern Hemisphere winter demand. Controlled-atmosphere reefer containers and rapid-cool tunnels reduce respiration and maintain firmness, sustaining exporter premiums. However, volume growth moderates as orchard acreage stabilizes, prompting brokers to explore higher-margin segments.
Vaccines & clinical-trial materials are poised for a 5.06% CAGR through 2031, leveraging Santiago’s clinical-research footprint and Ministry of Health immunization programs. Specialized 2 to 8 °C lanes and dry-ice services attract global CROs that require GxP-compliant handlers. Meat & poultry, fish & seafood, and ready-to-eat meals post steady mid-single-digit expansion as consumer lifestyles shift toward convenience and protein diversification.
Geography Analysis
Metropolitan Santiago anchors the Chile cold chain logistics market with the densest concentration of 3PL hubs, pharmaceutical depots, and cross-docks linking central valleys to ports and airports. DP World’s 2,700 reefer connections at San Antonio port support record cherry throughput, mitigating bottlenecks during December peaks. Inland rail upgrades promise to trim door-to-dock times by 20% once the “Chile Over Rails” spine doubles freight volumes to 21 million tons by 2027.
Los Lagos and Aysén form a salmon-centric logistics corridor where low ambient temperatures complement blast-freezing economics. Processors relocate closer to Route 5 intersections, shaving hours off truck legs to Santiago airport and Valparaíso por. Emerging clusters of PV-powered cold stores in Atacama and Antofagasta leverage 2,900 kWh/m² annual solar resource, lowering levelized energy costs for mining-catered food services.
Longitudinal extremes challenge uniform service delivery; the Andean cordillera restricts east-west corridors, forcing reliance on a limited number of paved passes subject to snow closures. The proposed USD 10 billion Bioceanic Corridor would diversify inland routes, enhancing resilience if funding materializes.
Climate variability causes irrigation stress in Coquimbo while intensifying rain events in Biobío, compelling adaptive design of refrigerated warehouses to withstand both heatwaves and floods.
Regulatory Landscape
Chile cold chain logistics for food is governed primarily by the Ministry of Health under the Reglamento Sanitario de los Alimentos (RSA, Decreto 977/96). The RSA sets mandatory hygienic and temperature-control requirements for production, storage, and distribution, including the use of temperature-recording devices on refrigeration equipment. An updated compilation dated 06-03-2026 reinforces compliance focus for warehouse operators, transporters, and value-added service providers handling chilled and frozen foods.
For export-facing cold chains, establishment authorization and shipment compliance depend on sector regulators. The Servicio Agricola y Ganadero (SAG) enables and supervises export supply-chain nodes, including collection centers, packing plants, and cold stores, through registration and control mechanisms (LEEPP). It also requires market-specific documentation for frozen products, including a Certificado de Proceso de Congelado that states the time-temperature parameters demanded by destination markets. In seafood, SERNAPESCA ties export authorization to evidence that the cold chain is maintained during transport, making continuous monitoring and documented temperature integrity a prerequisite for exporters and their logistics partners.
Value Chain Analysis
Chile's cold chain logistics value chain starts with producers and processors of export-weighted perishables, including fruit from O'Higgins and Maule and seafood from the south. It then moves through pre-cooling, packing, and consolidation at inland cold stores and cross-docks before refrigerated linehaul to major gateways such as San Antonio and Valparaiso. Airfreight links are concentrated around Santiago for higher-value and time-sensitive pharma and seafood flows. Export programs such as Cherry Express underscore the role of integrated reefer services that coordinate inland handoffs, port operations, and ocean transit within tight temperature windows.
Downstream, port and terminal operators provide reefer plugs, monitoring, and operational planning that affect dwell time and temperature stability, while 3PLs differentiate through value-added services such as labeling, documentation support, and digital traceability. Bottlenecks typically cluster around seasonal congestion on key corridors to San Antonio (including Route 68), limited availability of reefer trucks during peak export weeks, and process friction at container reception and clearance steps that can extend time at ambient conditions. Operators are responding with more automated and energy-efficient cold storage near key hubs, including examples such as ASRS-enabled capacity expansions in Maipu and additional port-adjacent cold infrastructure. Industry and port forums have also emphasized execution discipline and coordination to reduce breaks in the cold chain.
Competitive Landscape
Low concentration defines the Chile cold chain logistics market. IceStar’s June 2024 acquisition of Mega Frio Chile added eight sites and signaled an appetite for horizontal integration. Emergent Cold LatAm simultaneously scaled to 157 million ft³ region-wide, positioning itself for multi-country service contracts.
Technology adoption differentiates competitors: IoT sensor suites broadcast live dashboards that let shippers intervene before deviations breach setpoints, reducing spoilage and insurance claims. CEVA Logistics’ FORPLANET initiative deploys sustainable fuels and 1,000 low-carbon trucks, catering to exporters seeking ESG-aligned partners. DHL, Kuehne + Nagel, and DSV leverage global pharma certifications, yet local independents retain share through bespoke fruit-handling know-how and flexible pricing.
Future rivalry centers on ultra-low storage, blockchain integration, and renewable-powered depots. Training alliances with technical institutes aim to expand the pool of natural-refrigerant specialists, while venture funding flows to startups offering AI route optimization and automated pallet shuttles. Given overlapping investments and moderate economies of scale, market leadership is expected to change hands primarily through mergers rather than through organic displacement.
Chile Cold Chain Logistics Industry Leaders
Megafrio Chile
Frio Romeral Limitada
Empresas Taylor
Transportes Nazar
Friofort SA
- *Disclaimer: Major Players sorted in no particular order


Market Opportunities and Future Outlook
Port-adjacent freezing and storage capacity is a clear whitespace area where service providers are adding processing capability to reduce intermediate handling for export cargo. Emergent Cold LatAm commissioning new blast-freezing tunnels in San Antonio, including over 10,500 tons of annual processing capacity, illustrates the opportunity for integrated freezing-plus-logistics offerings for protein and other frozen exports that benefit from faster conversion to export-ready temperature bands. A complementary opportunity is digital temperature integrity and documentation workflows, since cold-chain compliance under the RSA (Decreto 977/96) and export-authority oversight from SAG and SERNAPESCA increase the value of continuous monitoring, exception management, and audit-ready records across storage and transport legs.
Public programs and pilots are also creating room for network redesign and service innovation. In January 2026, the Ministry of Transport and Telecommunications introduced a National Logistics Policy, and in February 2026 it launched the 5th edition of the Collaborative Logistics Plan covering key ports such as San Antonio and Talcahuano-San Vicente, which supports process standardization and data integration aimed at reducing dwell time for reefer cargo. Intermodal testing adds another opportunity layer for long domestic corridors, with FEPASA running an intermodal rail-road pilot between Santiago and Talcahuano in July 2026 and creating a reference point for shifting part of temperature-sensitive and mass-consumption freight away from saturated road corridors where service reliability is constrained during seasonal peaks.
Recent Industry Developments
- July 2026: FEPASA conducted an intermodal freight pilot combining rail and road between Santiago and Talcahuano. The initiative validated operational steps for shifting part of long-haul flows away from congested road corridors. This supports cold chain network design options around southern gateways where seafood and processed-food volumes concentrate.
- April 2025: IceStar completed the acquisition of 100% of Megafrío Chile SpA from Megacentro for about USD 57 million. The transaction expanded IceStar's national refrigerated footprint and strengthened multi-site coverage for exporters and retailers. It also highlighted ongoing consolidation as specialized operators absorb assets previously held by real-estate-linked owners.
- June 2024: IceStar acquired Mega Frio Chile, adding eight sites and expanding its refrigerated logistics platform. The deal increased the availability of multi-client cold storage capacity for fruit and seafood cycles. It also intensified competitive pressure on smaller regional providers to match network breadth and service integration.


Research Methodology Framework and Report Scope
Market Definition and Coverage
For this study, the Chile cold chain logistics market covers paid logistics services that keep products within required temperature bands during storage, handling, and transportation inside Chile, from origin pickup through delivery. We count revenue linked to temperature-controlled warehousing, refrigerated transport, and related value-added cold chain services.
Scope exclusions: We exclude the value of the underlying goods, captive logistics done only for internal use, and general dry logistics that does not require temperature control.
Segmentation Overview
- By Service Type
- Refrigerated Storage
- Public Warehousing
- Private Warehousing
- Refrigerated Transportation
- Road
- Rail
- Sea
- Air
- Value-Added Services
- Refrigerated Storage
- By Temperature Type
- Chilled (0–5 °C)
- Frozen (-18–0 °C)
- Ambient
- Deep-Frozen / Ultra-Low (less than-20 °C)
- By Application
- Fruits & Vegetables
- Meat & Poultry
- Fish & Seafood
- Dairy & Frozen Desserts
- Bakery & Confectionery
- Ready-to-Eat Meals
- Pharmaceuticals & Biologics
- Vaccines & Clinical Trial Materials
- Chemicals & Specialty Materials
- Other Applications
Data Sources, Market Sizing, and Validation
Desk Research
Desk work started by mapping the demand pool that normally needs refrigerated or frozen movement in Chile, then aligning it to how cold chain services are sold and billed. We used public sources such as Chile Customs trade statistics, FAOSTAT food balance and production series, and the World Bank macro indicators to build realistic activity levels and economic context.
For market fingerprints, we referenced sources such as the Ministry of Health for pharma and cold storage compliance context, and Servicio Nacional de Pesca y Acuicultura (SERNAPESCA) plus agriculture and food export publications for perishables that drive cold movement. Company annual reports, investor decks, port and airport statistics, and reputable press were used to confirm capacity additions and corridor-level demand signals. Where helpful, we also used paid database subscriptions for company financials and intelligence, import-export shipment-level checks, and patent databases to sense technology direction. These desk sources are illustrative, and many other public and paid references were also used for data collection, validation, and clarification.
Primary Interviews and Surveys
Primary interviews and surveys were run with cold storage operators, refrigerated transporters, freight forwarders handling temperature-sensitive cargo, and large shippers from food and life sciences. We used these conversations to confirm service mix splits, typical contract structures, utilization patterns, and how pricing moves with diesel, electricity, and peak-season capacity tightness across Chile.
Distribution of primary research fieldwork respondents
| Company type | Respondent position |
|---|---|
| Top tier: 28% | CXOs: 12% |
| Mid tier: 54% | Functional/Unit leaders: 35% |
| Smaller Players: 18% | Managers: 53% |
Market-Sizing & Forecasting
Sizing was built using a top-down demand reconstruction that starts from Chile's temperature-sensitive flow drivers, then translates them into cold storage and refrigerated transport service needs. In practice, we tracked indicators such as export and domestic movement of fruits and vegetables, seafood and meat volumes, pharma and vaccine handling needs, cold storage capacity additions, and energy and fuel cost trends that influence service pricing.
Those demand signals were converted into value using practical price and utilization assumptions, including typical warehouse occupancy ranges, reefer truck trip intensity, and the share of cargo that stays chilled versus frozen. To keep totals grounded, we ran selective bottom-up checks, including sampled provider revenue ranges, channel checks on rate cards, and sanity checks using capacity times assumed utilization where data was available. When provider financials were not fully visible, gaps were handled through bounded proxies based on fleet sizes, warehouse footprint, and contract coverage patterns described in interviews.
Forecasting used scenario analysis, where expected changes in food export cycles, retail cold penetration, and pharma logistics requirements were translated into volume and price paths, then cross-checked against expert views on capacity tightening and cost pass-through behavior.
Data Validation & Update Cycle
Outputs were validated by comparing model totals against independent signals, including trade and export series for key perishables, known cold storage capacity expansions, and realistic revenue per pallet position or per reefer trip ranges discussed in interviews. Outliers were reviewed in a separate variance pass, and assumptions were revisited when any single input moved the result more than expected.
Before sign-off, the work goes through a multi-step analyst review so definitions, math, and year alignment stay consistent across tables and narratives. Reports are refreshed annually, and interim updates are triggered when material events occur, such as major capacity commissioning, policy shifts affecting food or pharma handling, or sustained cost shocks. Right before delivery, we run a final update pass so clients receive the latest view available at that time.
Mordor Intelligence's Chile Cold Chain Logistics Market Estimate Compared With Other Published Estimates
Published market sizes for Chile cold chain logistics often look different because the service boundary is not always consistent, and the same freight can be counted at different points in the chain. Differences also show up when one study uses shipment activity and capacity signals, while another leans more on broad logistics spending ratios or a single-year price snapshot.
The table shows a spread that largely comes from what is counted as cold chain logistics revenue, and from how pricing is carried forward into the base year and early forecast years. In Mordor Intelligence's model, we count storage, transportation, and value-added cold chain services, but we do not add the value of the goods or general ambient logistics that does not require temperature control, which can pull the total away from estimates that bundle wider logistics functions.
Benchmark comparison
| Source | Market Size | Gaps in Research Methodology |
|---|---|---|
| Mordor Intelligence | USD 540 M (2025) | |
| Regional Consultancy A | USD 590 M (2026) | Uses a later base year and appears to apply an upfront price uplift without fully normalizing for utilization and seasonal occupancy, which can raise the starting value for storage and transport. |
| Industry Brief B | USD 302 M (2022) | Anchors on an older year and seems to reflect a narrower service set or partial channel coverage, which can miss value-added services and parts of domestic refrigerated distribution. |
Taken together, the gap across sources is explained by year alignment, what service lines are included, and whether price and utilization are updated with on-the-ground checks. Our approach keeps each step tied to visible demand signals and interview-backed assumptions, so the final value can be traced back to practical drivers and repeated when new data becomes available.


Key Questions Answered in the Report
What is the 2026 value of the Chile cold chain logistics market?
The market stands at USD 562.09 million in 2026.
How fast will Chile’s cold chain logistics grow through 2031?
It is forecast to expand at a 4.09% CAGR to reach USD 686.88 million.
Which service type currently holds the largest share?
Refrigerated storage leads with 40.35% share in 2025.
Which application segment is growing the fastest?
Vaccines and clinical-trial materials are projected to grow at 5.06% CAGR.
Why are renewable-energy incentives important for cold warehouses in Chile?
They lower operating costs and hedge against peak-season electricity tariffs.
How concentrated is the competitive landscape?
The top five players control less than 35% of capacity, indicating moderate fragmentation.
Page last updated on:


 Your data is secure and never sold or shared.


