
Chickpea Market Size and Share
Chickpea Market Analysis by Mordor Intelligence
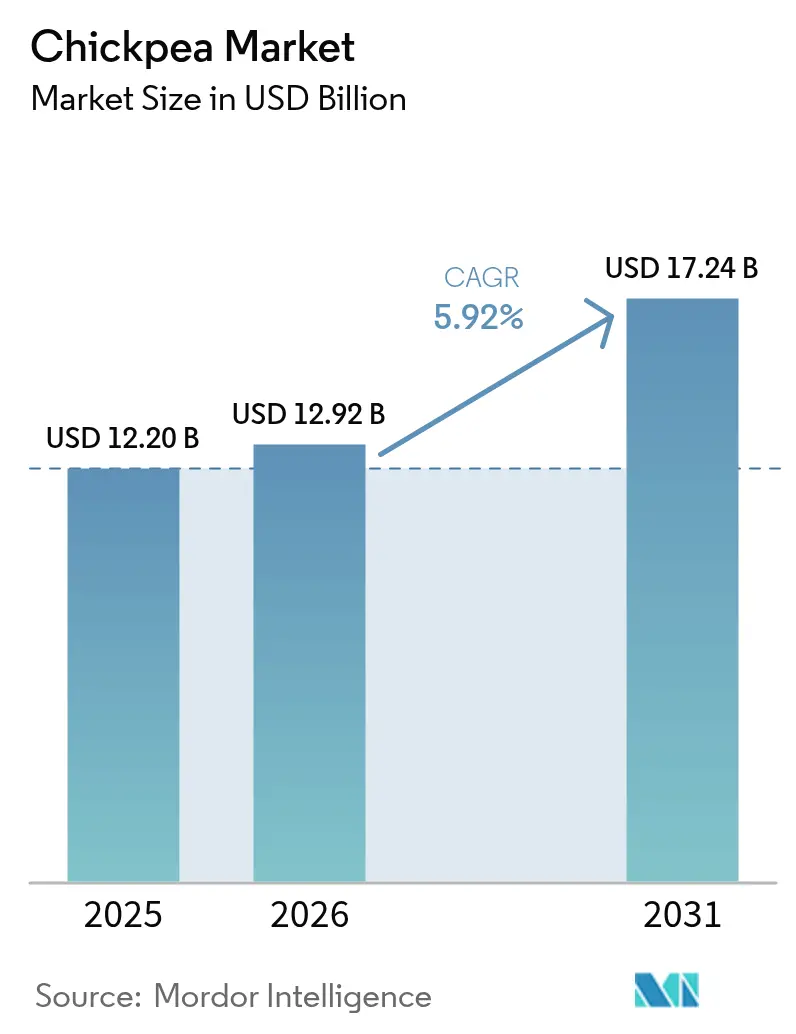
The chickpea market size was valued at USD 12.20 billion in 2025 and is estimated to grow from USD 12.92 billion in 2026 to USD 17.24 billion by 2031, at a CAGR of 5.92% during the forecast period (2026-2031). Rising plant-based eating, wider use of chickpea protein isolates, and supply reallocation toward Russia and Africa underpin expansion, even as climate volatility heightens production risk. Australia retains a pricing premium on large Kabuli grades, yet Russia’s cost advantage and Black Sea logistics are eroding that lead. India dominates both output and demand, but still imports large volumes of Kabuli types for snack manufacturing, a paradox that tightens global trade balances. Processors now pursue vertical integration, biofortification, and digital farming partnerships to secure traceable volumes demanded by European and North American buyers.
Key Report Takeaways
- By geography, Asia-Pacific is largest region, held 35.5% of the chickpea market share in 2025, Africa is fastest-growing region, projected to grow at a 6.91% CAGR through 2031.
Note: Market size and forecast figures in this report are generated using Mordor Intelligence’s proprietary estimation framework, updated with the latest available data and insights as of 2026.
Market Trends and Insights
Drivers Impact Analysis of Chickpea Market*
| Driver | (~) % Impact on CAGR Forecast | Geographic Relevance | Impact Timeline |
|---|---|---|---|
| Expanding vegan and flexitarian populations | +0.6% | Global, with concentration in North America, Europe, and urban Asia-Pacific | Medium term (2-4 years) |
| Surge in pulse-based protein isolates for functional foods | +0.5% | Global, strongest in North America and Asia-Pacific food manufacturing hubs | Medium term (2-4 years) |
| Growth of gluten-free bakery and snack categories | +0.4% | North America, Europe, and urban Asia-Pacific markets | Short term (≤2 years) |
| Government biofortification programs for climate-smart legumes | +0.3% | Asia-Pacific (India), Africa (Ethiopia, Malawi), and select South American initiatives | Long term (≥4 years) |
| Circular-economy valorization of chickpea by-products | +0.2% | Global, with early adoption in Europe and North America for aquafaba and hull applications | Medium term (2-4 years) |
| Digital agriculture boosting smallholder chickpea yields | +0.5% | Asia-Pacific (India), Africa (Ethiopia, and Tanzania), and emerging precision-ag markets | Medium term (2-4 years) |
| Source: Mordor Intelligence | |||
Expanding Vegan and Flexitarian Populations
The global shift toward plant-based diets is a significant factor driving the demand for chickpeas. As consumers reduce meat consumption for health, environmental, and ethical reasons, chickpeas are increasingly utilized as a protein-rich alternative in daily diets. They are commonly used in products such as hummus, falafel, plant-based snacks, dairy alternatives, and ready-to-eat meals. In North America and Europe, the rise of flexitarian consumers has boosted retail sales of hummus and chickpea-based pasta, increasing demand for Kabuli chickpeas from exporters like India and Mexico. Additionally, urban consumers in India and China have adopted roasted chickpea snacks as an affordable protein source, contributing to increased demand in metropolitan areas. In 2025, a collaborative study conducted by YouGov and Veganuary estimated that around 25.8 million people worldwide attempted veganism. These dietary shifts are driving volume growth while reducing dependence on price-sensitive traditional markets.
Surge in Pulse-Based Protein Isolates for Functional Foods
Chickpeas are increasingly being processed into protein isolates and flours, which are utilized in sports nutrition, meat alternatives, and gluten-free products. Food manufacturers prefer chickpea protein for its neutral taste, clean-label attributes, and allergen-friendly profile compared to soy. In the United States and Europe, plant-based meat brands are incorporating chickpea protein into products such as burgers and protein snacks, boosting the demand for processing-grade chickpeas. Chickpea flour, with protein content and neutral flavor, is a favored gluten-free ingredient. Tortilla formulations containing 30% chickpea flour offer higher levels of iron and potassium while maintaining flexibility, thereby expanding options for healthier snack wraps[1]Source: Institute of Food Technologists, “Chickpea Flour Elevates Iron and Potassium in Gluten-Free Tortillas While Preserving Flexibility,” ift.org. As processing efficiency improves, ingredient costs are projected to decline, further supporting demand growth.
Growth of Gluten-Free Bakery and Snack Categories
With increasing awareness of gluten intolerance, chickpea flour (besan) is widely used in gluten-free bakery products, snacks, and extruded items. Its high protein and fiber content enhances nutritional labeling claims, making it attractive to health-conscious consumers. In Europe, gluten-free snack manufacturers are increasingly incorporating chickpea flour into crackers and baked chips, driving demand in value-added chickpea segments. In addition, countries like Malawi and Tanzania have launched initiatives supported by multilateral donors to promote biofortified legumes as solutions for nutrition and climate resilience. Premium pricing and nitrogen-fixation benefits encourage smallholder farmers to adopt these seeds, supporting future acreage expansion and market growth.
Government Biofortification Programs for Climate-Smart Legumes
Several governments are promoting chickpea cultivation due to its nitrogen-fixing properties and resilience in semi-arid climates. Chickpeas enhance soil fertility and reduce dependency on chemical fertilizers, aligning with sustainable agriculture objectives. In countries like India and Ethiopia, government-backed pulse production initiatives have expanded chickpea acreage, stabilizing domestic supply while enhancing export potential. In 2025, the Department of Agricultural Statistics introduced a new chickpea variety, JG-14, in the DSSAT framework to support sustainable agricultural development[2]Source: Department of Agriculture and Farmers Welfare, “Department of Agricultural Statistics Introduces Chickpea Variety JG-14 Into the DSSAT Framework,” agricoop.nic.in.
Restraints Impact Analysis of Chickpea Market*
| Restraint | (~) % Impact on CAGR Forecast | Geographic Relevance | Impact Timeline |
|---|---|---|---|
| Yield volatility from El Niño-linked drought cycles | -0.4% | Australia, Africa (Ethiopia, Tanzania), and South America (Argentina) | Short term (≤2 years) |
| Post-harvest mycotoxin contamination risks | -0.2% | Africa (Ethiopia, Malawi), South America (Argentina), and South Asia under humid storage | Medium term (2-4 years) |
| Price undercutting from synthetic pea-protein concentrates | -0.2% | Global, the strongest impact in North America and Europe sports-nutrition and meat-alternative segments | Medium term (2-4 years) |
| Logistics bottlenecks at key export ports | -0.1% | India (Mundra, Chennai), Canada (Vancouver), and Ukraine (Odessa) | Short term (≤2 years) |
| Source: Mordor Intelligence | |||
Yield Volatility from El Niño-Linked Drought Cycles
Chickpea production is highly influenced by rainfall patterns. El Niño events frequently result in droughts in major producing regions, including Australia, parts of Africa, and South America, which lead to reduced yields and supply shortages. During drought years in Australia, chickpea production experiences significant declines, causing global price increases and constrained supply in export markets. Farmers in semi-arid regions often shift acreage to more drought-resistant pulses or cereals during predicted El Niño years, further exacerbating supply constraints. While breeding programs are advancing the development of drought-escape varieties, widespread adoption is still several seasons away. Adaptation measures include the development of drought-tolerant varieties and the use of supplemental irrigation systems. Research suggests that early sowing and short-duration cultivars can help mitigate some yield losses.
Post-Harvest Mycotoxin Contamination Risks
Improper storage under humid conditions can lead to fungal growth and aflatoxin contamination, particularly in tropical regions. This impacts export quality standards and can lead to shipment rejections. In East Africa, inadequate storage infrastructure has caused export losses due to contamination levels exceeding European Union safety standards. Emerging technologies, such as plasma treatment and controlled-atmosphere storage, show potential, the required capital investments are often not viable for small-scale traders. The economic impact extends beyond direct losses, as contamination risks increase insurance costs and necessitate investments in detection and management systems throughout the supply chain.
*Our forecasts treat driver/restraint impacts as directional, not additive. The impact forecasts reflect baseline growth, mix effects, and variable interactions.
Geography Analysis
APAC Chickpea Market
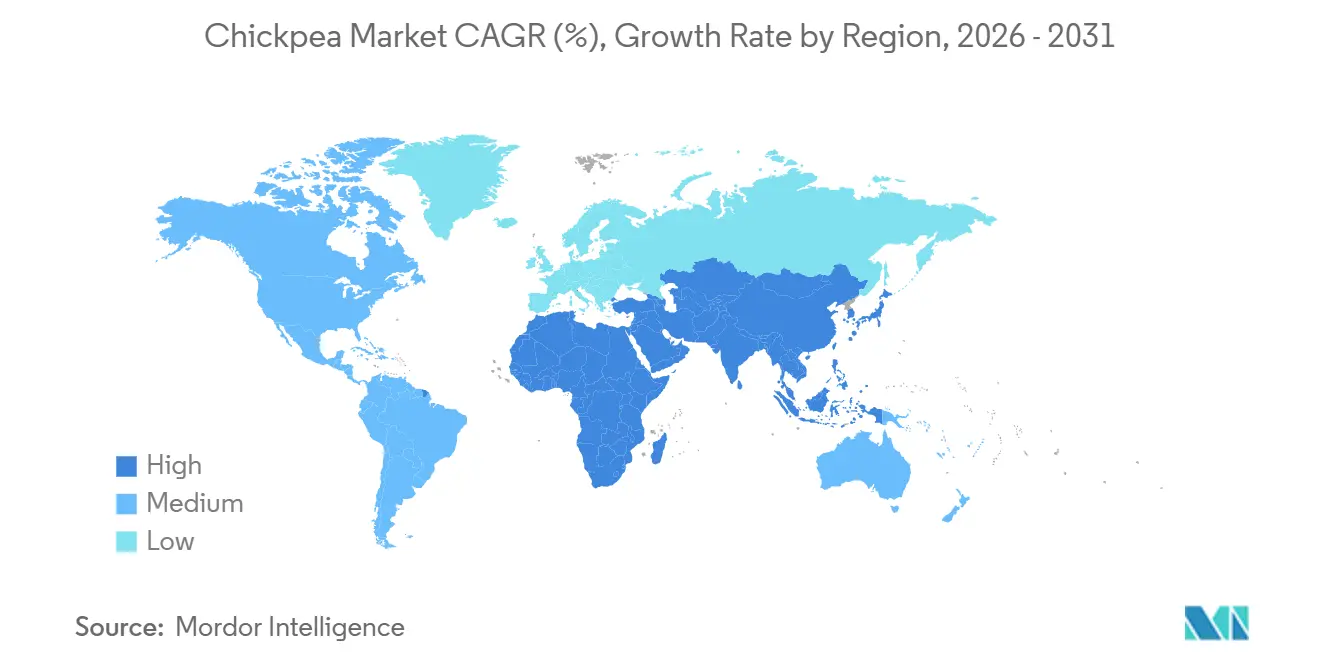
Asia-Pacific is the largest region, holding 35.5% of the chickpea market share in 2025. The chickpea market is influenced by established culinary traditions and the increasing use of packaged foods. The market size, linked to regional processing clusters, is projected to grow as multinational snack brands source from dedicated hubs. Regional dynamics highlight varying consumption patterns and production capabilities, which are reshaping global trade flows.
Africa Chickpea Market
Africa is the fastest-growing region in the market, with a projected CAGR of 6.91% through 2031. Growth is driven by biofortification initiatives in Ethiopia, Tanzania, and Malawi, alongside the recovery of tourism and food service sectors. Ethiopia has used digital extension platforms to improve yields and meet export-quality standards, in compliance with European Union import protocols. Donor-funded biofortification projects have introduced high-iron chickpea varieties, enhancing domestic nutrition and positioning the region for premium export opportunities.
North America and Europe Chickpea Market
The North American chickpea market is supported by the growth of plant-based product launches and the increasing adoption of ethnic cuisines. Chickpea production is primarily concentrated in the United States, particularly in Montana and North Dakota, where chickpeas are incorporated into wheat rotations due to their agronomic benefits. North America and Europe dominate premium segments focused on high-protein flours and isolates, catering to flexitarian product lines. Recent industry consolidation, such as Above Food’s acquisition of The Redwood Group’s specialty crop division, highlights efforts to secure a consistent supply in these mature yet innovation-driven markets. Chickpea production for 2024 totaled 54.2 million metric tons, an increase compared to the 37.0 million metric tons produced in the previous year. The planted area was at 393,370 acres, increases by 271,790 acres from 2023[3]Source: USDA Foreign Agricultural Service, “Spotlight on Global Chickpea Exports 2025,” fas.usda.gov.


Regulatory Landscape
Global chickpea trade is anchored on food-safety and quality standards that govern moisture, defects, and grade tolerances across origins and destination markets. Codex Alimentarius (Codex Stan 171-1989) sets a reference maximum moisture level of 14% for chickpeas under moderate climate conditions, while major exporters apply country-specific grading systems such as USDA AMS U.S. Standards for Beans (Chickpea/Garbanzo Beans) and the Canadian Grain Commission official grading guide for chickpeas (including grade-determining factors and foreign material limits for Canada Western Kabuli and Desi shipments).
In India, trade compliance is shaped by tariff administration and government market interventions. In June 2026, the Office of the Commissioner of Customs (JNCH, Nhava Sheva) withdrew consultative letters issued to 132 importers and confirmed the classification of Desi Chana under tariff item 0713 20 20, helping reduce classification disputes at import clearance. Separately, pulse import duties remained in place in FY26 (with chana referenced around the 10% to 11% range in market reporting), and procurement agencies such as Nafed and NCCF managed gram buffer stocks (reported around 1.1 million tonnes as of May 2026), which influences domestic price stabilization and the timing of import demand.
Value Chain Analysis
The chickpea value chain runs from input supply (seed systems, fertilizer and crop protection, mechanization services, and farm credit) through production, aggregation, processing, and downstream distribution. Producers range from smallholders in South Asia and parts of Africa to mechanized farms in Australia and North America; village-level dealers, brokers, and cooperatives aggregate volumes, then millers and ingredient processors convert chickpeas into split pulses, flour (besan), and protein ingredients used in snacks, bakery, and plant-based formulations. Exporters and global merchants manage cleaning, grading, storage, and container/bulk logistics into import channels serving food manufacturers, retail, and foodservice.
Seasonality and origin diversification are central to how the chain balances supply. India typically harvests its winter crop in Q1, while Australia harvests later in the calendar year, creating shifting availability windows that traders use for multi-origin blending. Government and industry reporting highlights variability across origins, including increased Canadian output in the 2025/2026 season (around 482,000 tonnes versus 287,000 tonnes in 2024/2025) and a 7% decline in U.S. chickpea availability during 2025. Common bottlenecks include limited transparent market information and credit access at farmgate, infrastructure gaps in transport and storage, and quality losses (including contamination risk) that push costs upward through sorting, testing, and rework before export.
Competitive Landscape
The chickpea market includes producers, importers, exporters, and other stakeholders, offering opportunities for regional specialists and cooperative networks to compete based on proximity to origin and quality differentiation. AGT Food and Ingredients has established a strong position through vertically integrated operations encompassing seed development, farmer contracting, processing, and export logistics across Canadian, Australian, and Turkish origins. Olam Group focuses on sustainability certifications and traceability systems, enabling premium pricing in European organic markets. Meanwhile, Bunge and Archer-Daniels-Midland utilize global origination networks to capitalize on regional price differences and supply institutional buyers requiring multi-origin blending.
The strategic focus in the chickpea market has transitioned from volume aggregation to value-chain integration. Processors are co-investing in biofortified seed distribution and digital agriculture platforms to ensure traceable supply chains while enhancing smallholder yields. In 2025, Indigo Ag enrolled Indian chickpea farms in satellite-monitoring programs, reducing crop losses and creating a differentiated supply stream for buyers seeking verified, sustainable sourcing. Growth opportunities are concentrated in protein-isolate production and by-product utilization. While chickpea protein isolates are traded, North American processing capacity remains below that of pea-protein infrastructure, limiting supply for meat-alternative and sports-nutrition brands seeking non-soy options.
Emerging disruptors in the chickpea market include digital agriculture platforms, such as those operated by Indigo Ag, which bypass traditional trading intermediaries by connecting farmers directly with end buyers. This approach reduces supply-chain costs and improves farmers' incomes. Technology adoption accelerated in 2025, with blockchain-linked traceability systems addressing European Union due diligence regulations implemented in 2024. Adoption remains concentrated among large cooperatives, providing digital-enabled origins with a competitive advantage over less technologically advanced suppliers.
Market Opportunities and Future Outlook
Varietal and ingredient-led differentiation is opening whitespace beyond bulk whole-seed trade, particularly where food manufacturers want higher protein density and more consistent functional performance in flours and protein fractions. In March 2026, NuCicer and Stricks Ag announced a 10,000-acre commercial rollout of proprietary high-protein chickpea varieties for the 2026 growing season, a concrete step toward scaling identity-preserved supply for ingredient customers. This type of upstream contracting aligns with the report trend of processors and buyers pursuing traceable volumes for Europe and North America, and it supports product development in gluten-free bakery, snacks, and alternative-protein applications where chickpea protein competes with pea-based concentrates.
Opportunities also sit in yield and quality stabilization across emerging origins where export protocols are tightening. Programs referenced in the report context, such as biofortification and digital extension initiatives in Africa (Ethiopia, Tanzania, and Malawi) and government-linked variety development and decision-support tools in India (for example, integrating chickpea variety JG-14 into the DSSAT framework in 2025), create pathways for export-grade supply and differentiated nutrition claims. Alongside these, adoption of farm practices and inputs demonstrated to raise yields in rain-fed environments (for example, bio-stimulant use and extension-led demonstrations reported in agronomy studies) supports growers and aggregators seeking to reduce volatility from drought cycles and to meet stricter buyer specifications on moisture, defects, and safety.
Recent Industry Developments in Chickpea Market
- July 2026: NuCicer expanded its North American chickpea program to 10,000 acres in 2026, accelerating commercial-scale supply for ingredient manufacturers.
- September 2025: Chickapea closed a CAD 4.25 million funding round led by AGT Foods, with participation including FCC Capital. The capital supports broader North American distribution and marketing, linking upstream pulse sourcing strength with branded demand growth in chickpea-based pasta.
- February 2024: InnovoPro introduced a barista-grade chickpea protein ingredient aimed at beverage and food applications. The launch broadened the use case for chickpea protein beyond traditional solids, reinforcing innovation momentum in value-added chickpea ingredients.


Chickpea Market Report Scope and Research Methodology
Market Definition and Coverage
For this study, the chickpea market is defined as the value of chickpeas traded and consumed for food and feed use, tracked across producing and importing countries, and expressed in USD with volumes in metric tons.
Scope exclusions: It excludes chickpea-derived ingredients (such as protein isolates, flour blends, and ready-to-eat snacks) when they are priced and sold as processed products rather than as chickpeas.
Segments Covered in This Report
- By Geography
- North America
- United States
- Production Analysis (Area Harvested, Yield, and Production Volume)
- Consumption Analysis (Consumption Value and Volume)
- Import Market Analysis (Import Value, Volume, and Key Supplying Markets)
- Export Market Analysis (Export Value, Volume, and Key Destination Markets)
- Wholesale Price Trend Analysis and Forecast
- Regulatory Framework
- List of Key Players
- Logistics and Infrastructure
- Seasonality Analysis
- Canada
- Production Analysis (Area Harvested, Yield, and Production Volume)
- Consumption Analysis (Consumption Value and Volume)
- Import Market Analysis (Import Value, Volume, and Key Supplying Markets)
- Export Market Analysis (Export Value, Volume, and Key Destination Markets)
- Wholesale Price Trend Analysis and Forecast
- Regulatory Framework
- List of Key Players
- Logistics and Infrastructure
- Seasonality Analysis
- Mexico
- Production Analysis (Area Harvested, Yield, and Production Volume)
- Consumption Analysis (Consumption Value and Volume)
- Import Market Analysis (Import Value, Volume, and Key Supplying Markets)
- Export Market Analysis (Export Value, Volume, and Key Destination Markets)
- Wholesale Price Trend Analysis and Forecast
- Regulatory Framework
- List of Key Players
- Logistics and Infrastructure
- Seasonality Analysis
- United States
- Europe
- Germany
- Production Analysis (Area Harvested, Yield, and Production Volume)
- Consumption Analysis (Consumption Value and Volume)
- Import Market Analysis (Import Value, Volume, and Key Supplying Markets)
- Export Market Analysis (Export Value, Volume, and Key Destination Markets)
- Wholesale Price Trend Analysis and Forecast
- Regulatory Framework
- List of Key Players
- Logistics and Infrastructure
- Seasonality Analysis
- United Kingdom
- Production Analysis (Area Harvested, Yield, and Production Volume)
- Consumption Analysis (Consumption Value and Volume)
- Import Market Analysis (Import Value, Volume, and Key Supplying Markets)
- Export Market Analysis (Export Value, Volume, and Key Destination Markets)
- Wholesale Price Trend Analysis and Forecast
- Regulatory Framework
- List of Key Players
- Logistics and Infrastructure
- Seasonality Analysis
- France
- Production Analysis (Area Harvested, Yield, and Production Volume)
- Consumption Analysis (Consumption Value and Volume)
- Import Market Analysis (Import Value, Volume, and Key Supplying Markets)
- Export Market Analysis (Export Value, Volume, and Key Destination Markets)
- Wholesale Price Trend Analysis and Forecast
- Regulatory Framework
- List of Key Players
- Logistics and Infrastructure
- Seasonality Analysis
- Germany
- Asia-Pacific
- China
- Production Analysis (Area Harvested, Yield, and Production Volume)
- Consumption Analysis (Consumption Value and Volume)
- Import Market Analysis (Import Value, Volume, and Key Supplying Markets)
- Export Market Analysis (Export Value, Volume, and Key Destination Markets)
- Wholesale Price Trend Analysis and Forecast
- Regulatory Framework
- List of Key Players
- Logistics and Infrastructure
- Seasonality Analysis
- India
- Production Analysis (Area Harvested, Yield, and Production Volume)
- Consumption Analysis (Consumption Value and Volume)
- Import Market Analysis (Import Value, Volume, and Key Supplying Markets)
- Export Market Analysis (Export Value, Volume, and Key Destination Markets)
- Wholesale Price Trend Analysis and Forecast
- Regulatory Framework
- List of Key Players
- Logistic and Infrastructure
- Seasonality Analysis
- Australia
- Production Analysis (Area Harvested, Yield, and Production Volume)
- Consumption Analysis (Consumption Value and Volume)
- Import Market Analysis (Import Value, Volume, and Key Supplying Markets)
- Export Market Analysis (Export Value, Volume, and Key Destination Markets)
- Wholesale Price Trend Analysis and Forecast
- Regulatory Framework
- List of Key Players
- Logistics and Infrastructure
- Seasonality Analysis
- China
- South America
- Brazil
- Production Analysis (Area Harvested, Yield, and Production Volume)
- Consumption Analysis (Consumption Value and Volume)
- Import Market Analysis (Import Value, Volume, and Key Supplying Markets)
- Export Market Analysis (Export Value, Volume, and Key Destination Markets)
- Wholesale Price Trend Analysis and Forecast
- Regulatory Framework
- List of Key Players
- Logistics and Infrastructure
- Seasonality Analysis
- Argentina
- Production Analysis (Area Harvested, Yield, and Production Volume)
- Consumption Analysis (Consumption Value and Volume)
- Import Market Analysis (Import Value, Volume, and Key Supplying Markets)
- Export Market Analysis (Export Value, Volume, and Key Destination Markets)
- Wholesale Price Trend Analysis and Forecast
- Regulatory Framework
- List of Key Players
- Logistics and Infrastructure
- Seasonality Analysis
- Brazil
- Middle East
- Saudi Arabia
- Production Analysis (Area Harvested, Yield, and Production Volume)
- Consumption Analysis (Consumption Value and Volume)
- Import Market Analysis (Import Value, Volume, and Key Supplying Markets)
- Export Market Analysis (Export Value, Volume, and Key Destination Markets)
- Wholesale Price Trend Analysis and Forecast
- Regulatory Framework
- List of Key Players
- Logistics and Infrastructure
- Seasonality Analysis
- United Arab Emirates
- Production Analysis (Area Harvested, Yield, and Production Volume)
- Consumption Analysis (Consumption Value and Volume)
- Import Market Analysis (Import Value, Volume, and Key Supplying Markets)
- Export Market Analysis (Export Value, Volume, and Key Destination Markets)
- Wholesale Price Trend Analysis and Forecast
- Regulatory Framework
- List of Key Players
- Logistics and Infrastructure
- Seasonality Analysis
- Turkey
- Production Analysis (Area Harvested, Yield, and Production Volume)
- Consumption Analysis (Consumption Value and Volume)
- Import Market Analysis (Import Value, Volume, and Key Supplying Markets)
- Export Market Analysis (Export Value, Volume, and Key Destination Markets)
- Wholesale Price Trend Analysis and Forecast
- Regulatory Framework
- List of Key Players
- Logistics and Infrastructure
- Seasonality Analysis
- Saudi Arabia
- Africa
- South Africa
- Production Analysis (Area Harvested, Yield, and Production Volume)
- Consumption Analysis (Consumption Value and Volume)
- Import Market Analysis (Import Value, Volume, and Key Supplying Markets)
- Export Market Analysis (Export Value, Volume, and Key Destination Markets)
- Wholesale Price Trend Analysis and Forecast
- Regulatory Framework
- List of Key Players
- Logistics and Infrastructure
- Seasonality Analysis
- Egypt
- Production Analysis (Area Harvested, Yield, and Production Volume)
- Consumption Analysis (Consumption Value and Volume)
- Import Market Analysis (Import Value, Volume, and Key Supplying Markets)
- Export Market Analysis (Export Value, Volume, and Key Destination Markets)
- Wholesale Price Trend Analysis and Forecast
- Regulatory Framework
- List of Key Players
- Logistics and Infrastructure
- Seasonality Analysis
- Ethiopia
- Production Analysis (Area Harvested, Yield, and Production Volume)
- Consumption Analysis (Consumption Value and Volume)
- Import Market Analysis (Import Value, Volume, and Key Supplying Markets)
- Export Market Analysis (Export Value, Volume, and Key Destination Markets)
- Wholesale Price Trend Analysis and Forecast
- Regulatory Framework
- List of Key Players
- Logistics and Infrastructure
- Seasonality Analysis
- South Africa
- North America
Data Sources, Market Sizing, and Validation
Desk Research
Desk work starts with building a clean fact base on supply, trade, and pricing so our model has the right anchors before any forecasting is applied. We mainly rely on public datasets such as FAOSTAT for crop production and yield trends, UN Comtrade for import and export values and volumes, USDA and national agriculture ministries for acreage and crop outlook updates, and IMF or World Bank series for macro inputs like inflation and exchange rates.
To connect country data to market value, we also review wholesale and farmgate price references published by agriculture departments, customs bulletins, and port or trade statistics agencies. Where available, we triangulate the climate and yield context using peer reviewed papers on pulses and agronomy. Company filings and investor materials from large handlers and processors are used only as directional checks on procurement patterns and end market demand. In a few places, paid subscriptions that aggregate company financials, patent activity, and shipment-level trade records were used to speed up cross-checks and spot outliers. These sources are illustrative, and many other public and industry references were also consulted for data collection, validation, and clarification.
Primary Interviews and Surveys
Primary work is used to pressure test the desk assumptions that typically move the total, especially pricing behavior, trade flows, and the share of volumes entering food versus feed channels. We spoke with growers, traders, importers, processors, and downstream buyers across major producing and consuming regions, then used follow-ups to close gaps where secondary data was dated or country reporting looked inconsistent.
Distribution of primary research fieldwork respondents
| Company type | Respondent position | Region |
|---|---|---|
| Top tier: 28% | CXOs: 15% | APAC: 44% |
| Mid tier: 51% | Functional/Unit leaders: 41% | EMEA: 34% |
| Smaller Players: 21% | Managers: 44% | Americas: 22% |
Market-Sizing & Forecasting
Sizing is built using top-down logic where country production, net trade, and stock movement signals are reconstructed into an implied availability pool, which is then translated into value using observed wholesale price trends and currency timing. To make sure we are not overcounting, the model is kept consistent in units first (metric tons by country), and only then converted to USD value once the price layer is applied.
The main inputs include harvested area and yield shifts, import and export volumes by origin and destination, wholesale price direction for Kabuli and Desi grades, freight and logistics friction that affects landed costs, and demand pulls from plant-based eating and ingredient substitution that buyers discussed in interviews. Where data gaps show up, for example weaker reporting on informal trade or smallholder flows, we apply conservative proxies based on neighboring trade corridors and then recheck the results with expert feedback.
For forecasting, scenario analysis is used because weather risk, planting decisions, and trade policy can move supply and prices quickly, and a single straight-line method can miss these swings. The base case is built from consensus expectations on acreage, yield normalization, and price softening or tightening, and then adjusted using selective bottom-up checks such as sampled price per ton multiplied by traded volumes for key corridors, plus sanity checks against reported procurement trends.
Data Validation & Update Cycle
Validation is done in steps so that errors are caught early and assumptions are not carried forward blindly. We compare totals against independent signals such as production and yield releases, trade unit values, and price behavior, then investigate any large variance at the country level before the model is signed off.
If a major event occurs, like a sharp crop shortfall, export restrictions, or a sudden freight disruption, the assumptions are revisited and the most sensitive parts of the model are recalculated. Reports are refreshed annually, and before delivery an analyst performs a final pass to ensure the latest publicly available data and interview learnings are reflected.
Mordor Intelligence's Chickpea Market Size Compared Against Other Published Estimates
Published chickpea market values can vary even when they are talking about the same crop, because the chosen base year, price reference, and boundary between raw chickpeas and processed products are not always aligned. Differences also show up when some estimates lean more on trend extrapolation, while others anchor the model to physical volumes and trade flows.
Trade unit values from customs data, along with country production and wholesale price trend checks, are the main evidence that keeps Mordor Intelligence's 2026 estimate tied to measurable chickpea movement rather than mixed processed-food revenues. When another publisher uses a different base year (like 2024 or 2025) and blends in higher priced retail categories, the total can look larger even if underlying tonnage is similar.
Benchmark comparison
| Source | Market Size | Gaps in Research Methodology |
|---|---|---|
| Mordor Intelligence | USD 12.92 B (2026) | |
| Global Consultancy A | USD 15.96 B (2024) | Uses an earlier base year and appears to apply broader end-use and form coverage that can pull in packaged or processed channel value, which raises the reported market total versus a crop and trade anchored build. |
| Industry Publisher B | USD 14.62 B (2025) | Base year timing and pricing layer can differ because the estimate is presented as a single global value without clear links to trade-volume reconciliation, so currency timing and grade-level price spread may be handled more loosely. |
Looking across the figures, most of the spread comes from what is counted as chickpeas versus downstream products, and from which year and price reference is used to convert tons into USD. Our approach stays traceable because the value line is built after the volume picture is made consistent across production, imports, and exports, and then it is cross-checked with interview feedback on pricing and trade behavior.


Key Questions Answered in the Report
How big is the chickpea market size in 2026?
The chickpea market size reached USD 12.92 billion in 2026.
What is the forecast growth rate through 2031?
The market is projected to expand at a 5.92% CAGR between 2026 and 2031.
Which region leads global consumption?
Asia-Pacific accounts for 35.5% of global consumption, driven by India and China.
Which region will grow the fastest?
Africa is forecast to post a fastest 6.91% CAGR through 2031.
What are the main restraints to growth?
Drought-linked yield volatility, mycotoxin contamination, synthetic protein price competition, and port logistics bottlenecks pose the key challenges.
Page last updated on:


 Your data is secure and never sold or shared.


