
Chicago Data Center Market Size and Share
Market Overview
| Study Period | 2020 - 2031 |
|---|---|
| Forecast Data Period | 2026 - 2031 |
| Base Year Market Size (2025) | 1.9 gigawatt |
| Market Volume (2026) | 2.03 gigawatt |
| Market Volume (2031) | 2.81 gigawatt |
| Growth Rate (2026 - 2031) | 6.73% CAGR |
| Market Concentration | Medium |
Major Players *Disclaimer: Major Players sorted in no particular order Image © Mordor Intelligence. Reuse requires attribution under CC BY 4.0. | |
Chicago Data Center Market Analysis by Mordor Intelligence
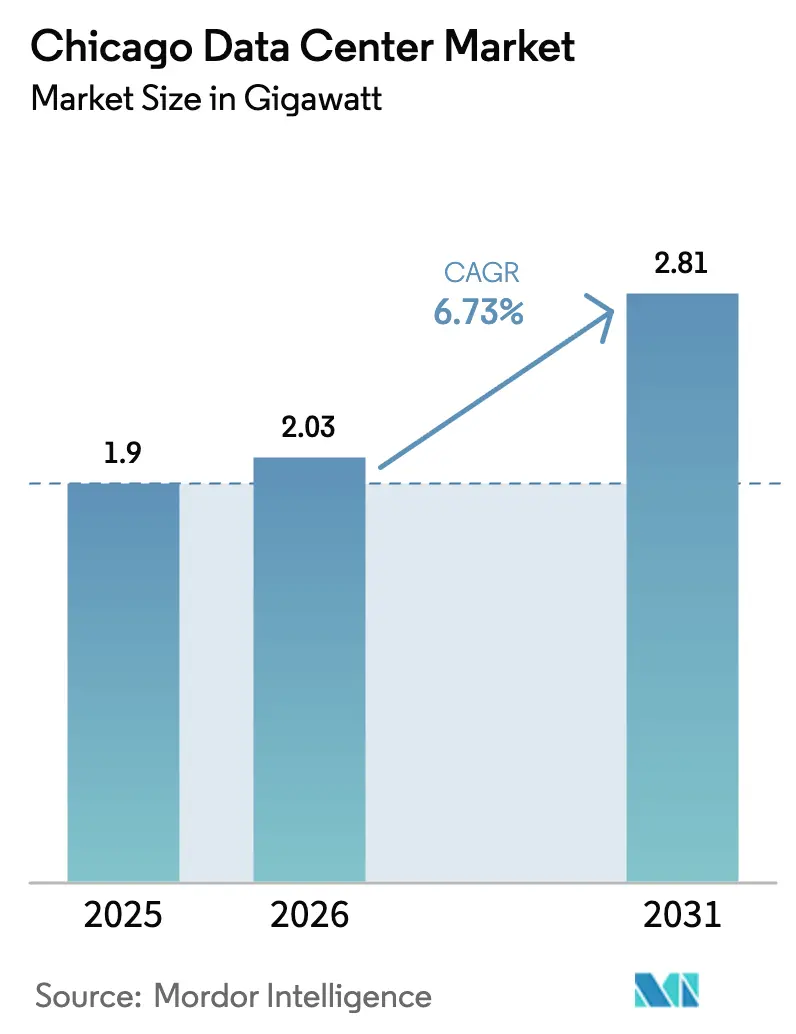
The Chicago data center market size is expected to grow from 1.9 GW in 2025 to 2.03 GW in 2026 and is forecast to reach 2.81 GW by 2031 at 6.73% CAGR over 2026-2031. Vacancy sits at a record‐low 1.9%, while average rental rates climbed 33% year-over-year, underscoring an acute supply–demand imbalance cbre.com. Illinois’ sales-tax exemption on qualified equipment and its 6.9 c/kWh industrial power tariff have drawn more than USD 11 billion in new build commitments since 2019 illinois.gov. Power planners expect data-center load on ComEd’s grid to jump from roughly 400 MW today to nearly 5 GW, equal to the output of five nuclear units. Tight power and land conditions in Northern Virginia are also steering hyperscale spill-over demand toward Chicago, lifting the city to the nation’s third-largest hub
Key Report Takeaways
- By data-center size, Massive facilities led with 44.12% of Chicago data center market share in 2025, whereas the Mega category is forecast to advance at a 7.72% CAGR through 2031.
- By tier, Tier 3 captured 58.02% of Chicago data center market share in 2025; Tier 4 is set to post the fastest CAGR at 8.21% through 2031.
- By service model, colocation accounted for 49.05% of Chicago data center market size in 2025, but cloud-service providers are projected to grow at 9.07% CAGR to 2031.
Note: Market size and forecast figures in this report are generated using Mordor Intelligence’s proprietary estimation framework, updated with the latest available data and insights as of 2026.
Chicago Data Center Market Trends and Insights
Drivers Impact Analysis*
| Driver | ( ~ ) % Impact on CAGR Forecast | Geographic Relevance | Impact Timeline |
|---|---|---|---|
| Surging cloud-service-provider demand | +1.8% | Global, focused on Chicago metro | Medium term (2-4 years) |
| Growing enterprise edge-computing needs | +1.2% | Chicago metro and suburbs | Long term (≥ 4 years) |
| Robust fiber-connectivity ecosystem | +0.9% | Chicago core, O’Hare corridor | Short term (≤ 2 years) |
| Incentive programs and Illinois tax benefits | +1.5% | Illinois statewide | Medium term (2-4 years) |
| Northern Virginia spill-over demand | +0.8% | Chicago region | Short term (≤ 2 years) |
| AI training workloads seeking Midwest power | +1.3% | Chicago and rural Illinois | Long term (≥ 4 years) |
| Source: Mordor Intelligence | |||
Surging Cloud-Service-Provider Demand
Hyperscale operators are accelerating footprint expansion as premier coastal markets hit power ceilings.[1]Joel Hruska, “Hyperscalers Seek Alternatives to Ashburn,” commercialobserver.com Amazon’s USD 20 billion program for nuclear-backed campuses in the Mid-Atlantic signals a readiness to diversify locations, enabling Chicago to draw similar mega-projects. Microsoft and BlackRock’s USD 30 billion AI-infrastructure alliance has earmarked Midwest parcels, while Equinix’s USD 15 billion xScale venture identifies Chicago as an early launch point. Financial-market latency needs further amplify demand; CME Group’s private Google Cloud region in Aurora exemplifies this enterprise pull.
Growing Enterprise Edge-Computing Needs
A USD 232 billion global edge-market in 2024 is reshaping site requirements for Chicago’s manufacturers, retailers and financial firms.[2]Jonathan Vanian, “AWS Pivots to Nuclear Power for New U.S. Campuses,” cnbc.com CoreSite’s CH2 earned NVIDIA DGX-Ready status, reinforcing the metro’s suitability for AI inference clusters. Telecommunications carriers such as Comcast anchor Northlake facilities to support 5G, content-delivery networks and low-latency over-the-top workloads.
Robust Fiber-Connectivity Ecosystem
DE-CIX Chicago is the fastest-growing exchange in Illinois, interlinking with New York and Dallas to form North America’s largest peering fabric.[3]Jonathan Vanian, “AWS Pivots to Nuclear Power for New U.S. Campuses,” cnbc.com Digital Realty’s 350 E. Cermak site hosts 40+ carriers and surpasses 100 MW in load, benefiting from the metro’s dense backhaul routes. United IX offers 10 G–100 G ports and aggregates major CDN traffic, amplifying network effects that attract incremental investment.
Incentive Programs and Illinois Tax Benefits
The 2019 data-center sales-tax statute grants 10.25% exemptions on qualifying gear for projects investing ≥ USD 250 million and hiring at least 20 staff paid 120% of county averages. The policy helped double statewide private-sector capital inflows to USD 12.5 billion in 2024, with data-center projects capturing a substantial share. CyrusOne’s USD 350 million Aurora build broke ground alongside gubernatorial support, illustrating streamlined permitting gains.
Restraints Impact Analysis*
| Restraint | ( ~ ) % Impact on CAGR Forecast | Geographic Relevance | Impact Timeline |
|---|---|---|---|
| Rising power costs (ComEd territory) | -0.7% | Chicago metro | Short term (≤ 2 years) |
| Escalating land and construction costs | -1.1% | Chicago metro and suburbs | Medium term (2-4 years) |
| Cooling constraints from Lake Michigan water rules | -0.5% | Lake Michigan watershed | Long term (≥ 4 years) |
| Lengthy grid-interconnection cycles | -0.9% | Illinois, PJM area | Medium term (2-4 years) |
| Source: Mordor Intelligence | |||
Rising Power Costs (ComEd Territory)
Projected monthly customer bills could climb USD 10.50 as data-center demand raises grid-balancing charges. PJM auction-clearing prices have risen, forcing operators to hedge higher capacity costs. Lawmakers are studying safeguards to prevent hyperscale strain on legacy infrastructure and to protect ratepayers.
Escalating Land and Construction Costs
Building out a hyperscale box now averages USD 561.33 / sq ft, an increase of 20.53% since 2019. Land near O’Hare tops USD 224,000 per acre, pushing developers toward Elk Grove, Northlake and further west cbre.com. Procuring dedicated substations and extra-high-voltage feeds adds millions to capital budgets and can extend project schedules by multiple quarters.
*Our forecasts treat driver/restraint impacts as directional, not additive. The impact forecasts reflect baseline growth, mix effects, and variable interactions.
Segment Analysis
By Data-Center Size: Mega Facilities Drive Hyperscale Expansion
Massive footprints delivered 44.12% share of Chicago data center market in 2025, reflecting a matured ecosystem supporting financial-services and legacy workloads. However, Mega campuses are set to outpace every other category at a 7.72% CAGR through 2031 as AI training clusters hunt for blocks of contiguous power above 100 MW. T5’s 480 MW suburban campus and Compass’ five-building redevelopment of the former Sears HQ evidence this pivot, each engineered for ≥ 50 kW per rack densities.
Small and medium halls remain viable for edge and enterprise hybrids but face gradual absorption into larger wholesale footprints. Hyperscale tenants favor the operating leverage and custom mechanical-electrical topologies available in Mega builds, pressuring owners of smaller suites to differentiate via latency-critical or specialty compliance offerings.


By Tier Type: Tier 4 Adoption Accelerates for Mission-Critical Applications
Tier 3 facilities held 58.02% share of Chicago data center market size in 2025 as they delivered a pragmatic uptime-cost balance sought by most enterprises. Financial and healthcare users, however, are steering fresh demand toward Tier 4 platforms that promise fault tolerance and 99.995% availability, helping the class achieve an 8.21% CAGR to 2031.
Operators are layering in concurrently maintainable electrical paths and waterless cooling to satisfy the SLA premiums commanded by regulated workloads. NTT’s CH1, Forsythe’s Elk Grove site and new speculative shells all tout Uptime Institute certifications that validate Tier 4 attributes, positioning Chicago to capture regulated-industry expansions that require deterministic availability.
By Data-Center Type: Cloud Service Providers Accelerate Market Transformation
Colocation retained 49.05% share in 2025, supported by near-zero vacancy and a 33% rent uplift, but cloud-service providers represent the fastest needle-mover, expanding at 9.07% CAGR through 2031 as hyperscalers roll out dedicated zones for AI workloads.
Wholesale shells and powered-base-build formats enjoy the tightest pricing power because they solve both capacity and speed-to-market constraints. Retail colo continues to serve SMB tenants, while modular and edge boxes target 5G, content caching and disaster-recovery niches. Equinix’s USD 2.225 billion Q1 2025 revenue and upwardly revised annual guide underline the earnings upside tied to this migration wave.

Geography Analysis
Chicago anchors the Midwest’s most mature cloud and network node, housing 154 active data centers that support 20,000 jobs and USD 3.5 billion in labor income. The Chicago data center market size leadership is reinforced by low seismic risk, abundant nuclear-derived electricity and a central location ensuring sub-20 ms round-trip latency to both coasts. Illinois hosts 126 facilities run by 68 providers and has another USD 1.7 billion in construction under way across six announced builds.
Demand displaced from Northern Virginia is landing in Chicago as Dominion Energy transmission bottlenecks defer new hook-ups until 2027. Operators pursuing concurrent capacity, therefore, favor PJM-connected Illinois, where ComEd can allocate grid import rights faster. At the same time, land and power fundamentals in suburban Columbus drive a multi-city Midwestern corridor that bolsters Chicago’s role as a core peering anchor. Within metro Chicago, Elk Grove Village, Northlake and Aurora form the most active development triangle. T5, CyrusOne and Compass collectively plan over 1 GW in these suburbs, exploiting available land parcels and 138 kV feeds. Downtown, Digital Realty’s planned 12-story tower at 330 E. Cermak shows densification via vertical builds as legacy lots reach saturation
Regulatory Landscape
Illinois policy has been a major siting lever through the state sales-and-use-tax exemption for qualifying data center equipment (10.25% for projects investing at least USD 250 million and meeting hiring and wage thresholds). The incentive backdrop shifted as Governor JB Pritzker paused new data center tax incentives effective July 1, 2026. At the same time, proposed state-level legislation, including the POWER Act introduced in February 2026, has raised attention on operational externalities such as water reporting and renewable energy sourcing, reflecting increased scrutiny tied to rapid load growth on the ComEd grid.
At the municipal level, development approvals and permit administration in the City of Chicago are becoming more consequential for delivery schedules and entitlement risk. In July 2026, the City of Chicago issued a Sustainable Data Centers Report that frames sustainability and resource reporting expectations for the sector. Local actions such as the July 2026 voiding of QTS expansion permits due to extended inactivity also show how project phasing and permitting timelines can affect build programs. Industry, labor, and environmental stakeholders have been engaged in ongoing negotiations around data center policy proposals ahead of the 2026 fall veto session, adding another decision point for developers planning multi-year campus pipelines in the metro.
Value Chain Analysis
The Chicago data center value chain begins with site and power origination, where developers and operators secure land, zoning, and interconnection in utility territories led by ComEd. Power availability and transmission congestion shape where projects cluster, reinforcing the suburban development arc while keeping high-density infill viable when grid and network access align. On the network side, carrier hotels and interconnection ecosystems anchored by 350 E. Cermak support cloud on-ramps, peering, and low-latency financial connectivity, which then influences tenant demand for high-availability colocation and wholesale capacity.
Design, construction, and equipment procurement are the next critical links, involving general contractors, commissioning, and long-lead electrical and mechanical systems. Supply chain exposure is concentrated in medium-voltage electrical gear (including transformers and switchgear), where single-source dependencies and raw-material price volatility, notably copper and electrical steel, can extend lead times and widen capex variance. Operators monetize downstream through retail and wholesale colocation, hyperscale and powered shell deployments, and managed connectivity, supported by expansion pipelines such as QTS receiving initial approval for a USD 300 million campus expansion and CyrusOne filing for a nine-building campus in Yorkville planned over a multi-decade horizon.
Competitive Landscape
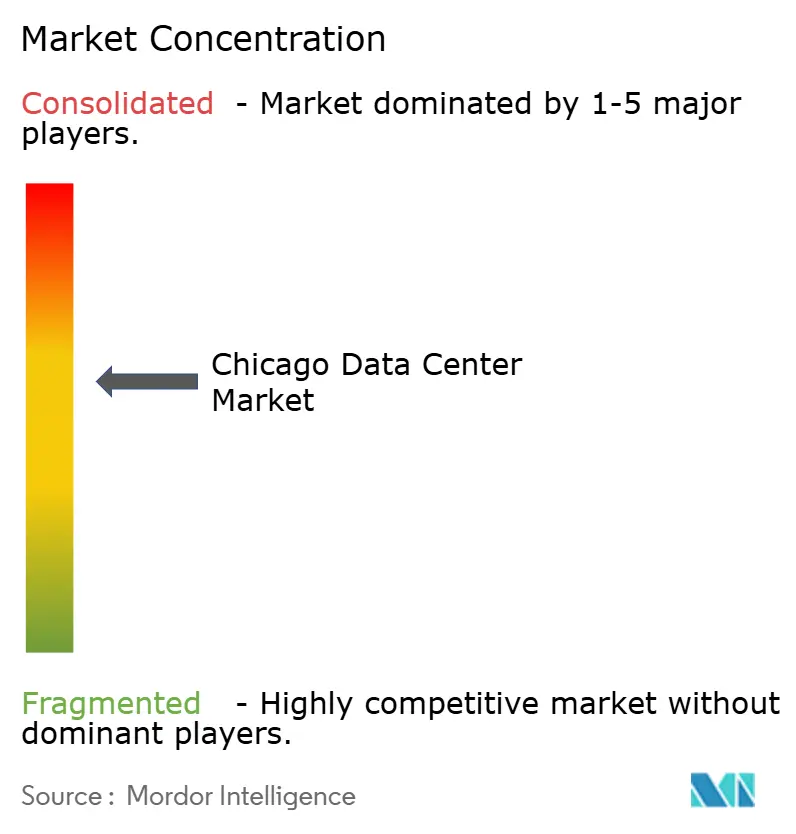
Digital Realty, Equinix and CoreSite maintain the largest installed bases, but aggressive greenfield programs by T5 Data Centers, Compass Datacenters and CyrusOne are diluting share, pointing to moderate concentration. Digital Realty’s 350 E. Cermak—spanning 1.1 million sq ft—hosts 70+ carriers and remains Illinois’ top-load customer at > 100 MW. Equinix is channeling USD 15 billion into U.S. xScale campuses; Chicago ranks among the first four locations, reflecting its hyperscale pull.
Hardware and power-train partnerships differentiate entrants. Siemens will supply Compass’ medium-voltage skids under a multi-year pact, shaving months off electrical deployment cycles. Meanwhile, Microsoft’s zero-water cooling pilots in neighboring Wisconsin could migrate to its Minooka, Illinois blueprint, signaling sustainability as a competitive lever.
Record MandA further shapes the field. Vantage raised USD 9.2 billion in January 2025, CBRE bought Direct Line Global for white-space services and Schneider acquired Motivair for liquid-cooling IP, stressing the strategic value of turnkey delivery and advanced thermal solutions.
Chicago Data Center Industry Leaders
Digital Realty Trust, Inc.
Equinix Inc.
CyrusOne
Quality Technology Services Holding LLC (QTS)
Stack Infrastructure, Inc.
- *Disclaimer: Major Players sorted in no particular order

Market Opportunities and Future Outlook
With installed capacity at 2.03 GW in 2026 and record-low vacancy cited in the market context, the most immediate whitespace centers on speed-to-power delivery and configurations that reduce time-to-energization for large blocks of load. Chicago also differentiates as a connectivity and financial-market hub, supported by dense interconnection assets, including the 350 E. Cermak carrier ecosystem, and demand tied to the derivatives and trading ecosystem around CME Group. That demand supports resilient, low-latency deployments and disaster recovery architectures.
A second opportunity area is aligning new builds with sustainability and reporting expectations now surfacing in public policy discussions and city-level framing, including the City of Chicago Sustainable Data Centers Report (July 2026) and state legislative proposals such as the POWER Act. This policy environment creates room for operators and suppliers that can document water use, implement lower-water cooling approaches, and structure renewable energy sourcing and community-benefits approaches that fit within permitting and stakeholder engagement processes. At the same time, campus-scale planning continues, including the QTS expansion pathway and CyrusOne’s Yorkville filing, supporting ecosystem opportunities for power-delivery equipment, commissioning, and network services that reduce delivery risk amid long interconnection cycles and constrained long-lead electrical supply.
Recent Industry Developments
- February 2026: Equinix migrates CME Group US Common disaster recovery data-center infrastructure to CH3 facility in Elk Grove, Illinois. The migration supports high availability for financial services interconnection and strengthens Chicago as a disaster recovery hub for major exchange operators. The move also differentiates the provider through enhanced reliability upgrades.
- November 2025: CyrusOne installed additional redundant cooling capacity at Aurora, Illinois data center after prior cooling failure. The upgrade improves cooling redundancy for Chicago-area data centers and increases resilience for a key provider in a peak-demand market. It also supports continued expansion in the market.
- May 2025: CyrusOne completed structural framework of an 18MW data center in Wood Dale, Illinois (part of planned campus expansion). The expansion adds capacity aligned with rising demand and reinforces Chicago as a strategic hyperscale corridor for the region.


Research Methodology Framework and Report Scope
Market Definition and Coverage
This market covers the demand and supply of data center capacity in the Chicago metro area, tracked through operational and commissioned IT load and the related infrastructure that supports colocation and self-built facilities.
Scope exclusions: It excludes pure telecom central offices, office-only managed services revenue, and standalone cloud software that does not require Chicago-based data center capacity.
Segmentation Overview
- By Data Center Size
- Small
- Medium
- Large
- Massive
- Mega
- By Tier Type
- Tier 1 and 2
- Tier 3
- Tier 4
- By Data Center Type
- Cloud Service Providers (CSPs)
- Enterprise, Modular and Edge
- Colocation
- Utilized
- Colocation Type
- Retail
- Wholesale
- Hyperscale
- End User
- Cloud and IT
- Telecom
- Media and Entertainment
- Government
- BFSI
- Manufacturing
- E-Commerce
- Other End User
- Colocation Type
- Utilized
Data Sources, Market Sizing, and Validation
Desk Research
Desk research was used to set the local context first, and then to ground the market model in measurable signals like power, construction, and occupancy. We referred to public datasets and publications such as US Census Bureau Business Patterns, US Bureau of Labor Statistics industry employment series, US Energy Information Administration power price data, DOE and ENERGY STAR technical references, and state level economic development releases from Illinois.
To translate infrastructure buildout into realistic capacity additions, we also reviewed sources such as utility and grid planning documents, zoning and permitting notes where available, and reputable commercial real estate research commentary that provides snapshots on vacancy and pricing. Company filings, investor presentations, and press releases were used to validate commissioning timelines and expansion announcements, and a paid subscription for company financials and a patent database were used selectively to cross-check operator footprints and technology shifts. These examples are illustrative only, and many other sources were also used for data collection, validation, and research clarification.
Primary Interviews and Surveys
Primary work focused on validating what is actually getting built and absorbed in Chicago, and what constraints are slowing projects down. We spoke with a mix of operators, contractors, power and cooling ecosystem participants, and enterprise and wholesale buyers across the Americas, and then used their inputs to refine utilization, pricing progression, and commissioning assumptions.
Distribution of primary research fieldwork respondents
| Company type | Respondent position | Region |
|---|---|---|
| Top tier: 25% | CXOs: 15% | APAC: 48% |
| Mid tier: 60% | Functional/Unit leaders: 26% | EMEA: 33% |
| Smaller Players: 15% | Managers: 59% | Americas: 19% |
Market-Sizing & Forecasting
Sizing starts with a top-down build that reconstructs Chicago capacity using known operational load, committed expansions, and expected commissioning over the forecast window, which are then converted into market totals in consistent units. The outcome is corroborated with selective bottom-up checks like sampled rack density and MW-to-square-foot norms, channel feedback on leased versus available capacity, and sanity checks against a short list of operator footprint rollups where disclosures exist.
Key inputs include live and pipeline IT load (MW or GW), vacancy and pre-lease behavior, construction lead times, utility power availability and connection timelines, and pricing movement for retail and wholesale colocation. When a data point is missing for smaller facilities, we use peer facility proxies in the same corridor and apply conservative utilization and ramp-up curves, followed by another check with interview feedback.
For forecasting, scenario analysis is used because the biggest swing factors are permitting and power delivery timing, along with enterprise versus hyperscale demand mix. Assumptions for absorption pace and price progression are aligned to primary feedback and then stress-tested against visible constraints and announced project schedules.
Data Validation & Update Cycle
Validation is done through a practical triangulation step, where the modeled capacity additions and utilization are compared against independent signals like announced commissioning dates, utility load discussions, and observed vacancy direction. Outliers are flagged for re-checking, and when a variance cannot be explained, we re-contact sources or revisit the relevant assumptions before internal review sign-off.
Reports are refreshed annually, and interim updates are triggered if there is a material change like a large project delay, a new power constraint, or a meaningful shift in leasing conditions. Before delivery, an analyst performs a final pass to ensure the latest public releases and primary learnings are reflected in the numbers.
Mordor Intelligence's Chicago Data Center Market Size Measured Against Other Published Estimates
Published numbers for Chicago data centers can look far apart because each publisher converts the same real-world buildout into market size using different units, boundaries, and time cutoffs. In practice, the biggest differences come from what is counted as the market, how capacity is translated into value, and whether pipeline projects are treated as committed or optional.
Some external figures bundle broader digital-economy activity like data processing and hosting GDP for the region, which naturally inflates the apparent market size. In Mordor Intelligence, the count is limited to data center capacity and its related services within the Chicago metro area, with volumes tracked in IT load (GW) and totals checked against commissioning and utilization signals.
Benchmark comparison
| Source | Market Size | Gaps in Research Methodology |
|---|---|---|
| Mordor Intelligence | USD 1.90 B (2025) | |
| Regional Economic Group A | USD 7.12 B (2023) | Uses a NAICS 518210 style economic output measure (data processing and hosting) that is inclusive of adjacent services beyond data center capacity, so it is not directly comparable to an IT-load-driven market view. |
| Real Estate Briefing B | USD 2.30 B (2024) | Often anchors on current leasing momentum and pricing snapshots, and may apply a faster ASP uplift or assume higher stabilized utilization without separately checking power delivery timing and phased commissioning. |
The spread across sources mainly comes from scope and conversion logic, not from disagreements that Chicago is growing. By keeping the steps tied to capacity additions, utilization ramp, and pricing checks, our estimate stays traceable to inputs that can be re-tested as new projects and power availability data come in.


Key Questions Answered in the Report
What is the projected growth of the Chicago data center market through 2031?
The installed base is forecast to grow from 2.03 GW in 2026 to 2.81 GW by 2031, a 6.73% CAGR.
The installed base is forecast to grow from 2.03 GW in 2026 to 2.81 GW by 2031, a 6.73% CAGR.
Chicago offers available power, lower land prices and robust tax incentives at a time when Northern Virginia faces grid bottlenecks and community pushback.
How much tax relief can qualifying operators capture in Illinois?
Projects investing at least USD 250 million and hiring 20 staff can secure a 10.25% sales-and-use-tax exemption on data-center equipment.
Which data-center size segment is expanding the fastest?
Mega campuses built for AI and hyperscale workloads are projected to grow at 7.72% CAGR through 2031.
What are the main cost headwinds for new builds in Chicago?
Escalating construction materials now average USD 561.33 / sq ft, and rising grid-capacity charges are pushing ComEd customer bills up by around USD 10.50 per month.
How concentrated is market leadership today?
The top five operators hold just over 60% of installed power, giving the market a moderate concentration score of 6 while leaving room for new entrants equipped with capital and differentiated technology.
Page last updated on:






