
Chestnuts Market Size and Share
Chestnuts Market Analysis by Mordor Intelligence
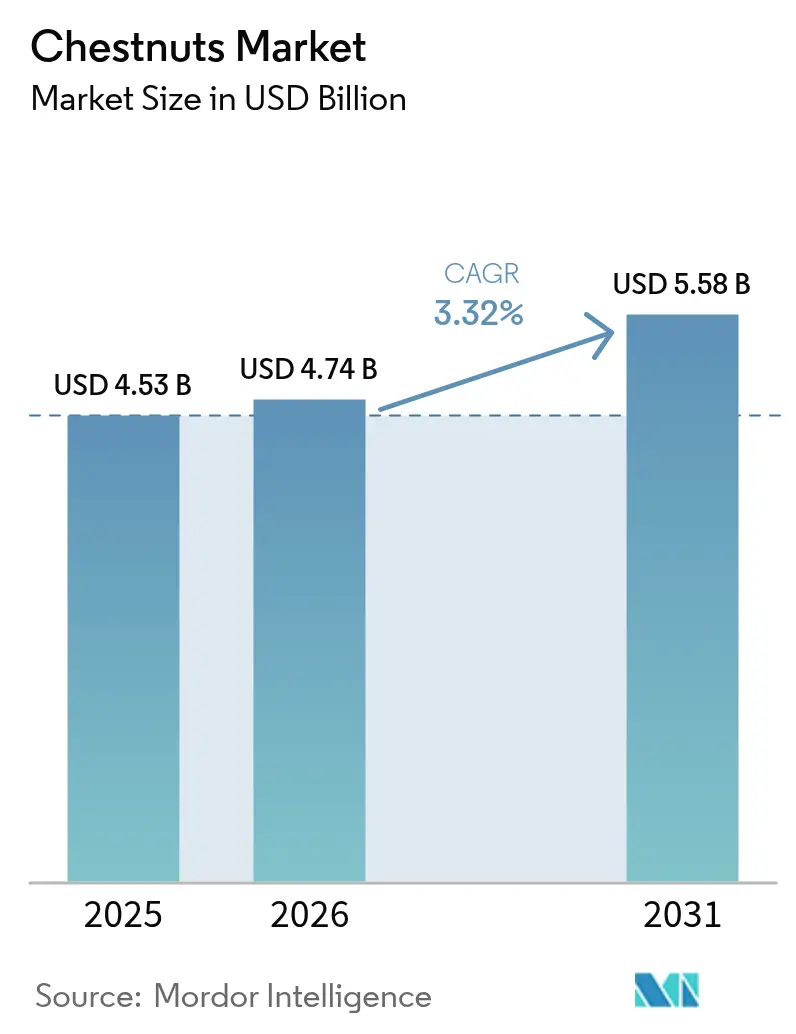
The chestnuts market size is projected to grow from USD 4.53 billion in 2025 to USD 4.74 billion in 2026 and is forecast to reach USD 5.58 billion by 2031 at a 3.32% CAGR over 2026-2031. Demand is expanding as health-conscious consumers pivot to gluten-free nut proteins, processors integrate chestnut purées into plant-based confectionery, and orchard owners monetize carbon credits from long-lived trees. Asia-Pacific growers are using ultra-low-oxygen storage to cut post-harvest losses, while North American farms are scaling quickly on the back of government agroforestry incentives. Competitive intensity now differs sharply across the value chain. China dominates raw production, Europe leads premium processing, and South Korean exporters leverage automation to penetrate high-margin snack channels. At the same time, stricter phytosanitary rules and climate-driven chill-hour deficits in Southern Europe threaten supply stability, sharpening the focus on automation, biological pest control, and climate-resilient chestnut hybrids.
Key Report Takeaways
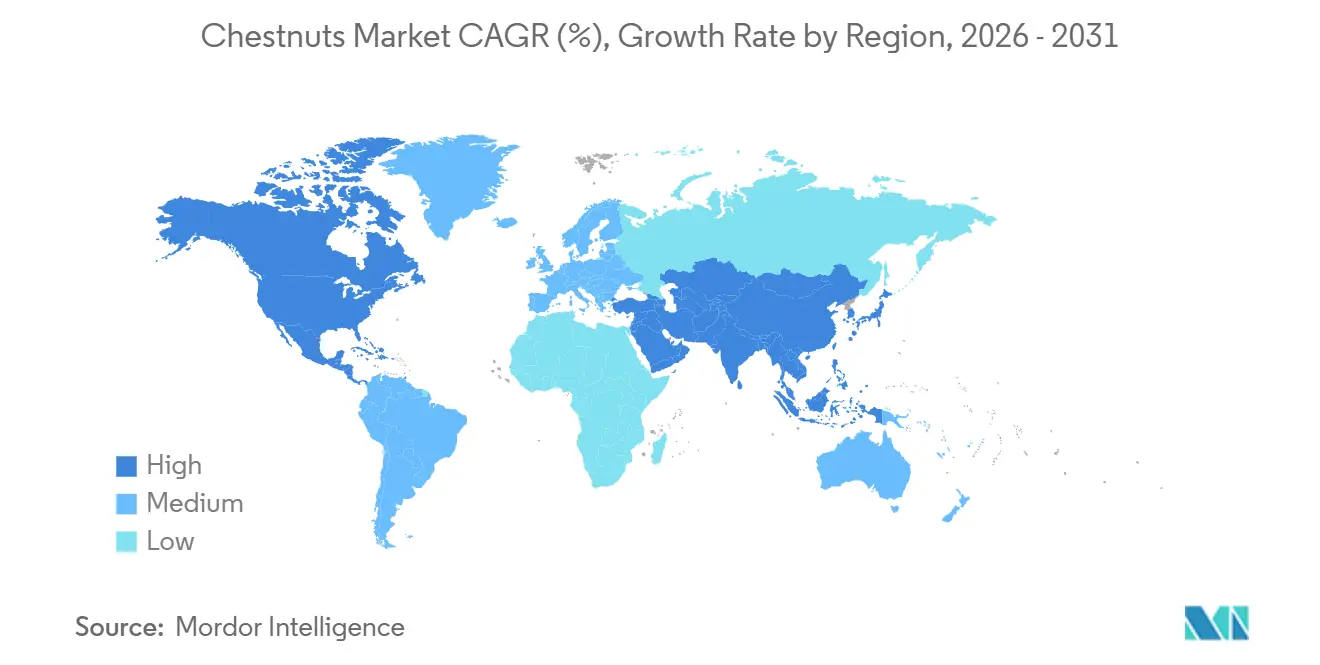
- By geography, Asia-Pacific accounted for 78.2% of the chestnut market share in 2025, while North America is forecast to record the fastest regional growth, advancing at a 6.5% CAGR through 2031.
Note: Market size and forecast figures in this report are generated using Mordor Intelligence’s proprietary estimation framework, updated with the latest available data and insights as of 2026.
Global Chestnuts Market Trends and Insights
Drivers Impact Analysis*
| Driver | (~) % Impact on CAGR Forecast | Geographic Relevance | Impact Timeline |
|---|---|---|---|
| Health-centric shift toward gluten-free nut proteins | +0.8% | North America and Europe with spillover to urban Asia-Pacific | Medium term (2-4 years) |
| Culinary move to plant-based confectionery fillings | +0.7% | Global, concentrated in North America and Western Europe | Short term (≤ 2 years) |
| Government agro-forestry subsidies | +0.5% | United Kingdom and United States plus European Union member states | Long term (≥ 4 years) |
| Carbon-credit monetization of orchards | +0.4% | European Union, early adoption in United Kingdom and selected United States states | Long term (≥ 4 years) |
| Rapid expansion of organic chestnut acreage | +0.3% | Italy, France, Spain and North America | Medium term (2-4 years) |
| Ultra-low-oxygen storage slashing post-harvest loss | +0.6% | Asia-Pacific and Europe with global diffusion | Short term (≤ 2 years) |
| Source: Mordor Intelligence | |||
Health-Centric Shift Toward Gluten-Free Nut Proteins
Chestnuts contain 37-45% starch, only 2-3% fat, and around 8.1 grams of fiber per 100 grams, a profile that appeals to celiac-friendly bakery chains and vegan protein blenders. A 2024 producer survey showed that 70% of United States growers experienced stronger demand, and half were unable to meet all orders. Cornell AgriTech (Cornell College of Agriculture and Life Sciences) moved chestnut milk and flour from pilot-scale to retail placement, signaling a pathway beyond traditional roasting [1]Source: Cornell College of Agriculture and Life Sciences, “Cornell AgriTech helping grow New York’s tree nut industry,” cals.cornell.edu. The emerging protein-isolate niche offers an allergen-free alternative to soy and pea concentrates, with early trials indicating functional equivalence in plant-based meat analogs. Together, these factors lift premium pricing power and sustain double-digit growth in the chestnut market.
Culinary Move to Plant-Based Confectionery Fillings
Processors swap dairy ganache and nut butters for chestnut purées to meet clean-label rules and lower saturated-fat content. In December 2025 the United Kingdom brand “This” launched a chestnut, mushroom and caramelized onion roast at a major supermarket chain for GBP 7.50 (USD 9.50), illustrating mainstream uptake. Thailand’s mid-priced nut segment, where chestnuts retail at THB 350-850 (USD 10-24), captured 25% of total tree-nut consumption in 2025, largely because bakeries substituted almond paste with chestnut purée. Similar replacement trends in Japan and South Korea lifted export sales for vertically integrated firms such as Bamtrae Farming Association. Rising use in fillings, spreads and latte mixes strengthens recurring demand curves inside the chestnut market.
Government Agro-Forestry Subsidies
Public programs lower the entry barrier for new orchards. The United Kingdom Countryside Stewardship scheme pays GBP 17.83 (USD 22) per tree, while the United States Department of Agriculture allocated USD 60 million for agro-forestry in 2024, including funding chestnut trials and extension services[2]Source: United States Department of Agriculture, “Agroforestry grant allocation,” usda.gov. Demonstration festivals in Missouri display gross-margin potential, and the Chestnut Improvement Network uses distributed breeding plots to de-risk cultivar selection across the central and northern United States. These incentives underpin acreage expansion and broaden the geographic footprint of the chestnut market.
Carbon-Credit Monetization of Orchards
Under the European Union carbon-removal certification framework, orchard owners can earn credits by locking up carbon for at least 35 years. The CASTANI-CO project in Emilia-Romagna, Italy, estimated carbon gains and documented best practices, creating a blueprint for dual-revenue models that pair nut sales with ecosystem-service payments [3]Source: European Commission CAP Network, “The CASTANI-CO carbon sequestration project,” eu-cap-network.ec.europa.eu. Producers in Australia and selected United States states are trialing similar models, and early financial modeling suggests that carbon revenue can offset up to 10% of annual orchard management costs, adding resilience to the chestnut market.
Restraints Impact Analysis*
| Restraint | (~) % Impact on CAGR Forecast | Geographic Relevance | Impact Timeline |
|---|---|---|---|
| High manual de-burring costs | -0.5% | Italy, France, Spain and small-scale North American farms | Medium term (2-4 years) |
| Short fresh-market shelf life without chilling | -0.4% | Global, acute in tropical export corridors | Short term (≤ 2 years) |
| Climate-driven chill-hour deficits in Europe | -0.6% | Spain, Italy, Greece and wider Mediterranean basin | Long term (≥ 4 years) |
| Rising phytosanitary import barriers | -0.5% | North America, European Union, and Australia | Medium term (2-4 years) |
| Source: Mordor Intelligence | |||
High Manual De-Burring Costs
Removing the spiny cupule and inner pellicle from chestnuts remains labor-intensive, with manual processing costs exceeding USD 2 per kilogram in European operations where seasonal labor shortages drive hourly wages above EUR 15 (approximately USD 16). A prototype developed by Miller demonstrated fan-driven impact peeling at 150 kilograms per hour, requiring a fraction of the energy and capital of steam- or flame-based systems, yet commercial deployment stalled. Until automation penetrates the sub-500-tree farm segment that dominates Western production, labor costs will compress margins and limit fresh-market competitiveness against lower-cost Asian imports.
Short Fresh-Market Shelf Life Without Chilling
Chestnuts' high moisture content and active respiration accelerate spoilage, with mold and weight loss rendering unrefrigerated nuts unmarketable within 10-30 days of harvest. This constraint fragments export markets, as shipments to distant destinations require cold-chain infrastructure that adds USD 0.30-0.50 per kilogram in logistics costs and limits access to price-sensitive consumer segments. The gap is most acute in tropical and subtropical export corridors, where ambient temperatures exceed 25 degrees Celsius and refrigerated trucking penetration is low, effectively capping market reach for fresh product and channeling lower-grade nuts into dried or processed applications at 20-30% discounts.
*Our forecasts treat driver/restraint impacts as directional, not additive. The impact forecasts reflect baseline growth, mix effects, and variable interactions.
Geography Analysis
Asia-Pacific is projected to hold a 78.2% share of the chestnut market in 2025, supported by China's significant annual harvest from extensive cultivation areas. Domestic use absorbs about 95% of that volume, spanning roasted snacks, flour, and canned purée distributed across major e-commerce platforms. China exported mainly to Japan and South Korea, although year-over-year export growth decelerated as regional demand approached saturation. South Korea's domestic yield decline increased dependence on imports, providing opportunities for processors such as Bamtrae Farming Association. The company expanded its sales eightfold between 2022 and 2023 by utilizing fully automated flame-peeling lines and obtaining Halal certification. Thailand added a mid-priced retail niche, where chestnuts accounted for one-quarter of tree-nut consumption, signaling room for deeper penetration in Southeast Asian urban clusters.
North America is the fastest-growing region, with a 6.5% CAGR forecast through 2031. The number of United States chestnut farms doubled as agroforestry grants reduced establishment costs and participatory breeding networks accelerated cultivar rollout. Canada’s fumigation mandates on non-United States imports indirectly support cross-border sales, while the New York Tree Crops Alliance illustrates how cooperative processing can unlock regional value-added opportunities. Together, these factors reinforce a robust demand trajectory that will continue to expand the chestnut market in North America.
Europe exhibits a mixed scenario in the chestnut market. Italy and Spain achieve the highest yields, with Spain's export value increasing in 2023. However, the three-year compound growth rate remains negative due to climate variability and growing competition from Turkey and Portugal. Research initiatives led by Eurocastanea emphasize the development of heat-tolerant varieties and improved pest control methods, while the Food and Agriculture Organization’s insect-breeding laboratory in Albania offers a scalable Integrated Pest Management (IPM) model. Despite these advancements, climate-related challenges and rural depopulation pose significant risks to long-term supply. As a result, processors are focusing on diversifying sourcing strategies and investing in storage technologies to stabilize the chestnut market across Europe.


Regulatory Landscape
Phytosanitary compliance continues to shape trade flows for chestnuts and adjacent Castanea materials, with requirements varying by product form (fresh nuts vs. non-propagative processed products vs. wood). In North America, USDA APHIS generally treats processed, cured, or cooked chestnuts as generally authorized non-propagative plant products, which reduces permitting friction for value-added imports compared with live plant material. In Asia, China maintains an exit quarantine standard for exported chestnuts (SN/T 3272.4-2012), reinforcing the role of pre-export inspection, grading, and quarantine processes for outbound shipments.
In Europe, tightening pest-prevention measures around chestnut pathways remains a recurring compliance anchor for exporters, particularly where regulators focus on wood-related pest risks such as the two-lined chestnut borer (Agrilus bilineatus). Separately, trade policy uncertainty remains a practical consideration for nut and dried-fruit supply chains, as the International Nut and Dried Fruit Council noted the European Commission extension of the suspension of EU countermeasures on US nut and dried fruit imports through August 6, 2026, which gives importers and brand owners a defined window of tariff stability for contract and pricing decisions.
Value Chain Analysis
The global chestnut value chain starts with nursery and propagation (seedling and grafted plant material), orchard establishment and management, harvest (typically September to November in the Northern Hemisphere and April to May in the Southern Hemisphere), and primary post-harvest handling. Aggregators and cooperatives then perform cleaning, grading, and defect removal before routing product into either fresh distribution (cold chain intensive) or processing streams such as peeling, freezing, purees, flour, and confectionery ingredients. Downstream, chestnuts move through retail, food service, and industrial ingredient channels, where product form, shelf-life requirements, and certification (for example, organic or halal in certain export snack channels) drive pricing and market access.
Bottlenecks concentrate in labor and post-harvest infrastructure. Fresh chestnuts are highly perishable and require refrigeration through distribution, while manual harvesting and de-burring or peeling costs constrain margins for many small and mid-sized orchards. Europe also shows a structural supply gap relative to processing demand, which keeps industrial users and premium processors reliant on imports. Industry bodies such as EUROCASTANEA coordinate research and biological control efforts (notably against chestnut gall wasp), supporting upstream productivity and quality differentiation via geographic labeling programs (PDO/PGI) in key origin regions.
Competitive Landscape
Production, especially in China, where thousands of smallholder orchards contribute to aggregate output, yet downstream activities display higher concentration. A few large Chinese trading companies manage integrated grading operations, fumigation, and cold-storage hubs that feed both domestic and export channels. Italy uses a different model, importing lower-cost Turkish and Spanish nuts, processing them into premium marron glacé and roasted packs, then re-exporting finished goods. South Korea’s Bamtrae Farming Association demonstrates full vertical integration, converting raw nuts into roasted snacks, jellies, and purées for diaspora markets, with sales rising to KRW 4.6 billion (USD 3.5 million) in 2023.
Technology adoption shapes future leadership. Hefei Jinguoyuan’s 360-degree optical sorters deliver eight quality exits at two metric tons per hour, allowing exporters to differentiate premium categories and capture higher price points. In the United States, The Chestnut Company partnered with West Coast Chestnut in 2024 to deploy tissue-culture propagation of blight-resistant hybrids, aiming to rebuild a domestic supply base that collapsed a century ago. Emerging innovators target protein isolates and carbon-credit financing, both of which promise new revenue layers and raise barriers to entry inside the chestnut market.
Strategic developments persisted through 2025. The United Kingdom-based brand "This" demonstrated mainstream retail demand for chestnut-based meat substitutes, while Cornell AgriTech’s commercialization of chestnut milk and gluten-free pancake mixes indicated expansion into center-of-store grocery aisles. Collectively, these initiatives reinforce a trend toward higher processing intensity, stronger branding and more diversified applications that will elevate the competitive stakes across the chestnut industry.
Market Opportunities and Future Outlook
Processing and ingredient manufacturing capacity is a clear whitespace where current programs and investments are already taking shape. In May 2026, Breadtree Farms announced breaking ground on an organic processing facility in Salem, New York, backed by a USD 1.9 million USDA Organic Market Development grant, with designed throughput of about 800,000 lbs of fresh nuts and up to 100,000 to 150,000 lbs of flour. This infrastructure targets the conversion bottleneck between seasonal fresh supply and year-round applications such as gluten-free flour, mixes, and plant-based fillings, which are already appearing in mainstream retail and food manufacturing.
On the production side, public funding and regional plans add concrete pathways to expand managed orchard area and improve quality consistency. In May 2026, the Emilia-Romagna Region launched a chestnut cultivation plan supported by approximately EUR 4.6 million under CAP 2023-2027 rural development funding, targeting revitalization of abandoned groves alongside new intensive grafted plantations. Orchard labor constraints keep automation and sensing a practical opportunity area, supported by 2026 research progress in AI-based detection and vision-guided robotic harvesting systems that improve the feasibility of reducing manual picking and post-harvest losses in regions facing high labor costs and short shelf-life constraints.
Recent Industry Developments
- May 2026: Breadtree Farms confirmed it will break ground on an organic processing facility at its Salem, New York farm, supported by a USD 1.9 million USDA Organic Market Development grant. The site is designed for annual throughput of about 800,000 lbs of fresh nuts and 100,000 to 150,000 lbs of flour, expanding local conversion capacity beyond the seasonal fresh channel. Adding organic-certified processing supports higher value formats such as gluten-free flour and ingredients for plant-based fillings.
- November 2025: United Kingdom plant-based brand "This" launched a Chestnut, Mushroom, and Caramelised Onion Nut Roast at Tesco, priced at GBP 7.50 (about USD 9.50). The placement in a major supermarket channel indicates broader adoption of chestnut puree as a mainstream plant-based ingredient rather than a seasonal roast-only product. It also reinforces demand pull for stable puree and processed inputs with consistent specification.
- May 2024: The Food and Agriculture Organization inaugurated an insect-breeding laboratory in Bajram Curri, Albania, under the OCOP (One Country One Priority Product) initiative to combat the Asian chestnut gall wasp through biological control. The facility supports rearing and release of beneficial insects across infected areas in Tropoja, providing an Integrated Pest Management pathway for growers with limited chemical options. Improving pest control capability supports supply stability and quality in affected European-origin chestnut chains.


Research Methodology Framework and Report Scope
Market Definition and Coverage
This market covers the value of edible chestnuts traded and consumed as food, including fresh, dried, and lightly processed chestnuts sold through retail, food-service, and ingredient channels.
Scope exclusions: we exclude non-food derivatives such as tannin extracts, timber uses, and landscaping seedlings.
Segmentation Overview
- By Geography
- North America
- United States
- Production Analysis (Area Harvested, Yield, and Production Volume)
- Consumption Analysis (Consumption Value and Volume)
- Import Market Analysis (Import Value, Volume, and Key Supplying Markets)
- Export Market Analysis (Export Value, Volume, and Key Destination Markets)
- Wholesale Price Trend Analysis and Forecast
- Regulatory Framework
- List of Key Players
- Logistics and Infrastructure
- Seasonality Analysis
- Canada
- Production Analysis (Area Harvested, Yield, and Production Volume)
- Consumption Analysis (Consumption Value and Volume)
- Import Market Analysis (Import Value, Volume, and Key Supplying Markets)
- Export Market Analysis (Export Value, Volume, and Key Destination Markets)
- Wholesale Price Trend Analysis and Forecast
- Regulatory Framework
- List of Key Players
- Logistics and Infrastructure
- Seasonality Analysis
- United States
- Europe
- Germany
- Production Analysis (Area Harvested, Yield, and Production Volume)
- Consumption Analysis (Consumption Value and Volume)
- Import Market Analysis (Import Value, Volume, and Key Supplying Markets)
- Export Market Analysis (Export Value, Volume, and Key Destination Markets)
- Wholesale Price Trend Analysis and Forecast
- Regulatory Framework
- List of Key Players
- Logistics and Infrastructure
- Seasonality Analysis
- France
- Production Analysis (Area Harvested, Yield, and Production Volume)
- Consumption Analysis (Consumption Value and Volume)
- Import Market Analysis (Import Value, Volume, and Key Supplying Markets)
- Export Market Analysis (Export Value, Volume, and Key Destination Markets)
- Wholesale Price Trend Analysis and Forecast
- Regulatory Framework
- List of Key Players
- Logistics and Infrastructure
- Seasonality Analysis
- Spain
- Production Analysis (Area Harvested, Yield, and Production Volume)
- Consumption Analysis (Consumption Value and Volume)
- Import Market Analysis (Import Value, Volume, and Key Supplying Markets)
- Export Market Analysis (Export Value, Volume, and Key Destination Markets)
- Wholesale Price Trend Analysis and Forecast
- Regulatory Framework
- List of Key Players
- Logistics and Infrastructure
- Seasonality Analysis
- Italy
- Production Analysis (Area Harvested, Yield, and Production Volume)
- Consumption Analysis (Consumption Value and Volume)
- Import Market Analysis (Import Value, Volume, and Key Supplying Markets)
- Export Market Analysis (Export Value, Volume, and Key Destination Markets)
- Wholesale Price Trend Analysis and Forecast
- Regulatory Framework
- List of Key Players
- Logistics and Infrastructure
- Seasonality Analysis
- Germany
- Asia-Pacific
- South Korea
- Production Analysis (Area Harvested, Yield, and Production Volume)
- Consumption Analysis (Consumption Value and Volume)
- Import Market Analysis (Import Value, Volume, and Key Supplying Markets)
- Export Market Analysis (Export Value, Volume, and Key Destination Markets)
- Wholesale Price Trend Analysis and Forecast
- Regulatory Framework
- List of Key Players
- Logistics and Infrastructure
- Seasonality Analysis
- Japan
- Production Analysis (Area Harvested, Yield, and Production Volume)
- Consumption Analysis (Consumption Value and Volume)
- Import Market Analysis (Import Value, Volume, and Key Supplying Markets)
- Export Market Analysis (Export Value, Volume, and Key Destination Markets)
- Wholesale Price Trend Analysis and Forecast
- Regulatory Framework
- List of Key Players
- Logistics and Infrastructure
- Seasonality Analysis
- China
- Production Analysis (Area Harvested, Yield, and Production Volume)
- Consumption Analysis (Consumption Value and Volume)
- Import Market Analysis (Import Value, Volume, and Key Supplying Markets)
- Export Market Analysis (Export Value, Volume, and Key Destination Markets)
- Wholesale Price Trend Analysis and Forecast
- Regulatory Framework
- List of Key Players
- Logistics and Infrastructure
- Seasonality Analysis
- Thailand
- Production Analysis (Area Harvested, Yield, and Production Volume)
- Consumption Analysis (Consumption Value and Volume)
- Import Market Analysis (Import Value, Volume, and Key Supplying Markets)
- Export Market Analysis (Export Value, Volume, and Key Destination Markets)
- Wholesale Price Trend Analysis and Forecast
- Regulatory Framework
- List of Key Players
- Logistics and Infrastructure
- Seasonality Analysis
- South Korea
- South America
- Brazil
- Production Analysis (Area Harvested, Yield, and Production Volume)
- Consumption Analysis (Consumption Value and Volume)
- Import Market Analysis (Import Value, Volume, and Key Supplying Markets)
- Export Market Analysis (Export Value, Volume, and Key Destination Markets)
- Wholesale Price Trend Analysis and Forecast
- Regulatory Framework
- List of Key Players
- Logistics and Infrastructure
- Seasonality Analysis
- Brazil
- Middle East
- Saudi Arabia
- Production Analysis (Area Harvested, Yield, and Production Volume)
- Consumption Analysis (Consumption Value and Volume)
- Import Market Analysis (Import Value, Volume, and Key Supplying Markets)
- Export Market Analysis (Export Value, Volume, and Key Destination Markets)
- Wholesale Price Trend Analysis and Forecast
- Regulatory Framework
- List of Key Players
- Logistics and Infrastructure
- Seasonality Analysis
- United Arab Emirates
- Production Analysis (Area Harvested, Yield, and Production Volume)
- Consumption Analysis (Consumption Value and Volume)
- Import Market Analysis (Import Value, Volume, and Key Supplying Markets)
- Export Market Analysis (Export Value, Volume, and Key Destination Markets)
- Wholesale Price Trend Analysis and Forecast
- Regulatory Framework
- List of Key Players
- Logistics and Infrastructure
- Seasonality Analysis
- Saudi Arabia
- Africa
- South Africa
- Production Analysis (Area Harvested, Yield, and Production Volume)
- Consumption Analysis (Consumption Value and Volume)
- Import Market Analysis (Import Value, Volume, and Key Supplying Markets)
- Export Market Analysis (Export Value, Volume, and Key Destination Markets)
- Wholesale Price Trend Analysis and Forecast
- Regulatory Framework
- List of Key Players
- Logistics and Infrastructure
- Seasonality Analysis
- South Africa
- North America
Data Sources, Market Sizing, and Validation
Desk Research
Desk research starts with mapping where chestnuts are produced, traded, and consumed, so the demand pool is grounded in observable flows rather than inferred from general nut trends. We use public agricultural and trade statistics to anchor volumes and trade routes, then link those flows to pricing and channel mixes.
Common sources include FAOSTAT for crop output, UN Comtrade for import and export values and quantities, USDA and EU agri-stat reports for country crop notes and price signals, plus national agriculture ministries and customs portals where available. We also review peer-reviewed food science journals for processing yields and storage losses, and we use company filings and investor presentations for product mix cues and regional exposure. Where needed, paid subscriptions are used for company financials and intelligence, news and financials, patent databases, and shipment-level trade datasets to clarify routes and unit values. This list is indicative, and additional sources were checked for data collection, cross-checking, and clarification.
Primary Interviews and Surveys
Primary work is used to pressure-test the desk inputs, especially price realization, the share of fresh versus processed formats, and the split of volume between retail, food-service, and ingredient buyers. We speak with growers, processors, traders, distributors, and large buyers across key producing and importing regions, so the model assumptions reflect what respondents see in day-to-day buying and selling.
Distribution of primary research fieldwork respondents
| Company type | Respondent position | Region |
|---|---|---|
| Top tier: 38% | CXOs: 13% | APAC: 42% |
| Mid tier: 46% | Functional/Unit leaders: 43% | EMEA: 36% |
| Smaller Players: 16% | Managers: 44% | Americas: 22% |
Market-Sizing & Forecasting
For sizing, the main build uses a top-down approach where production and trade data are reconstructed into an available supply pool, then adjusted for typical processing yields, storage loss, and domestic consumption patterns. Once the volume base is established, value is calculated using country-level average selling prices that reflect the mix of fresh, dried, and lightly processed chestnuts.
To keep the totals realistic, we corroborate the outcome with selective bottom-up checks, such as sampled exporter price quotes, processor capacity and utilization discussions, and channel checks on retail pack sizes and common price bands. Key inputs used in the model include harvested production volumes, import and export tonnage, unit value per ton from trade statistics, seasonal price swings around harvest months, and the share of volume moving through retail versus food-service. Where a country has thin public reporting, gaps are handled through proxy pricing from nearby trade-linked markets, then corrected using interview feedback.
Forecasts are built using scenario analysis supported by trend lines on planted area, yield improvements, expected weather volatility impact, and demand signals for chestnut-based snacks and gluten-free ingredients. Assumptions are tuned to what interviewees expect on pricing progression and on incremental supply absorption, including the likelihood of discounting if supply rises faster than demand.
Data Validation & Update Cycle
Validation is done in layers so one weak data point does not overly influence the result. We compare the modeled market value against independent signals such as trade value totals, major producing-country output direction, and expected price ranges for the season, then review variances before sign-off.
If an anomaly is found, such as a sudden jump in unit values or an unusual trade swing, we recheck the underlying series and trigger targeted follow-ups using sources closest to that part of the chain. Reports are refreshed annually, with interim updates when material events occur, including sharp crop disruptions or major policy changes affecting trade. Before delivery, an analyst performs a final pass so clients receive the latest updated view.
Mordor Intelligence's Chestnuts Market Size Compared With Other Published Estimates
It is normal to see different published market values for chestnuts because each study sets its own boundary on what counts as the market and which years and prices are used. Differences also show up when one publisher relies more on production-side logic, while another relies more on retail sales proxies.
By tracking country-level production and trade volumes and refreshing the pricing and channel-mix assumptions with Mordor Intelligence in the middle of the build, the estimate stays tied to edible chestnuts sold as food and avoids spillover from non-food derivatives or broader nut baskets.
Benchmark comparison
| Source | Market Size | Gaps in Research Methodology |
|---|---|---|
| Mordor Intelligence | USD 4.53 B (2025) | |
| Trade Journal A | USD 4.64 B (2024) | Uses a prior-year base and often applies a generalized price progression, which can understate harvest-season volatility and shift the value when currency timing differs. |
| Industry Report B | USD 3.70 B (2023) | Leans toward a narrower channel lens and may miss some bulk ingredient and food-service movement, which reduces the counted demand pool in high-producing countries. |
The spread across the three values mostly comes from what gets counted and how prices are translated into USD across years. When volumes are anchored to production and trade signals and then aligned to realistic ASPs by market, the total is easier to trace, explain, and replicate in future refreshes.


Key Questions Answered in the Report
How large is the chestnut market today?
The chestnut market size reached USD 4.74 billion in 2026 and is projected to climb to USD 5.58 billion by 2031.
Which region leads global production?
Asia-Pacific dominates with 78.20% of 2025 volume, supported by China's significant annual harvest from extensive cultivation areas.
Where is the fastest growth occurring?
North America is expanding at a 6.50% CAGR through 2031, supported by agro-forestry subsidies and a doubling of farms between 2021 and 2025.
What are the main growth drivers?
Key factors include rising gluten-free demand, plant-based confectionery adoption, public agro-forestry funding and carbon-credit monetization.
How are climate trends affecting growers?
Warming winters in Southern Europe reduce chill hours, pushing farmers to higher elevations and spurring research into heat-tolerant cultivars.
Which new products are entering the market?
Chestnut milk, gluten-free flour, roasted snack packs and plant-based nut roasts are moving from pilot scale to mainstream retail shelves.
Page last updated on:


 Your data is secure and never sold or shared.


