
Chennai Data Center Market Size and Share
Market Overview
| Study Period | 2020 - 2032 |
|---|---|
| Forecast Data Period | 2026 - 2032 |
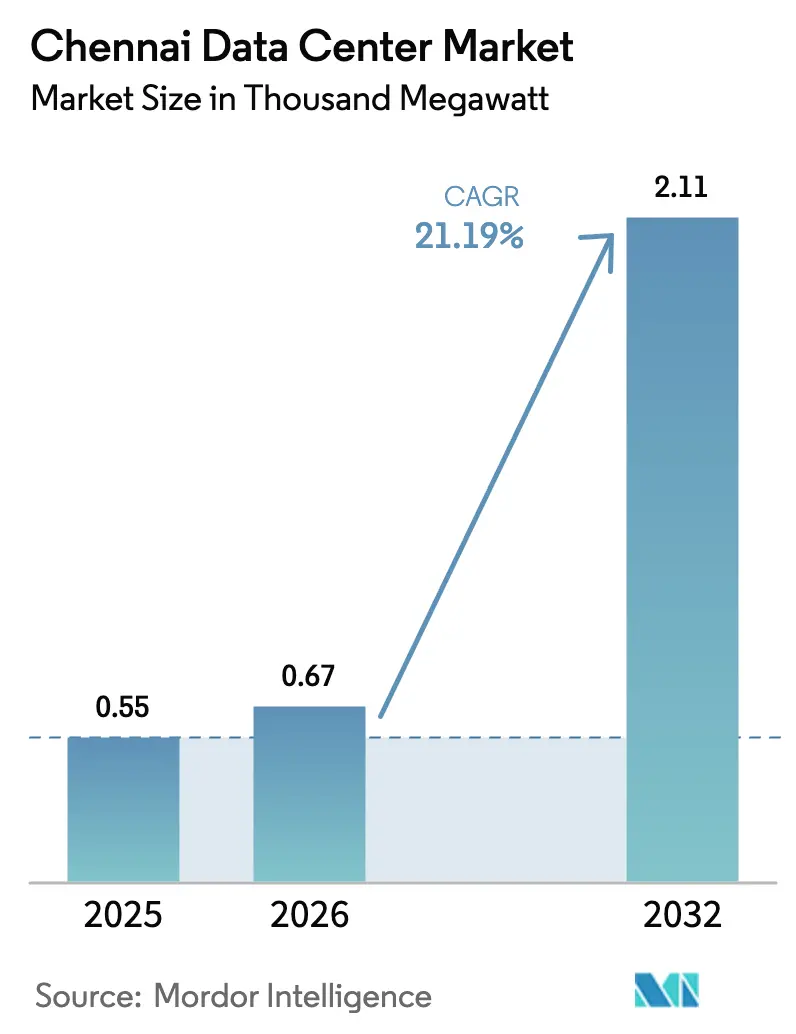
| Base Year Market Size (2025) | 0.55 Thousand megawatt |
| Market Volume (2026) | 0.67 Thousand megawatt |
| Market Volume (2032) | 2.11 Thousand megawatt |
| Growth Rate (2026 - 2032) | 21.19% CAGR |
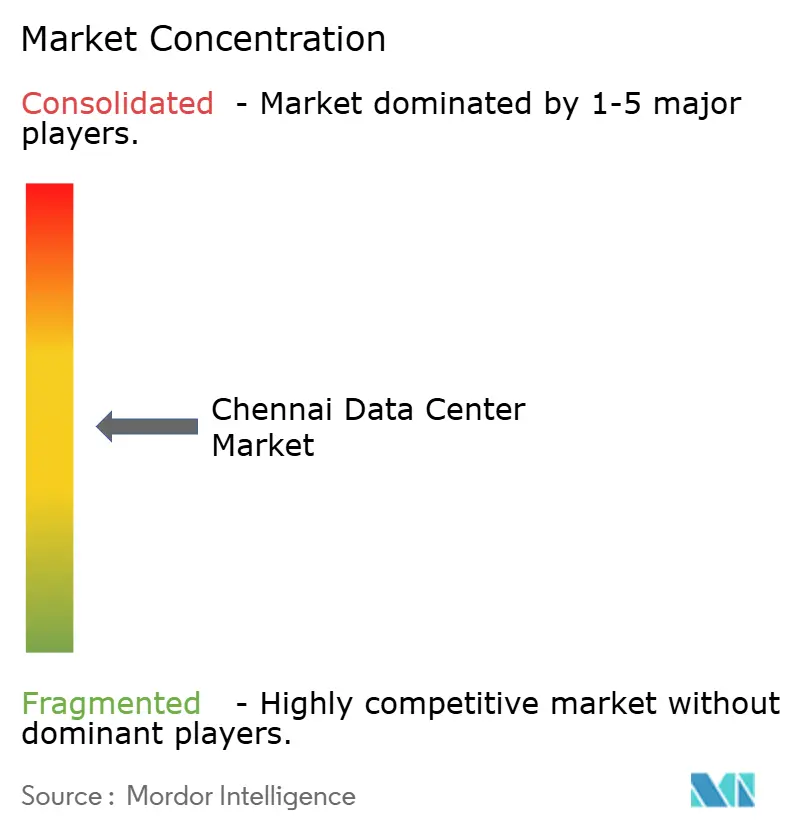
| Market Concentration | Medium |
Major Players *Disclaimer: Major Players sorted in no particular order Image © Mordor Intelligence. Reuse requires attribution under CC BY 4.0. | |
Chennai Data Center Market Analysis by Mordor Intelligence
The Chennai data center market size is expected to grow from 0.55 Thousand MW in 2025 to 0.67 Thousand MW in 2026 and is forecast to reach 2.11 Thousand MW by 2032 at 21.19% CAGR over 2026-2032. Market growth stems from the convergence of new submarine cable landings, state-backed renewable-energy corridors, cloud-first digital transformation, and AI-focused rack-density upgrades. Competitive intensity has deepened as global operators deploy capital toward hyperscale campuses, while local firms pivot to edge and compliance-ready services. Large contiguous parcels near cable landing stations command premium pricing, but operators are pursuing multi-phase builds in inland industrial zones to balance cost and risk. Rapid renewable integration and single-window clearances lower operating costs, yet grid-tie delays, land scarcity, and monsoon-related flood risks remain material constraints.
Key Report Takeaways
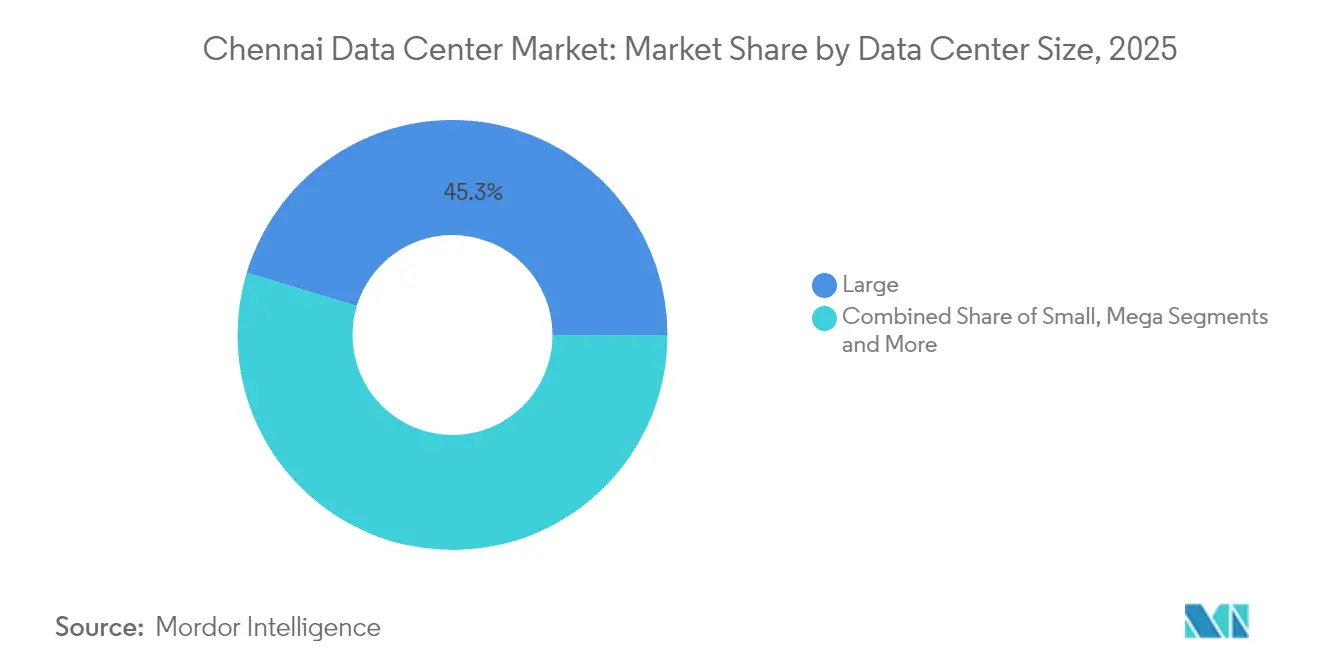
- By data-center size, large facilities led with 45.32% of Chennai data center market share in 2025, while the massive segment is forecast to advance at a 23.12% CAGR through 2032.
- By tier standard, Tier III accounted for a 76.28% share of the Chennai data center market size in 2025, whereas Tier IV is projected to grow at a 21.74% CAGR to 2032.
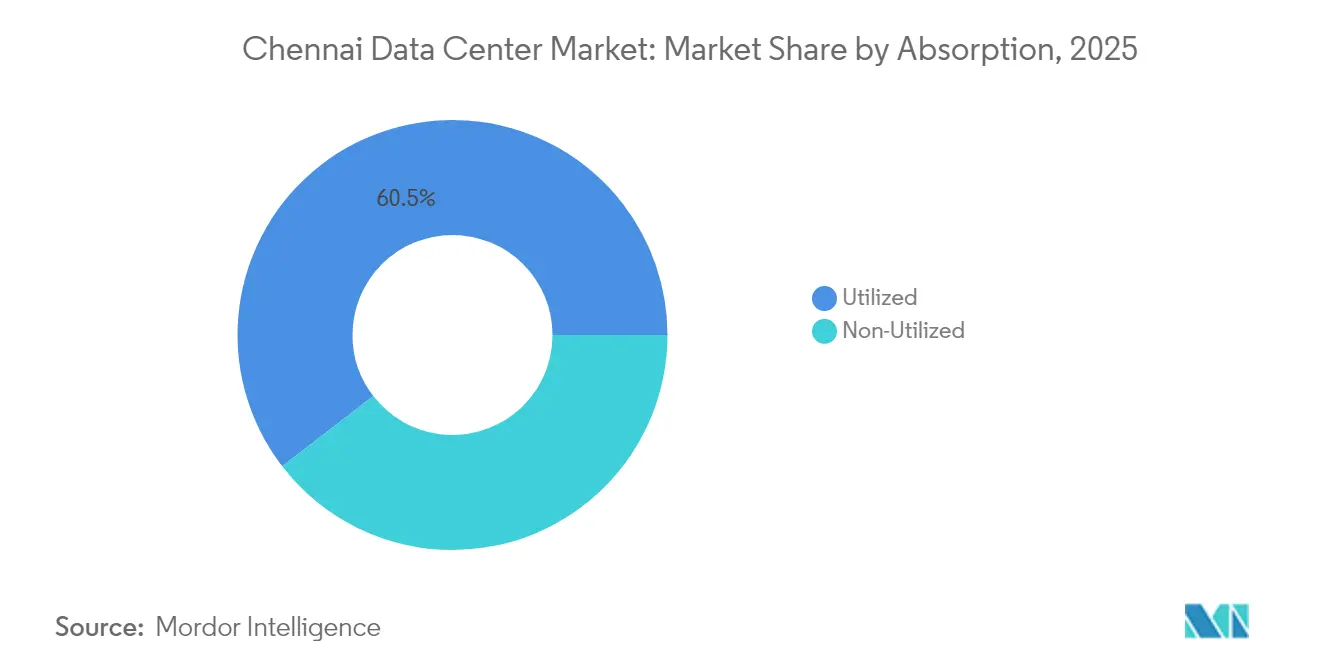
- By absorption, the utilized capacity represented 60.45% of the Chennai data center market in 2025 and is set to expand at a 22.36% CAGR through 2032.
Note: Market size and forecast figures in this report are generated using Mordor Intelligence’s proprietary estimation framework, updated with the latest available data and insights as of 2026.
Chennai Data Center Market Trends and Insights
Drivers Impact Analysis*
| DRIVER | (~) % IMPACT ON CAGR FORECAST | GEOGRAPHIC RELEVANCE | IMPACT TIMELINE |
|---|---|---|---|
| Sub-sea cable landings multiply international bandwidth | +4.2% | Chennai coastal corridor | Medium term (2–4 years) |
| Renewable-energy open-access corridors in Tamil Nadu | +3.8% | State-wide, Chennai hub | Long term (≥4 years) |
| Cloud-first adoption by BFSI, OTT and GCC operators | +5.1% | Chennai metro and tier-2 spillover | Short term (≤2 years) |
| State incentives under Tamil Nadu DC policy | +2.9% | State-wide, Chennai focus | Medium term (2–4 years) |
| ≥30 kW AI/LLM rack densities force white-space retrofits | +3.7% | IT corridor and industrial zones | Short term (≤2 years) |
| Cold-chain logistics pivot to data-powered automation hubs | +1.5% | Port vicinity and manufacturing clusters | Long term (≥4 years) |
| Source: Mordor Intelligence | |||
Sub-sea cable landings multiply international bandwidth
Five additional systems, including SEA-ME-WE-6 and MIST, give Chennai direct access to 420 TBPS aggregate capacity, lowering latency to Singapore and Marseille while positioning the city as a regional disaster-recovery hub.[1]Economic Times Telecom, Bharti Airtel lands SEA-ME-WE 6 submarine cable in Chennai, telecom.economictimes.indiatimes.com Cable operators co-locate landing stations with hyperscale campuses, creating vertically integrated connectivity-to-compute clusters that attract OTT and fintech workloads. Bandwidth abundance also underpins the Chennai data center market’s role in AI training, where large data ingests benefit from high-capacity international routes. Combined with India’s nine-fold increase in cable capacity since 2016, Chennai’s share of outbound traffic continues to rise.
Renewable-energy open-access corridors in Tamil Nadu
Tamil Nadu hosts 34.7 GW of renewable assets across wind, solar, and hydro, giving operators a cost-effective path to 100% clean energy targets.[2]The Hindu, A different shade of green: T.N.’s renewable energy initiatives, thehindu.com Data-center power purchase agreements benefit from favorable wheeling charges and banking provisions, cutting operating costs by up to 12%. STT GDC sources more than 60% green power for its Chennai campus, while Equinix targets 100% by 2030. Renewable corridors also de-risk future carbon regulations, making sustainability a competitive differentiator in hyperscale colocation bids.
Cloud-first adoption by BFSI, OTT and GCC operators
Large banks, OTT platforms, and 305 global capability centers rely on low-latency interconnects and local compliance to host critical workloads in Chennai. Mizuho Financial Group quadrupled its headcount to 1,000 and shifted AI and cybersecurity operations to a Chennai data center in 2025.[3]Business Standard, Japan’s Mizuho Finance Group sets up global business centre in Chennai, business-standard.com OTT firms consolidate storage and transcoding nodes locally to serve South India, driving steady utilization in both retail and hyperscale colocation segments.
State incentives under Tamil Nadu DC policy
The policy offers land-cost rebates, electricity-duty waivers, and accelerated depreciation benefits, trimming upfront capex by 6–8% and shortening approval cycles to 90 days. SEZ designation at TN Tech City adds tax holidays and faster customs clearance for imported equipment, further reducing time-to-market. Combined incentives have attracted CapitaLand, Yotta, and AdaniConneX to announce multi-phase campuses near Chennai.
Restraints Impact Analysis*
| RESTRAINTS | (~) % IMPACT ON CAGR FORECAST | GEOGRAPHIC RELEVANCE | IMPACT TIMELINE |
|---|---|---|---|
| Scarcity of contiguous greater than 25-acre parcels in Greater Chennai | -2.8% | Greater Chennai | Short term (≤2 years) |
| 230 kV grid-tie lead times exceed 24 months | -3.1% | Chennai and suburbs | Medium term (2–4 years) |
| Monsoon-flood and CRZ clearance risk along ECR coastline | -1.9% | Coastal Chennai | Long term (≥4 years) |
| Shortfall of Uptime-Tier-certified commissioning talent | -2.2% | Chennai metro | Medium term (2–4 years) |
| Source: Mordor Intelligence | |||
Scarcity of contiguous greater than 25-acre parcels in Greater Chennai
Urban expansion has exhausted prime land along the IT corridor, raising acquisition costs by 15–20% and forcing operators toward multi-story vertical builds or suburban campuses. Yotta’s 13-acre facility achieves 20,000-rack capacity through floor-wise modular design, while ESR offers 80 acres in Oragadam to offset coastal land premiums. Land scarcity could slow the Chennai data center market unless satellite clusters emerge.
230 kV grid-tie lead times exceed 24 months
TANGEDCO approvals lag behind demand, prompting developers to install on-site gas generators or secure 110 kV interim feeds, inflating project costs by 8%. Utility restructuring into separate generation and distribution entities promises efficiency gains but remains a medium-term solution.
*Our forecasts treat driver/restraint impacts as directional, not additive. The impact forecasts reflect baseline growth, mix effects, and variable interactions.
Segment Analysis
By Data Center Size: Massive Facilities Drive AI Infrastructure
Large facilities captured 45.32% of Chennai data center market share in 2025, supported by balanced capex and near-shore connectivity advantages. The massive segment is forecast to grow at 23.12% CAGR, contributing 782.6 MW to Chennai data center market size by 2032. Hyperscale clients reserve contiguous halls exceeding 10 MW to deploy liquid-cooled AI clusters, while enterprises lease smaller blocks within large campuses for compliance-ready workloads.
Chennai’s massive campuses integrate on-site substations and direct renewable feeds, reducing power latency and carbon footprints. AdaniConneX’s flagship campus pairs a 400 kV switchyard with an 18 MW solar plant, enabling 30 kW racks without derating. NTT’s Chennai 2 facility prioritizes modular power trains, allowing phased expansion in response to AI demand surges.


By Tier Standard: Tier IV Adoption Accelerates for Mission-Critical Workloads
Tier III remains the backbone of enterprise colocation, holding 76.28% of the Chennai data center market in 2025. Rapidly evolving regulatory mandates in BFSI and telecom segments, however, fuel Tier IV demand, which is expected to expand at 21.74% CAGR. Financial services clients require 99.995% uptime for risk analytics and transaction processing, making concurrently maintainable infrastructure imperative.
Operators differentiate on certification speed and fault‐tolerant design. Equinix CN1 embeds 2(N+1) UPS topology and six-layer security to meet global banking standards. AI training clusters further tilt preference toward Tier IV given the cost of interrupted model builds. As a result, a growing share of new supply enters the market with Tier IV design readiness, even if operators initially certify at Tier III for capex prudence.
By Absorption: Utilized Capacity Reflects Strong Enterprise Demand
Utilized halls accounted for 60.45% of total live IT load in 2025, underscoring Chennai’s status as a mature, demand-aligned region. Hyperscale colocation sub-leases anchor pre-commitments exceeding 18 months, allowing operators to finance rapid expansions at favorable terms. Retail racks serve 305 GCCs and hundreds of fintech start-ups, filling smaller footprints with moderate power densities.
High utilization accelerates return on invested capital and validates forward-purchase land strategies despite scarcity risks. City Union Bank’s full migration to a Chennai colo hall cut latency for payment gateways by 35% while meeting RBI security norms. Empty shell capacity remains essential to capture AI testing surges; operators maintain buffer halls equal to 15–20% of built space, ensuring rapid ramp-up while sustaining market balance.
Geography Analysis
The Chennai data center market commands 22.60% of India’s total installed capacity, driven by proximity to five submarine cable landing stations and a 1,400-acre IT corridor housing 80% of Grade A office supply. Sub-regional clusters have emerged: the OMR-Siruseri stretch focuses on latency-sensitive OTT and fintech clients; Ambattur and Madhavaram cater to hyperscale builds seeking inland elevation and lower land prices. Coastal sites enjoy direct cable interconnects but require CRZ compliance measures that lift capex by 7%.
Industrial suburbs such as Oragadam and Sriperumbudur offer parcels exceeding 50 acres at a 35% discount to OMR. ESR’s 80-acre park showcases a campus-style model combining warehouse and edge data-center pods serving automotive IoT analytics. Government-led TN Tech City in Madhavaram targets mixed-use tech development, integrating data-center zoning with metro connectivity to decongest prime corridors.
Regional interconnect initiatives augment Chennai’s hub status. Space World’s USD 500 million fiber ring links 14 Chennai facilities with 400G wavelengths, reducing cross-connect fees and improving disaster-recovery posture for enterprises spanning Bengaluru and Hyderabad.
Regulatory Landscape
Chennai data center activity operates under Tamil Nadu's Data Centre Policy (2021), which includes electricity tax exemptions for five years, stamp-duty waivers, and land-cost subsidies in select districts. The Digital Personal Data Protection Rules notified on 13 November 2025 set an 18-month compliance runway ending 13 May 2027, influencing governance, security controls, and vendor due diligence for in-country processing.
National direction is also moving toward standardization and data-economy frameworks, with MeitY through the STQC Directorate establishing a certification framework and TRAI initiating a July 2026 consultation on a data center policy framework. Central fiscal measures around notified data centers further reinforce auditable standards and residency-ready architectures.
Value Chain Analysis
Chennai data center value chain begins with land aggregation and permitting, followed by design and engineering for powered-shell capacity and high-specification fit-outs. Developers and operators then contract EPC and MEP firms for modular power trains, substation integration, and advanced cooling to accommodate high-density workloads.
New builds increasingly reference IGBC Platinum-aligned practices to support enterprise and hyperscale bid requirements tied to energy and carbon performance screening. Upstream, power procurement and grid connectivity depend on utility supply, with open-access renewable sourcing paired with FDRE via SECI to manage renewable intermittency while meeting uptime requirements. Downstream, operators bundle colocation with managed services, security, and compliance support, with Sify Infinit Spaces Limited positioning multi-site portfolios and technology partnerships to deliver integrated cloud-adjacent services.
Competitive Landscape
The Chennai data center market commands 23% of India’s total installed capacity, driven by proximity to five submarine cable landing stations and a 1,400-acre IT corridor housing 80% of Grade A office supply. Sub-regional clusters have emerged: the OMR-Siruseri stretch focuses on latency-sensitive OTT and fintech clients; Ambattur and Madhavaram cater to hyperscale builds seeking inland elevation and lower land prices. Coastal sites enjoy direct cable interconnects but require CRZ compliance measures that lift capex by 7%.
Industrial suburbs such as Oragadam and Sriperumbudur offer parcels exceeding 50 acres at a 35% discount to OMR. ESR’s 80-acre park showcases a campus-style model combining warehouse and edge data-center pods serving automotive IoT analytics. Government-led TN Tech City in Madhavaram targets mixed-use tech development, integrating data-center zoning with metro connectivity to decongest prime corridors.
Regional interconnect initiatives augment Chennai’s hub status. Space World’s USD 500 million fiber ring links 14 Chennai facilities with 400G wavelengths, reducing cross-connect fees and improving disaster-recovery posture for enterprises spanning Bengaluru and Hyderabad.
Chennai Data Center Industry Leaders
Sify Technologies Limited
STT Telemedia
Reliance industries
NTT Data
Nxtra Data Limited
- *Disclaimer: Major Players sorted in no particular order

Market Opportunities and Future Outlook
Rising rack densities strengthen the case for AI-ready capacity and compliance-ready operations in Chennai, creating room for new supply. The near-term opportunity is anchored by Sify Infinit Spaces Limited's IFC-backed 371 million financing for 103 MW across Navi Mumbai and Chennai, ST Telemedia Global Data Centres India’s fourth Chennai campus at Siruseri with 45 MW capacity, and a Tamil Nadu government investment of ₹4,200 crore to develop AI-ready data center infrastructure in the state. In parallel, Sify's SIPCOT Siruseri campus inaugurated in 2025 targets up to 130 MW.
These investments position Chennai as a multi-site, high-density hub for AI workloads and cloud services near cable landing access, with activity also supported by enterprise and hyperscale deployments. Assurance for operators and customers is being shaped through regulatory and standardization steps, including the DPDP Rules (November 2025), TRAI's July 2026 policy consultation, and MeitY-STQC certification initiatives tied to auditable security and standardized service commitments in Chennai.
Recent Industry Developments
- June 2026: Sify Infinit Spaces Limited secures a 371 million IFC package, including a 71 million loan, to develop two data centers totaling 103 MW capacity in Navi Mumbai and Chennai. The investment enables faster capacity growth and AI ready infrastructure in Chennai.
- February 2026: ST Telemedia Global Data Centres India launches its fourth data center in Chennai at Siruseri with an initial 7.2 MW operational and a planned 45 MW capacity. The expansion supports Chennai as a multi campus, high density data center cluster and adds to regional capacity.
- February 2026: ST Telemedia Global Data Centres India signs a memorandum of understanding with the Tamil Nadu government to invest INR 4200 crore to develop AI ready data center infrastructure in the state. State-backed capital and policy support reinforce AI ready data center development in the Chennai region.


Research Methodology Framework and Report Scope
Market Definition and Coverage
For this report, the market is defined as the data center capacity available in Chennai, expressed as IT power load in MW. This includes commissioned supply and the pipeline that is built out and contracted for use.
Scope exclusions: We exclude office IT rooms that are not purpose-built data centers, and we do not count telecom network nodes that are not operated as data center space.
Segmentation Overview
- By Data Center Size
- Small
- Medium
- Large
- Mega
- Massive
- By Tier Standard
- Tier I and II
- Tier III
- Tier IV
- By Absorption
- Utilized
- By Colocation Type
- Hyperscale
- Retail
- Wholesale
- By End-User Industry
- BFSI
- Cloud Service Providers
- E-Commerce
- Government
- Manufacturing
- Media and Entertainment
- Telecom
- Other End Users
- By Colocation Type
- Non-Utilized
- Utilized
Data Sources, Market Sizing, and Validation
Desk Research
Desk research was used to map Chennai supply additions, demand triggers, and constraints that affect how quickly MW can come online. Public sources such as the Ministry of Electronics and Information Technology updates, Department of Telecommunications licensing notes, Central Electricity Authority statistics, and Power Grid and state utility filings helped us ground power availability and grid buildout assumptions.
To make the build pipeline more realistic, we also referenced inputs from sources such as submarine cable landing announcements, environmental and zoning notices, and trade association publications, including capacity mentions shared by industry bodies and conference papers. Along with these, company filings, investor presentations, and reputable press coverage were reviewed to cross-check timelines and the type of expansions. We also used select paid subscriptions for company financials and intelligence, patent searches, and shipment-level import or export signals for equipment when it helped validate directionally. This desk list is not exhaustive, since many other sources were used for cross-verification and clarification.
Primary Interviews and Surveys
We interview data center operators, infrastructure suppliers, cloud and colocation specialists, power and connectivity experts, and enterprise users active in Chennai. Surveys and calls test capacity status, utilization, project timing, rack-density changes, pricing direction, and demand drivers, helping us correct gaps in public records and triangulate the Chennai view. Re-contact is used when responses conflict with a disclosed Chennai project or policy record.
Distribution of primary research fieldwork respondents
| Company type | Respondent position | Region |
|---|---|---|
| Top tier: 30% | CXOs: 20% | |
| Mid tier: 45% | Functional/Unit leaders: 30% | |
| Smaller Players: 25% | Managers: 50% |
Market-Sizing & Forecasting
Sizing starts with a top-down reconstruction of the city demand pool by translating digital activity and enterprise adoption into needed IT load, and then tying that to what can be delivered through power and land constraints. For Chennai, the inputs that matter include announced and under-construction MW by campus, commissioning schedules, utilization and pre-commit rates, average rack density shifts (AI-ready upgrades), and the pace of new fiber and cable landing readiness.
After building the demand and supply views, we corroborate with selective bottom-up approximations, such as sampled facility MW roll-ups and channel checks on delivery lead times. We also sanity-check absorption by using active footprint changes that buyers report. Where project information is incomplete, gaps are handled by applying conservative phase conversion factors, and then the totals are revisited after expert validation.
For forecasting, scenario analysis is used so the base case can reflect realistic slippage and step-ups in capacity, which is common in this market. The scenarios are anchored on power availability timing, permitting speed, and the likelihood of multi-phase campuses moving from announcement to commissioning, and then aligned with the expert consensus collected in interviews.
Data Validation & Update Cycle
Validation is done through multiple checks so the final MW figures remain traceable to clear drivers. We compare model outputs against independent signals such as operational capacity mentions, net absorption direction, and known commissioning milestones. Where results look inconsistent, we investigate the underlying assumptions before sign-off.
A second analyst review is performed to catch variance issues, especially around double counting pipeline phases and mixing operational MW with planned MW. When a material event happens, such as a major campus delay, a new cable landing confirmation, or a policy change affecting power tariffs, the relevant assumptions are rechecked and primary contacts may be revisited. Reports are refreshed annually, with interim updates for material events, and a final pre-delivery pass so clients receive the latest updated view.
Mordor Intelligence's Chennai Data Center Market Estimate Compared With Other Published Estimates
Published estimates for Chennai often differ even when they use the same unit, because the underlying meaning of capacity is not always the same. Some sources report only operational MW, others mix operational with under-construction, and a few blend city totals with nearby cluster capacity that is marketed as Chennai.
The biggest gap drivers are typically how pipeline phases are counted, whether utilization and absorption are treated separately, and how quickly rack density is assumed to move up in the forecast. Differences also come from refresh timing and how project slippages are handled, since delayed commissioning can shift year-end MW noticeably in a fast-growing market. Some external figures rely on broad capacity statements from event disclosures, while Mordor Intelligence counts MW only when sites are commissioned or have a clearly evidenced build stage and power path that can be validated.
Benchmark comparison
| Source | Market Size | Gaps in Research Methodology |
|---|---|---|
| Mordor Intelligence | USD 0.55 B (2025) | |
| Industry Association A | USD 0.20 B (2025) | Often communicated as installed or current capacity only, with limited treatment of committed pipeline and utilization splits, which can understate the near-term market if construction is active. |
| Real Estate Advisory B | USD 0.11 B (2024) | Uses operational capacity snapshots and supply additions, which can miss longer lead-time phases and can shift the base-year MW depending on the cut-off date used for projects. |
Across the three figures, the spread is mainly explained by whether the estimate treats Chennai as an operational snapshot or as a supply plus absorption model that recognizes build stages. When scope and timing are made explicit, the market size becomes easier to compare year to year, and it stays linked to repeatable inputs such as MW commissioning, utilization, and validated pipeline milestones.


Key Questions Answered in the Report
How large is the Chennai data center market in 2026?
Installed IT load is 666.55 MW and is forecast to reach 2,110.92 MW by 2032.
Which data-center size segment is growing the fastest?
Massive campuses show the highest growth, projected at a 23.12% CAGR through 2032.
Why are Tier IV facilities gaining traction in Chennai?
Financial services, OTT, and AI workloads demand 99.995% uptime that Tier IV designs assure.
What role do submarine cables play in local growth?
New landings such as SEA-ME-WE-6 and MIST supply 420 TBPS capacity, reducing latency and attracting international workloads.
How are operators addressing renewable-energy goals?
Developers sign open-access PPAs with Tamil Nadu wind and solar farms, achieving up to 100% green power targets.
What is a key bottleneck for rapid expansion?
230 kV grid-tie approvals often exceed 24 months, delaying large-scale power connectivity.
Page last updated on:






