Market Overview
| Study Period | 2017 - 2030 |
|---|---|
| Market Size (2025) | USD 43.20 Billion |
| Market Size (2030) | USD 55.90 Billion |
| Growth Rate (2025 - 2030) | 5.30% CAGR |
| Fastest Growing Market | North America |
| Largest Market | North America |
| Market Concentration | Medium |
Major Players
*Disclaimer: Major Players sorted in no particular order Image © Mordor Intelligence. Reuse requires attribution under CC BY 4.0. |
|

Cereals And Grains Seed Market Analysis by Mordor Intelligence
The cereals and grains seed market size is estimated at USD 43.20 billion in 2025 and is projected to climb to USD 55.90 billion by 2030, translating into a 5.30% compound annual growth rate (CAGR) across the forecast period. This growth pattern reflects farmers’ shift toward high-value genetics that perform reliably under climate stress while supporting biofuel, feed, and food security goals. Rapid gains in mechanized seed production cut unit costs and improve quality, allowing multinationals and regional firms to penetrate new territories at scale. Heightened demand for digital decision tools and blockchain traceability further compels seed companies to link agronomic advice with every bag sold, strengthening grower loyalty and creating data monetization streams. Competitive intensity remains moderate as the top five suppliers command 42.4% of global revenue, white-space opportunities persist in sorghum, open-pollinated niches, and region-specific hybrids suited to smallholder systems.
Key Report Takeaways
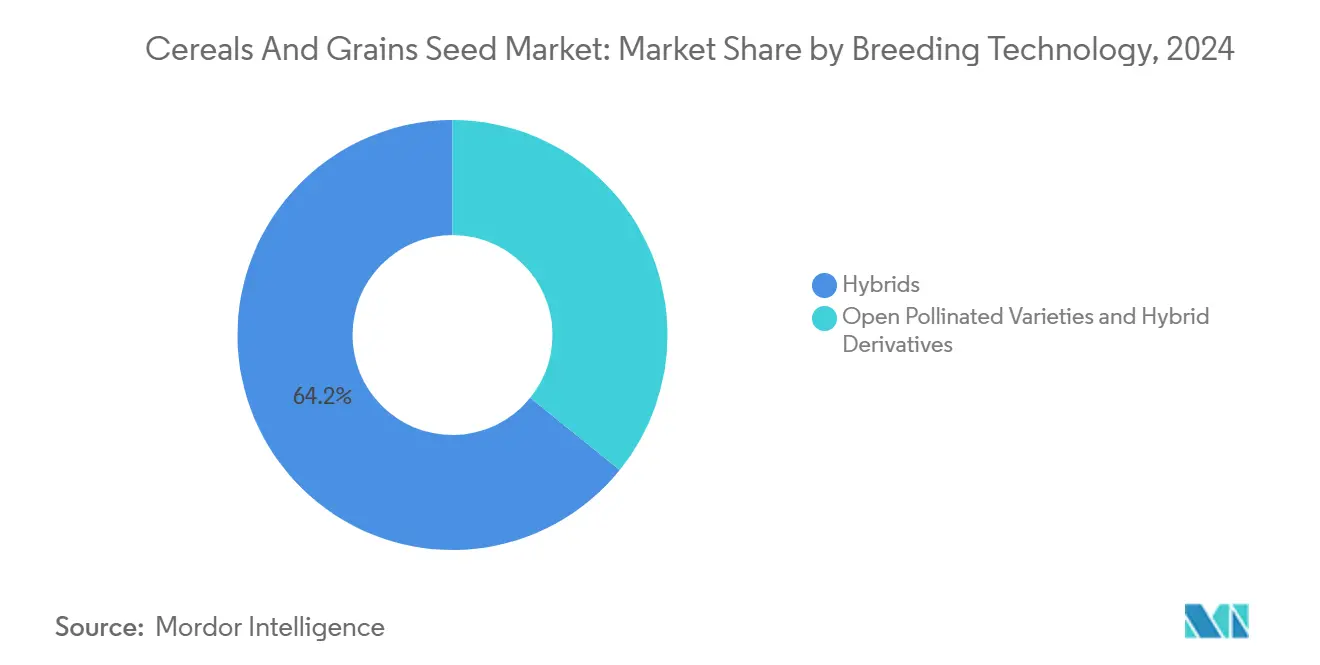
- By breeding technology, hybrids captured 64.2% of the cereals and grains seed market share in 2024, and posted the fastest 5.44% CAGR through 2030.
- By crop, corn maintained a 58.5% share of the cereals and grains seed market size in 2024, and sorghum registered the highest 6.04% CAGR during the outlook period.
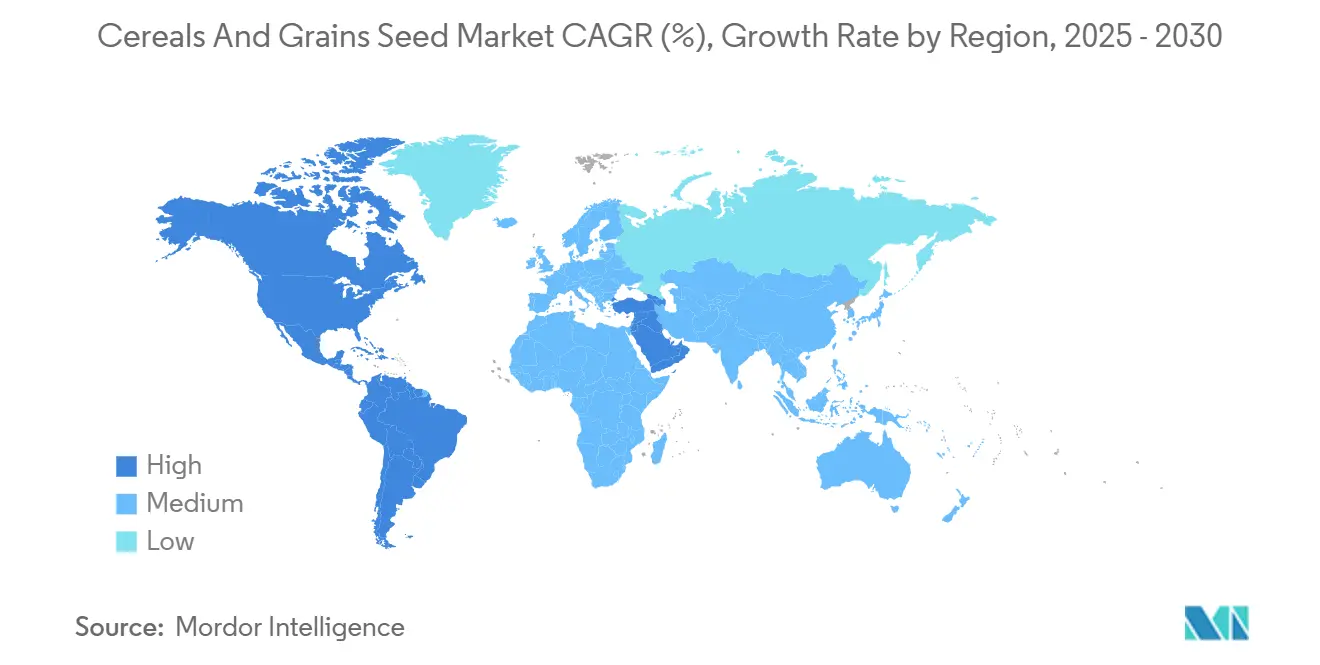
- By region, North America held 36.1% revenue share in 2024, and the same region is projected to post the quickest 6.98% CAGR through 2030.
- The top five suppliers controlled 42.4% of global revenue in 2024, underscoring a moderately concentrated marketplace.
Global Cereals And Grains Seed Market Trends and Insights
Drivers Impact Analysis
| Driver | (~) % Impact on CAGR Forecast | Geographic Relevance | Impact Timeline |
|---|---|---|---|
| Rise in Demand for Hybrid Grains | +1.2% | Global, with strongest uptake in Asia-Pacific and South America | Medium term (2-4 years) |
| Expansion of Mechanized Seed Production | +0.8% | North America and Europe core, expanding to Brazil and Argentina | Long term (≥ 4 years) |
| Climate-Resilient Genetics and Bio-Innovation | +0.9% | Global, with priority focus on drought-prone regions | Long term (≥ 4 years) |
| Government Biofuel Mandates Spurring Corn Demand | +0.7% | North America, Brazil, and the European Union with renewable fuel standards | Medium term (2-4 years) |
| Growing Adoption of Digital Seed-Selection Platforms | +0.6% | North America and Europe early adoption, Asia-Pacific following | Short term (≤ 2 years) |
| Precision-Ag Data Accelerating Trait Deployment | +0.5% | Advanced agricultural economies with high-tech penetration | Medium term (2-4 years) |
| Source: Mordor Intelligence | |||
Rise in Demand for Hybrid Grains
Hybrid seed consistently delivers 15–30% yield premiums compared with open-pollinated alternatives, which motivates governments and development agencies to subsidize smallholder access in food-insecure regions.[1]Source: Alliance for a Green Revolution in Africa, “AGRA Supports Kenya's Seed Sector Transformation,” agra.org Adoption accelerated during 2024 in Kenya and Nigeria, where hybrid maize programs linked extension services with last-mile distributors. Seed companies leverage premium pricing to reinvest in trait stacking, thereby expanding portfolios that address drought, pest, and nutrient efficiency needs. Despite higher up-front costs, farmers' return on investment improves through greater marketable surplus, reinforcing a virtuous adoption cycle. Continued education around grain handling, storage, and germination remains essential so that growers capture the full genetic potential of hybrids.
Expansion of Mechanized Seed Production
Automated drying, cleaning, and optical sorting technologies reduce production costs by as much as 25%, enhancing quality uniformity and boosting corporate margins. Large facilities in Iowa, São Paulo, and Bavaria now integrate artificial intelligence modules that calibrate seed size and weight to precise planter specifications. These efficiencies encourage firms to onshore or near-shore production, mitigating logistical risk during extreme weather events. Regions with lower labor costs, such as northern Mexico and coastal Vietnam, attract green-field investments as firms balance robotics with competitive wages. Blockchain-enabled lot tracing interlocks with mechanization to certify provenance, a feature increasingly required under emerging sustainability standards.
Government Biofuel Mandates Spurring Corn Demand
The United States Renewable Fuel Standard secures a floor of 15 billion gallons of corn ethanol each year, underpinning demand for high-starch hybrids.[2]Source: U.S. Environmental Protection Agency, “Renewable Fuel Standard Program,” epa.gov Brazil’s RenovaBio program targets an 18% biofuel blend by 2028, while the European Union’s REPowerEU plan signals similar intent. These policies encourage breeders to select for traits that boost starch concentration and fermentability. Ethanol processors enter into licensing agreements that guarantee seed suppliers a price premium in exchange for predictable quality. Although biofuel targets can fluctuate with political cycles, current legislation provides a solid medium-term offtake outlook that investors view positively.
Growing Adoption of Digital Seed-Selection Platforms
Smartphone applications and web dashboards that match seed genetics with soil data register double-digit user growth, particularly among large operations in the United States Corn Belt.[3]Source: USDA National Agricultural Statistics Service, “Crop Production Report,” nass.usda.gov Seed companies embed subscription agronomy services, creating recurring revenue and deepening customer lock-in. In Europe, agritech start-ups integrate satellite imagery with localized weather forecasts to recommend in-season management tweaks, further elevating return on seed investment. While connectivity gaps persist in parts of Africa and South Asia, public-private partnerships aim to expand rural broadband, a trend that will amplify platform penetration.
Restraints Impact Analysis
| Restraint | (~) % Impact on CAGR Forecast | Geographic Relevance | Impact Timeline |
|---|---|---|---|
| Regulatory Patchwork for Transgenic Traits | -0.6% | Global, with particular complexity in EU and Asia-Pacific | Long term (≥ 4 years) |
| Counterfeit Seed Infiltration in Frontier Markets | -0.5% | Sub-Saharan Africa, Southeast Asia, and parts of South America | Medium term (2-4 years) |
| Gene-Edited Trait IP-License Bottlenecks | -0.4% | Global, affecting technology transfer and commercialization | Medium term (2-4 years) |
| Extreme-Weather-Driven Seed Production Volatility | -0.3% | Climate-sensitive production regions globally | Short term (≤ 2 years) |
| Source: Mordor Intelligence | |||
Regulatory Patchwork for Transgenic Traits
Obtaining separate approvals across jurisdictions can add USD 15–35 million per single trait, pushing smaller innovators out of the market. Fragmented rules compel companies to run parallel field trials and maintain segregated supply chains, eroding economies of scale. The European Union’s process may extend five years, compared with 24 months in the United States. Market fragmentation therefore delays farmer access to cutting-edge resilience traits. Persistent consumer skepticism toward gene-altered crops in select regions amplifies the compliance burden.
Counterfeit Seed Infiltration in Frontier Markets
International Seed Federation surveys estimate that fake seed represents 20–30% of sales in parts of Africa and Southeast Asia. Counterfeits dilute brand reputation and depress grower confidence when anticipated yields fail to materialize. Multinationals partner with customs agencies to clamp down on illegal trade, yet porous borders and limited testing capacity hinder enforcement. Mobile app verification and tamper-evident packaging are expanding, but smallholder farmers must still shoulder higher costs to access authentic seed. Until national seed laws toughen penalties, counterfeiting will continue to be a hindrance to the adoption of genuine hybrids.
Segment Analysis
By Breeding Technology: Hybrid Dominance Extends Market Leadership
The hybrid segment controlled 64.2% of the cereals and grains seed market share in 2024 and is projected to advance at a 5.44% CAGR through 2030, solidifying its position as the foundational technology platform in the cereals and grains seed market. Broad genetic diversity and trait stacking capabilities allow breeders to integrate herbicide tolerance with drought resilience in single packages, lifting average farm income even under volatile weather. Non-transgenic hybrids remain relevant in regions such as Western Europe that restrict genetically modified organism cultivation, while transgenic hybrids continue expanding in the Americas and parts of Asia. The cereals and grains seed market size for hybrids reached USD 27.7 billion in 2025 and is projected to surpass USD 35.9 billion by 2030 as more growers opt for the yield stability that hybrids provide. Open-pollinated varieties serve smallholder farmers who rely on seed saving, yet rising rainfall variability nudges even these communities toward affordable hybrid options.
Advanced analytics underpin hybrid breeding progress by compressing trait development cycles. Companies combine rapid generation advance greenhouses with genomic prediction tools to screen thousands of lines annually, improving selection accuracy. Bayer and Corteva each reported double-digit gains in editing efficiency for complex traits during 2024, signaling momentum toward multi-stacked hybrids that mitigate both abiotic and biotic stress. Public breeding institutions contribute pre-breeding germplasm, widening the genetic base and cushioning against future disease outbreaks. Despite high research costs, robust intellectual property protection in major grain exporters such as the United States incentivizes continuous investment. When resistance issues emerge, such as rising fall armyworm pressure in parts of South America, companies quickly pivot to integrate new insecticidal proteins, sustaining hybrid relevance.
Note: Segment shares of all individual segments available upon report purchase
Get Detailed Market Forecasts at the Most Granular Levels
Download PDF
By Crop: Corn Retains Primacy While Sorghum Accelerates
Corn commanded 58.5% of the cereals and grains seed market share in 2024 due to its central role in feed, fuel, and processed food chains. The cereals and grains seed market size for corn reached USD 25.3 billion in 2025, reflecting heavy investment in biofuel-tailored hybrids. Government mandates guarantee predictable demand, encouraging scaling of advanced seed production systems, which can deliver cleaner, more homogeneous kernels that suit ethanol plants. Multinationals and independent breeders alike funnel resources into developing corn lines capable of withstanding heat spikes exceeding 100 degrees Fahrenheit, a recurring threat in key states such as Kansas and Nebraska. Yield stability supports livestock feeders who require secure grain supplies for expanding poultry and pork industries.
Sorghum represents the fastest-growing crop segment at 6.04% CAGR through 2030. Its naturally low water requirement positions it as a strategic alternative in arid zones like West Texas, north-central Australia, and parts of southern Africa. Genetic gains focus on lodging resistance and grain digestibility, broadening sorghum’s appeal beyond traditional markets into specialized pet foods and gluten-free products. Hybrid rice adoption in Asia continues to rise as public–private partnerships distribute high-yielding lines to smallholders. China alone plans to boost hybrid rice acreage by 20% before 2028, anchoring demand for advanced seed. Wheat growers prioritize stripe-rust resistance, and breeders tap marker-assisted selection to stack durable resistance genes without invoking transgenic regulations, preserving European market access. Other grains, including barley, oats, and rye, serve brewing, breakfast cereal, and specialty segments, benefiting from niche hybrid programs that command premium prices due to limited supplier competition.

Note: Segment shares of all individual segments available upon report purchase
Get Detailed Market Forecasts at the Most Granular Levels
Download PDF
Geography Analysis
North America captured 36.1% cereals and grains seed market share in 2024, yet remains the fastest growing region at 6.98% CAGR through 2030. A combination of supportive regulatory frameworks under the United States Department of Agriculture (USDA) and widespread adoption of precision planters ensures rapid uptake of cutting-edge hybrids. The region’s farmers use variable-rate seeding and real-time weather analytics, maximizing the value embodied in premium seed. Cross-border collaborations among research universities, such as the Iowa State–Saskatchewan wheat genomics consortium, extend germplasm exchange and accelerate trait discovery. Seed companies double down on production capacity in the U.S. Corn Belt and Canada’s Prairie Provinces, leveraging established supply chains and robust intellectual property enforcement.
South America follows closely, driven by Brazil’s favorable biotech policies and Argentina’s aggressive adoption of drought-tolerant corn hybrids. Counter-season planting allows global firms to shorten product-development timelines by advancing generations during the Northern Hemisphere winter. Infrastructure improvements, including expanded port capacities at Santos and Rosario, reduce export bottlenecks and permit faster commercialization cycles. Local seed companies form joint ventures with multinational corporations to access trait libraries while retaining regional branding advantages. Despite occasional currency volatility, growers invest in high-tech genetics to unlock the productivity necessary for Brazil to meet its plan of exporting 60 million metric tons of corn by 2030.
Europe presents a complex picture. Stringent genetically modified regulations slow transgenic introductions, prompting breeders to pursue gene-editing techniques that avoid foreign-DNA insertion. Marker-assisted selection and speed breeding help European suppliers maintain competitiveness, though they lag behind the Americas in certain high-value traits. Farmers prioritize disease resistance and sustainability credentials, aligning with the European Union Farm to Fork Strategy. Asia-Pacific remains heterogeneous: China’s seed modernization campaign spurs hybrid corn and rice demand, while India’s smallholder structure necessitates low-volume pack sizes and extensive dealer networks. The Middle East and Africa face chronic drought and import dependence, but strategic investments by public research institutes and alliances such as the Alliance for a Green Revolution in Africa (AGRA) set the groundwork for wider adoption of climate-smart seeds over the next decade.
Get Analysis on Important Geographic Markets
Download PDF
Competitive Landscape
The cereals and grains seed market exhibits moderate concentration, with the top five suppliers controlling 42.4% of global revenue. Bayer maintains a leading position in the market by offering an integrated crop-protection and digital-agriculture suite, setting its products apart from competitors focused solely on seeds. Corteva continues to dominate U.S. corn genetics through a combination of proprietary traits and an extensive dealer network that spans thousands of retail outlets. Syngenta leverages its global research capabilities to develop hybrids suited for challenging environments, strengthening its presence in the sorghum and hybrid wheat segments.
Advancements in technology and data are reshaping the competitive landscape. Patent filings related to CRISPR seed traits have increased significantly, highlighting the growing importance of controlling editing platforms in determining future market leadership. Emerging players, often supported by venture capital, focus on synthetic biology to introduce specialized traits, such as nitrogen-fixation in cereals. Established companies are responding by launching open-innovation initiatives, enabling start-ups to test traits within advanced nurseries while retaining commercialization rights for mutually beneficial outcomes.
Regional competitors are gaining traction by collaborating with public-sector breeding programs. For instance, Europe-based seed companies such as KWS SAAT are active in China’s Hainan seed-innovation zone alongside firms such as Yuan Longping High-Tech, illustrating how global breeding expertise is being integrated into fast-emerging seed markets. In South America, Brazilian companies work closely with the Brazilian Association of Seed and Seedling Producers (ABRASEM) to streamline certification processes. Across the industry, sustainability commitments are driving investments in low-input hybrids, while traceability efforts, supported by blockchain technology, aim to assure consumers and regulators of genetic authenticity.
Cereals And Grains Seed Industry Leaders
-
Bayer AG
-
Corteva Agriscience
-
Syngenta Group
-
Advanta Seeds (UPL Ltd.)
-
KWS SAAT SE and Co. KGaA
- *Disclaimer: Major Players sorted in no particular order

Need More Details on Market Players and Competitors?
Download PDF
Recent Industry Developments
- September 2025: Valley Seeds launched two new wheat varieties, Limpopo and Zambezi, in Kwekwe to help reduce Zimbabwe’s wheat import bill for bread production. Early harvests at DCK Farms yield strong results, averaging 6.5–7 metric tons/ha, with a focus on both productivity and baking quality.
- July 2025: BASF and the Malaysian Agricultural Research and Development Institute (MARDI) introduced two Clearfield rice varieties, MR-CL3 and MR-CL4, in Malaysia. These varieties provide enhanced weed control capabilities and increased yield potential, contributing to sustainable rice production in the region.
- October 2024: Nuziveedu Seeds introduced NWS-2214 Kanak, a wheat variety for Rabi 2024 that features high yield potential, disease resistance, and superior grain quality. The variety aims to increase productivity and income for wheat farmers in India.
Global Cereals And Grains Seed Market Report Scope
Hybrids, Open Pollinated Varieties & Hybrid Derivatives are covered as segments by Breeding Technology. Corn, Rice, Sorghum, Wheat are covered as segments by Crop. Africa, Asia-Pacific, Europe, Middle East, North America, South America are covered as segments by Region.
Breeding Technology
| Hybrids | Non-Transgenic Hybrids | |
| Transgenic Hybrids | Herbicide Tolerant Hybrids | |
| Insect Resistant Hybrids | ||
| Other Traits | ||
| Open Pollinated Varieties and Hybrid Derivatives | ||
Crop
| Corn |
| Rice |
| Sorghum |
| Wheat |
| Other Grains and Cereals |
Region
| Africa | By Country | Egypt |
| Ethiopia | ||
| Ghana | ||
| Kenya | ||
| Nigeria | ||
| South Africa | ||
| Tanzania | ||
| Rest of Africa | ||
| Asia-Pacific | By Country | Australia |
| Bangladesh | ||
| China | ||
| India | ||
| Indonesia | ||
| Japan | ||
| Myanmar | ||
| Pakistan | ||
| Philippines | ||
| Thailand | ||
| Vietnam | ||
| Rest of Asia-Pacific | ||
| Europe | By Country | France |
| Germany | ||
| Italy | ||
| Netherlands | ||
| Poland | ||
| Romania | ||
| Russia | ||
| Spain | ||
| Turkey | ||
| Ukraine | ||
| United Kingdom | ||
| Rest of Europe | ||
| Middle East | By Country | Iran |
| Saudi Arabia | ||
| Rest of Middle East | ||
| North America | By Country | Canada |
| Mexico | ||
| United States | ||
| Rest of North America | ||
| South America | By Country | Argentina |
| Brazil | ||
| Rest of South America |
| Breeding Technology | Hybrids | Non-Transgenic Hybrids | |
| Transgenic Hybrids | Herbicide Tolerant Hybrids | ||
| Insect Resistant Hybrids | |||
| Other Traits | |||
| Open Pollinated Varieties and Hybrid Derivatives | |||
| Crop | Corn | ||
| Rice | |||
| Sorghum | |||
| Wheat | |||
| Other Grains and Cereals | |||
| Region | Africa | By Country | Egypt |
| Ethiopia | |||
| Ghana | |||
| Kenya | |||
| Nigeria | |||
| South Africa | |||
| Tanzania | |||
| Rest of Africa | |||
| Asia-Pacific | By Country | Australia | |
| Bangladesh | |||
| China | |||
| India | |||
| Indonesia | |||
| Japan | |||
| Myanmar | |||
| Pakistan | |||
| Philippines | |||
| Thailand | |||
| Vietnam | |||
| Rest of Asia-Pacific | |||
| Europe | By Country | France | |
| Germany | |||
| Italy | |||
| Netherlands | |||
| Poland | |||
| Romania | |||
| Russia | |||
| Spain | |||
| Turkey | |||
| Ukraine | |||
| United Kingdom | |||
| Rest of Europe | |||
| Middle East | By Country | Iran | |
| Saudi Arabia | |||
| Rest of Middle East | |||
| North America | By Country | Canada | |
| Mexico | |||
| United States | |||
| Rest of North America | |||
| South America | By Country | Argentina | |
| Brazil | |||
| Rest of South America | |||
Need A Different Region or Segment?
Customize Now
Market Definition
- Commercial Seed - For the purpose of this study, only commercial seeds have been included as part of the scope. Farm-saved Seeds, which are not commercially labeled are excluded from scope, even though a minor percentage of farm-saved seeds are exchanged commercially among farmers. The scope also excludes vegetatively reproduced crops and plant parts, which may be commercially sold in the market.
- Crop Acreage - While calculating the acreage under different crops, the Gross Cropped Area has been considered. Also known as Area Harvested, according to the Food & Agricultural Organization (FAO), this includes the total area cultivated under a particular crop across seasons.
- Seed Replacement Rate - Seed Replacement Rate is the percentage of area sown out of the total area of crop planted in the season by using certified/quality seeds other than the farm-saved seed.
- Protected Cultivation - The report defines protected cultivation as the process of growing crops in a controlled environment. This includes greenhouses, glasshouses, hydroponics, aeroponics, or any other cultivation system that protects the crop against any abiotic stress. However, cultivation in an open field using plastic mulch is excluded from this definition and is included under open field.
| Keyword | Definition |
|---|---|
| Row Crops | These are usually the field crops which include the different crop categories like grains & cereals, oilseeds, fiber crops like cotton, pulses, and forage crops. |
| Solanaceae | These are the family of flowering plants which includes tomato, chili, eggplants, and other crops. |
| Cucurbits | It represents a gourd family consisting of about 965 species in around 95 genera. The major crops considered for this study include Cucumber & Gherkin, Pumpkin and squash, and other crops. |
| Brassicas | It is a genus of plants in the cabbage and mustard family. It includes crops such as carrots, cabbage, cauliflower & broccoli. |
| Roots & Bulbs | The roots and bulbs segment includes onion, garlic, potato, and other crops. |
| Unclassified Vegetables | This segment in the report includes the crops which don’t belong to any of the above-mentioned categories. These include crops such as okra, asparagus, lettuce, peas, spinach, and others. |
| Hybrid Seed | It is the first generation of the seed produced by controlling cross-pollination and by combining two or more varieties, or species. |
| Transgenic Seed | It is a seed that is genetically modified to contain certain desirable input and/or output traits. |
| Non-Transgenic Seed | The seed produced through cross-pollination without any genetic modification. |
| Open-Pollinated Varieties & Hybrid Derivatives | Open-pollinated varieties produce seeds true to type as they cross-pollinate only with other plants of the same variety. |
| Other Solanaceae | The crops considered under other Solanaceae include bell peppers and other different peppers based on the locality of the respective countries. |
| Other Brassicaceae | The crops considered under other brassicas include radishes, turnips, Brussels sprouts, and kale. |
| Other Roots & Bulbs | The crops considered under other roots & bulbs include Sweet Potatoes and cassava. |
| Other Cucurbits | The crops considered under other cucurbits include gourds (bottle gourd, bitter gourd, ridge gourd, Snake gourd, and others). |
| Other Grains & Cereals | The crops considered under other grains & cereals include Barley, Buck Wheat, Canary Seed, Triticale, Oats, Millets, and Rye. |
| Other Fibre Crops | The crops considered under other fibers include Hemp, Jute, Agave fibers, Flax, Kenaf, Ramie, Abaca, Sisal, and Kapok. |
| Other Oilseeds | The crops considered under other oilseeds include Ground nut, Hempseed, Mustard seed, Castor seeds, safflower seeds, Sesame seeds, and Linseeds. |
| Other Forage Crops | The crops considered under other forages include Napier grass, Oat grass, White clover, Ryegrass, and Timothy. Other forage crops were considered based on the locality of the respective countries. |
| Pulses | Pigeon peas, Lentils, Broad and horse beans, Vetches, Chickpeas, Cowpeas, Lupins, and Bambara beans are the crops considered under pulses. |
| Other Unclassified Vegetables | The crops considered under other unclassified vegetables include Artichokes, Cassava Leaves, Leeks, Chicory, and String beans. |
Need More Details on Market Definition?
Ask a Question
Research Methodology
Mordor Intelligence follows a four-step methodology in all our reports.
- Step-1: IDENTIFY KEY VARIABLES: In order to build a robust forecasting methodology, the variables and factors identified in Step-1 are tested against available historical market numbers. Through an iterative process, the variables required for market forecast are set and the model is built on the basis of these variables.
- Step-2: Build a Market Model: Market-size estimations for the forecast years are in nominal terms. Inflation is not a part of the pricing, and the average selling price (ASP) is kept constant throughout the forecast period.
- Step-3: Validate and Finalize: In this important step, all market numbers, variables and analyst calls are validated through an extensive network of primary research experts from the market studied. The respondents are selected across levels and functions to generate a holistic picture of the market studied.
- Step-4: Research Outputs: Syndicated Reports, Custom Consulting Assignments, Databases, and Subscription Platforms

Get More Details On Research Methodology
Download PDF


