
Ceramic Membranes Market Size and Share
Market Overview
| Study Period | 2021 - 2031 |
|---|---|
| Market Size (2026) | USD 9.62 Billion |
| Market Size (2031) | USD 14.68 Billion |
| Growth Rate (2026 - 2031) | 8.82 % |
| Fastest Growing Market | Asia Pacific |
| Largest Market | Asia Pacific |
| Market Concentration | Medium |
Major Players *Disclaimer: Major Players sorted in no particular order Image © Mordor Intelligence. Reuse requires attribution under CC BY 4.0. | |
Ceramic Membranes Market Analysis by Mordor Intelligence
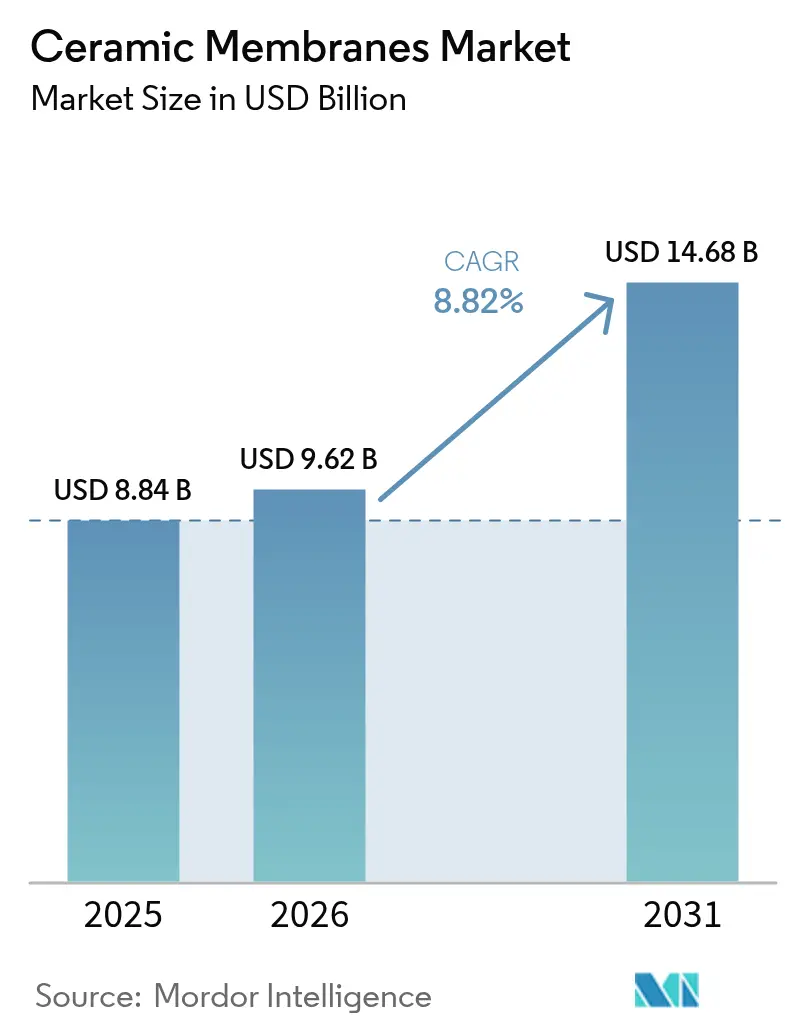
The Ceramic Membranes Market size is expected to increase from USD 8.84 billion in 2025 to USD 9.62 billion in 2026 and reach USD 14.68 billion by 2031, growing at a CAGR of 8.82% over 2026-2031. Accelerating adoption follows three converging streams: utilities are replacing aging polymeric systems to comply with tighter nutrient-discharge limits, dairy processors are switching to alumina and titania tubes to cut energy use in protein concentration, and Asian semiconductor fabs are installing silicon-carbide modules to recycle ultrapure water from chemical-mechanical planarization. In parallel, regional content rules inside China and India are spurring domestic production, while Europe’s impending PVDF restrictions tilt specifications toward all-inorganic membranes. Saudi Arabia has begun large-scale retrofits of desalination pretreatment, confirming the technology’s value in harsh, high-salinity streams. Taken together, these shifts give the ceramic membrane market a resilient double-digit demand runway, even as polymeric competitors defend low-TDS niches.
Key Report Takeaways
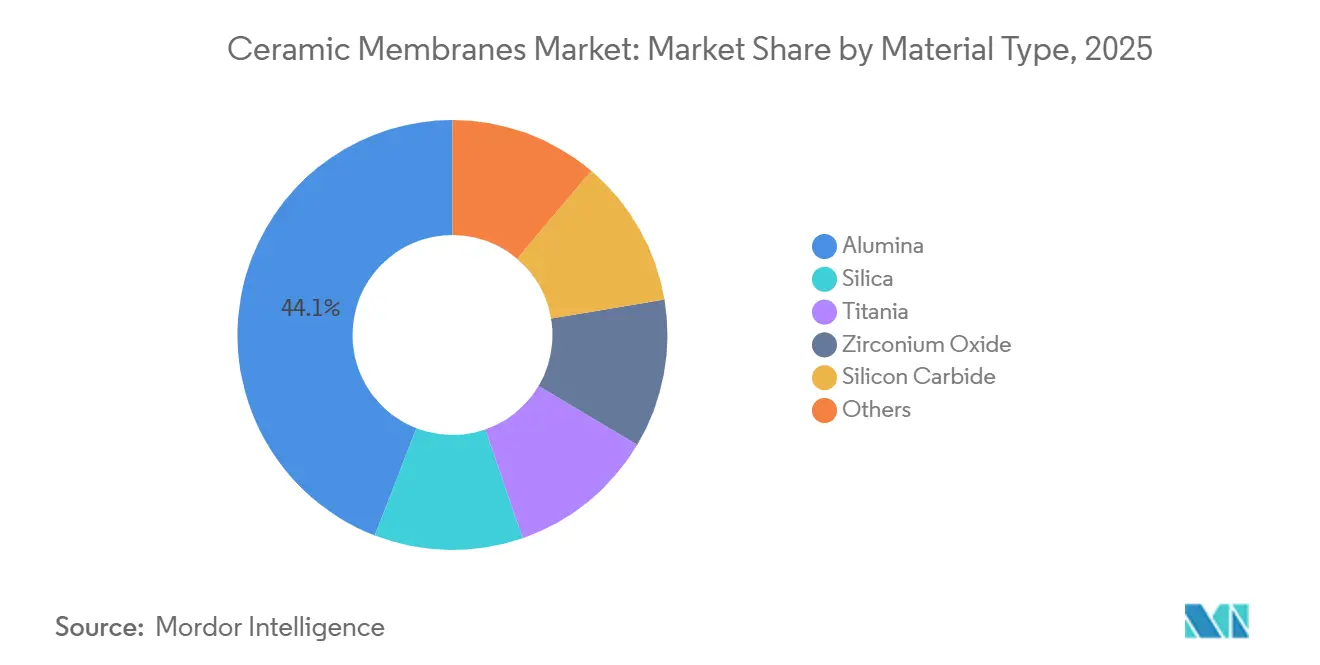
- By material type, alumina captured 44.12% of the ceramic membranes market share in 2025, whereas titania variants are forecast to grow at a 9.80% CAGR to 2031.
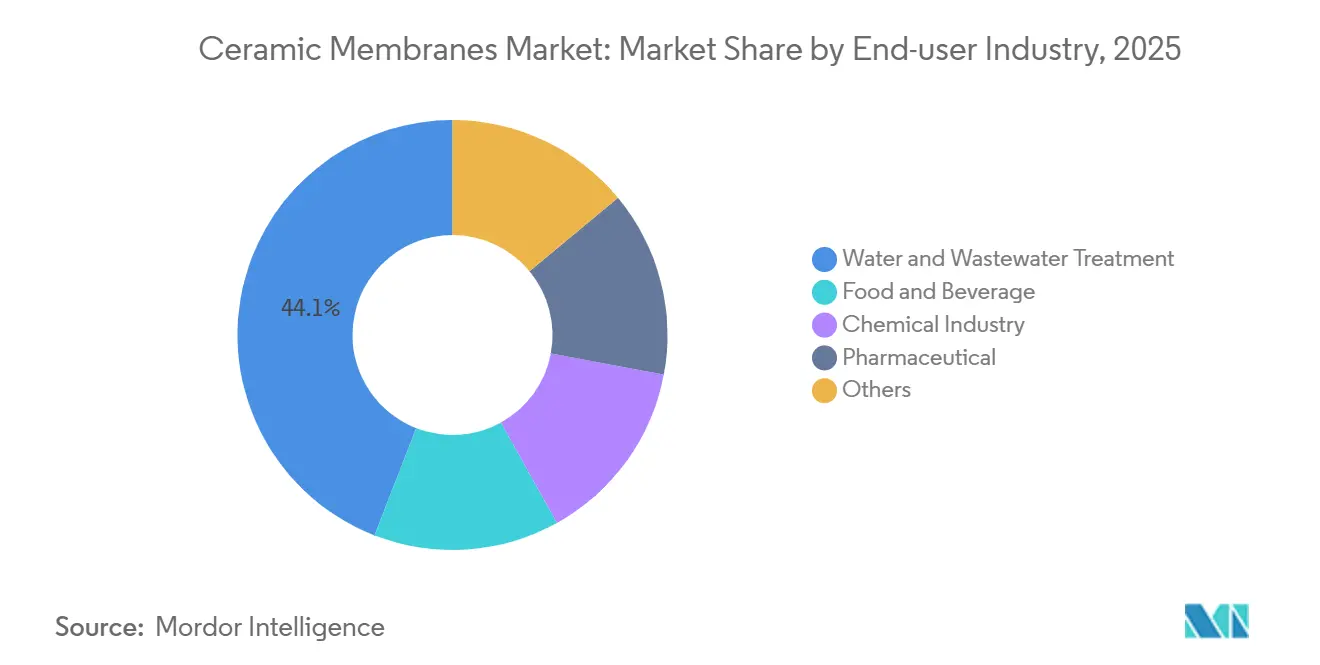
- By end-user industry, water and wastewater treatment led with 44.10% revenue share in 2025, while food and beverage processing is projected to expand at a 9.65% CAGR through 2031.
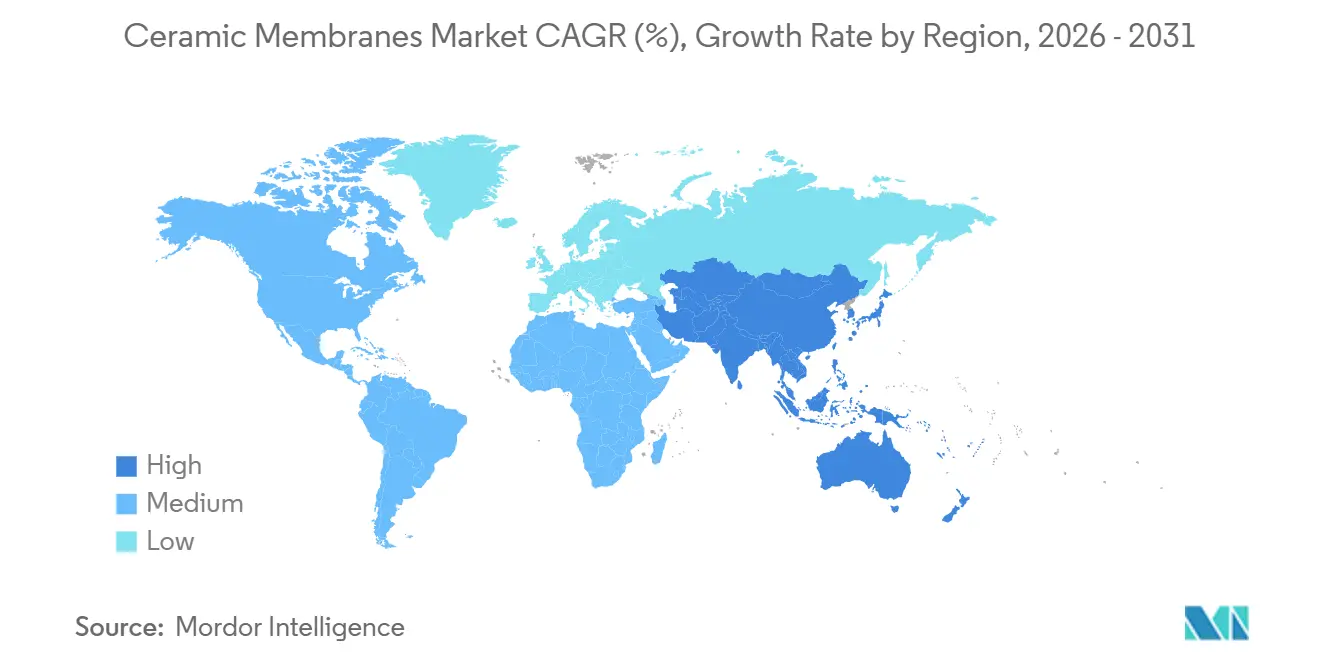
- By geography, Asia-Pacific accounted for 52.98% of the ceramic membranes market size in 2025 and is advancing at a 10.02% CAGR through 2031.
Note: Market size and forecast figures in this report are generated using Mordor Intelligence’s proprietary estimation framework, updated with the latest available data and insights as of 2026.
Market Trends and Insights
Drivers Impact Analysis of Ceramic Membranes Market*
| Driver | (~) % Impact on CAGR Forecast | Geographic Relevance | Impact Timeline |
|---|---|---|---|
| Rising Demand for Water & Wastewater Treatment Infrastructure | +2.8% | Global, focused in APAC and Middle East | Long term (≥ 4 years) |
| Stringent Industrial Effluent Regulations Worldwide | +2.1% | North America, EU, China | Medium term (2–4 years) |
| Longer Service-Life & Lower Lifecycle Cost vs. Polymeric Membranes | +1.6% | Global, early adoption in EU and North America | Medium term (2–4 years) |
| Expansion of Dairy & Beverage Protein-Concentration Processes | +1.4% | North America, EU, APAC | Short term (≤ 2 years) |
| Pending PVDF-Based Membrane Restrictions Driving Ceramic Adoption | +0.9% | EU core, spillover to North America | Short term (≤ 2 years) |
| Source: Mordor Intelligence | |||
Rising Demand for Water & Wastewater Treatment Infrastructure
Emerging-economy governments are funding decentralized systems that operate with minimal operator input. India’s Jal Jeevan Mission allocated USD 50 billion to rural water supply and specified ceramic microfiltration for 60% of new installations because backwash intervals stretch to 72 hours versus 24 hours for polymeric cartridges[1]. China’s zero-liquid-discharge mandate for coal-chemical parks drove 1.8 million m² of ceramic area installations across 340 plants in 2024–2025. Middle-Eastern plants, such as ACWA Power’s Taweelah facility, now front-load RO with 120,000 m² of alumina tubes, cutting chemical dosing by 35%. U.S. nutrient-removal retrofits in Maryland and Virginia adopted ceramic membranes to meet 3 mg/L total nitrogen limits without footprint expansion. Collectively, these programs lift public-sector spending, anchoring longer-term demand for the ceramic membrane market.
Stringent Industrial Effluent Regulations Worldwide
Across regions, regulators are tightening discharge limits that polymeric systems struggle to meet. The US EPA’s 2024 Organic-Chemicals ELGs limit BOD to 10 mg/L and turbidity to 0.5 NTU; ceramic membranes comply without flocculation, avoiding sludge-haul costs that exceed USD 80 per dry ton. Europe’s revised Industrial Emissions Directive now favors cleaning-in-place cycles under 30 minutes, a benchmark ceramics reach with 2% caustic at 80°C[2]. China’s pharmaceutical standard GB 31962-2015 caps COD at 50 mg/L, prompting 22 API plants in Zhejiang to switch to ceramic units in 2025 to avoid CNY 500,000 penalties per incident. These simultaneous policy moves add a durable 2.1-point lift to the forecast CAGR for the ceramic membrane market.
Longer Service-Life & Lower Lifecycle Cost vs. Polymeric Membranes
Lifecycle assessments increasingly tilt toward ceramics when downtime and replacement cycles enter the equation. A 2025 Water Research Foundation study comparing 1,000 m³/day municipal plants found ceramic systems needed USD 320,000 in membrane replacements over 10 years, compared with USD 890,000 for polymeric hollow-fibers. Lower hydraulic resistance lets ceramic membranes run at 0.15-0.25 kWh/m³, roughly half the polymeric range. Durability also translates into cheaper insurance; Munich Re’s 2025 guidelines assign lower business-interruption risk, trimming premiums 15–20 basis points. These cost vectors collectively reinforce the total-cost leadership that underpins the ceramic membrane market.
Expansion of Dairy & Beverage Protein-Concentration Processes
Food processors are shifting from thermal to membrane separations to decarbonize operations. Arla Foods cut steam use by 60% when it installed a four-stage ceramic ultrafiltration line in early 2025. Oat-drink makers rely on titania ceramics that maintain flux for 30-day campaigns where polymers foul in hours. Orders for ceramic membrane skids in food applications climbed 28% year-on-year in GEA Group’s 2025 results. FDA allergen-control guidance recommending validated 10 ppm residual-protein cleaning favors ceramic elements that tolerate high-temperature caustic. These processes and regulatory tailwinds feed a short-term boost in the ceramic membrane market.
Restraints Impact Analysis of Ceramic Membranes Market*
| Restraint | (~) % Impact on CAGR Forecast | Geographic Relevance | Impact Timeline |
|---|---|---|---|
| Prevalence of Low-Pressure Polymeric Alternatives in Low-TDS Uses | -1.20% | Global, concentrated in North America and EU for municipal applications | Medium term (2-4 years) |
| Limited Operator Expertise at Municipal Utilities | -0.80% | Emerging markets (India, Southeast Asia, Africa), spillover to smaller North American utilities | Long term (≥ 4 years) |
| Scarcity of Large-Scale Ceramic Tube Suppliers Outside Asia | -0.70% | North America, Europe, South America, Middle East-Africa; minimal impact in APAC | Medium term (2-4 years) |
| Source: Mordor Intelligence | |||
Prevalence of Low-Pressure Polymeric Alternatives in Low-TDS Uses
In low-turbidity surface water, polymeric hollow-fiber capital still undercuts ceramics. A 2025 American Water Works Association survey put polymeric microfiltration at USD 420 per m³/day versus USD 680 for ceramics. New PES modules tolerate 500 ppm sodium hypochlorite, narrowing the chemical-resistance gap. Sixty-two percent of North American utilities in a 2025 Water Environment Federation poll ranked the lowest 10-year NPV above the longest life. Retrofitting older low-pressure plants can add USD 150,000–300,000 in ancillary upgrades per train, muting the ceramic membrane market’s near-term upside in these settings.
Limited Operator Expertise at Municipal Utilities
Backwash and chemical-clean cycles for ceramics differ markedly from polymers, yet training lags deployment. The International Water Association reported flux losses exceeding 40% within two years at 18 plants in India and Indonesia, where operators used room-temperature caustic. Workforce shortfalls loom: the US Bureau of Labor Statistics forecasts a 6% decline in water-plant operators by 2032. Vendor-supplied remote-monitoring platforms exist, but only 30% of utilities fund the needed IT backbone. Procurement inertia compounds the issue; 40% of Southeast-Asian tenders still write in polymeric membranes by default, even when lifecycle analytics point the other way. The resulting knowledge gap shaves 0.8 points off the ceramic membrane market’s CAGR.
*Our forecasts treat driver/restraint impacts as directional, not additive. The impact forecasts reflect baseline growth, mix effects, and variable interactions.
Ceramic Membranes Market Segment Analysis
By Material Type:
Alumina Dominance Meets Titania’s Niche SurgeAlumina captured 44.12% of 2025 revenue, making it the anchor of the ceramic membrane market share. Silicon-carbide follows in abrasive service, but titania variants are set to grow fastest at 9.80% CAGR on semiconductor and pharma demand for 50 nm cut-offs. The ceramic membrane market size for alumina-based elements is projected to reach USD 6.5 billion by 2031 as domestic Chinese capacity pushes unit prices below USD 200/m². Cost differentials persist, titania commands USD 320–400/m² due to phase-control firing, yet its photocatalytic self-cleaning provides a premium in high-purity operations. Emerging glass-ceramic composites promise mid-range cost and broad pH tolerance, hinting at future share redistribution.
Price and durability advantages keep alumina firmly ahead through 2031, but the application mix is diversifying. Silicon-carbide’s Mohs 9.5 hardness makes it indispensable for mining tailings and shale-gas produced water. Zirconia serves solvent-rich organic nanofiltration, though its yttria stabilization cost caps volume under 6%. ISO 19749 test updates covering photocatalytic activity will help titania suppliers differentiate on fouling resistance, maintaining a high single-digit growth trajectory inside the ceramic membrane market.

By End-User Industry:
Water Treatment Anchors, Food Processing AcceleratesWater and wastewater treatment held 44.10% revenue in 2025 as utilities raced to meet nutrient and metal effluent rules. The ceramic membrane market size for municipal service is expected to hit USD 7.2 billion by 2031, with Asia-Pacific upgrades driving half that total. Desalination pretreatment remains pivotal; removing colloidal silica before RO extends element life from five to eight years and halves chemical cleans, an ROI that utilities in the Gulf now quantify at USD 0.07 per m³ saved.
Food and beverage lines are growing quicker, clocking a 9.65% CAGR through 2031. Craft breweries that swapped diatomaceous-earth filters for ceramic crossflow cut batch filtration from six hours to 90 minutes and eliminated hazardous filter-aid waste, confirming payback under three years. Whey-protein and plant-protein isolators leverage ceramics’ 95°C wash resilience to ensure allergen-clean surfaces. On balance, nutrient extraction and beverage clarification will push the ceramic membrane market past USD 3 billion in F&B revenue alone by 2031, closing the gap with municipal demand.
Geography Analysis
APAC Ceramic Membranes Market
Asia-Pacific held 52.98% of 2025 revenue and will grow at 10.02% CAGR through 2031 on synchronized infrastructure build-outs, stricter discharge limits, and localized manufacturing. China’s 14th Five-Year Plan earmarked CNY 180 billion for industrial wastewater upgrades, and domestic suppliers such as JIUWU now quote 30% below imports. India’s Jal Jeevan Mission specs ceramics for 60% of village plants, raising the ceramic membrane market’s addressable volume across South Asia. Japan, South Korea, and Taiwan fund high-reuse industrial parks, further cementing regional dominance.
North America Ceramic Membranes Market
North America’s 2025 market share was lifted by Clean Water Act compliance, Indigenous water-system funding, and shale-gas produced-water recycling. Milwaukee, Newark, and Flint pilot ceramic plants to remove particulate lead, potentially opening a USD 900 million municipal retrofit pool by 2028. Canada’s CAD 1.9 billion remote-community program likewise favors ceramics thanks to freeze-thaw durability. Mexico’s Bajío industrial corridor added 14 ceramic wastewater plants in 2025, cementing a continental manufacturing-hub trend.
EMEA and LATAM Ceramic Membranes Market
Europe’s 2025 market value was impacted by regulatory momentum trumping budget headwinds. Germany subsidizes Baltic runoff nutrient removal, the UK funds AMP8 phosphorus cuts, and the Netherlands fast-tracks PVDF swap-outs. Southern Europe lags on capex, but high-salinity niches still pull in ceramic bids. Latin America and Middle East-Africa together form a 7% sliver, yet billion-dollar desalination retrofits in Saudi Arabia and UAE telegraph high-growth pockets inside the global ceramic membrane market.
Regulatory Landscape
Regulatory frameworks continue to tighten around water-quality outcomes and materials used in contact with drinking water. In the European Union, Regulation (EU) 2024/370 and Implementing Decision (EU) 2024/368 establish a common hygiene and conformity-assessment regime for materials in contact with drinking water, with national rules transitioning to this framework by December 31, 2026. In the United States, drinking-water membrane approvals for pathogen control reference EPA guidance under LT2ESWTR, where ceramic membranes used for Cryptosporidium removal must pass challenge testing and align with NSF/ANSI 419 in utility specifications. China and other markets are formalizing technical requirements through standards such as GB/T 37795-2019, GB/T 39717-2020, and industry group T/CAEPI 44-2022, supported by REACH and RoHS to shape material selection and documentation.
Value Chain Analysis
The ceramic membranes value chain begins with mineral inputs like kaolin and high-purity alumina, followed by powder processing, forming, and high-temperature sintering. For large-diameter tubular formats, pressing and firing capacity are key bottlenecks, which tends to favor producers with in-house capability. Finishing, module assembly, and testing (with qualification mapped to ISO/ASTM-linked requirements) complete the qualification cycle. Downstream, OEMs, EPCs, and system integrators compete for membrane modules and complete packages, with regionalized supply networks helping reduce trade risk. Manufacturing clusters in Jiangsu and Shandong support domestic output, while service capabilities such as commissioning, operator training, remote monitoring, and spares influence lifecycle costs and customer satisfaction.
Competitive Landscape
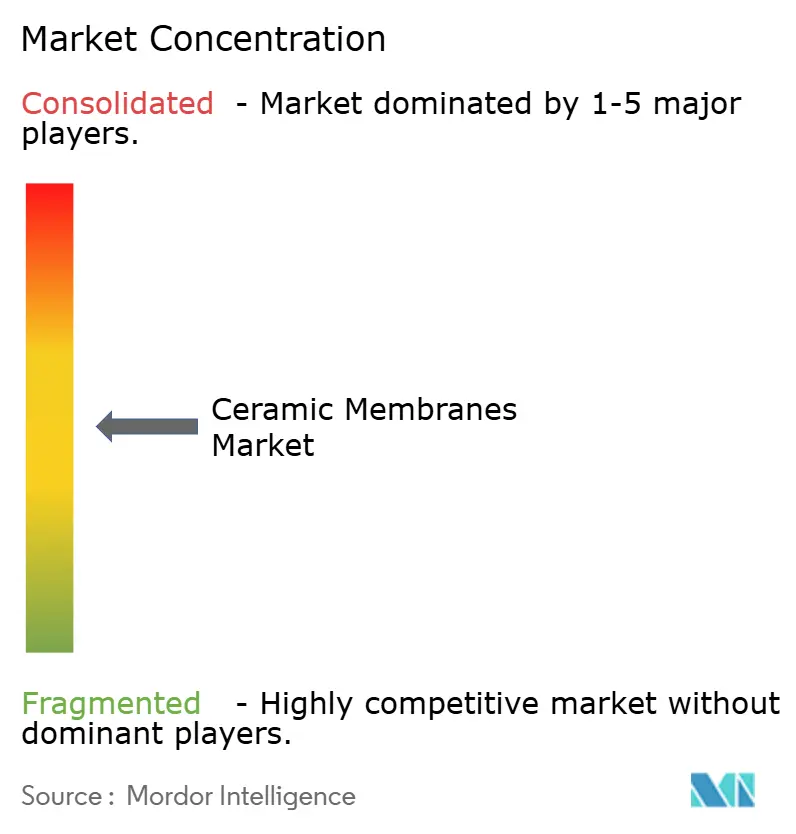
The ceramic membranes market is moderately concentrated. Strategic activity centers on vertical integration and advanced coatings. GEA bought 30% of Atech Innovations in 2024 to secure glass-ceramic formulations that cut costs by 20%. Patent filings climbed to 47 in 2025 at the European Patent Office, half focusing on anti-fouling surface layers. Start-ups such as Mantle pilot 3D-printed gradient-porosity membranes that boost flux 40%, although costs remain double conventional sintering. Procurement now insists on ISO 19749 and ASTM D6908 compliance, favoring incumbents with in-house test rigs and shortening the addressable window for unverified newcomers.
Ceramic Membranes Industry Leaders
-
JIUWU HI-TECH
-
LiqTech Holding A/S
-
Pall Corporation
-
Saint-Gobain
-
Veolia
- *Disclaimer: Major Players sorted in no particular order
Ceramic Membranes Market Companies Covered in this Report
- ALSYS
- atech innovations GmbH
- Ceraflo Pte Ltd
- GEA Group Aktiengesellschaft
- JIUWU HI-TECH
- Kovalus Separation Solutions
- LiqTech Holding A/S
- Membracon
- METAWATER. CO. LTD
- Nanostone
- Pall Corporation
- Qua Group LLC
- Saint-Gobain
- Sterlitech Corporation
- TAMI Industries
- Veolia
Market Opportunities and Future Outlook
Municipal drinking-water retrofits and capacity additions are expanding the addressable market for ceramic ultrafiltration, especially where utilities prioritize long membrane life, resilience to variable turbidity, and tolerance for high-temperature and chemical cleaning. In June 2026, Maynilad Water Services awarded Acuriant phase one of a 100 MLD ceramic UF retrofit at Putatan Water Treatment Plant 1 in the Philippines (initial 50 MLD phase). The staged approach underscores how ceramics can upgrade existing treatment trains without expanding footprint.
Industrial reuse and sector-specific adoption are also gaining traction where chemical compatibility and cleaning tolerance translate into total-cost advantages. Partnerships and localized pilot infrastructure are being used to move interest into repeatable specifications, including the May 2026 step by Cerafiltec to reactivate and expand its partnership with SI Membranes, along with investment in additional testing and pilot equipment in South Korea. Across regions, tightening discharge and water-reuse targets create whitespace for integrated ceramic solutions in high-fouling streams such as pulp and paper, brine and chlor-alkali pre-treatment, and high-purity industrial water loops. The EU drinking-water contact materials transition to the new conformity framework by end-2026 further increases near-term qualification and documentation requirements for suppliers targeting regulated municipal applications.
Recent Industry Developments in Ceramic Membranes Market
- June 2026: Maynilad Water Services awarded Acuriant Technologies phase one of a 100 MLD ceramic ultrafiltration retrofit at Putatan Water Treatment Plant 1 in the Philippines. The initial phase covers 50 MLD, positioning ceramics as a practical retrofit path for large municipal plants managing footprint and reliability constraints. The contract also strengthens the role of reference projects and staged expansions in accelerating ceramic UF procurement.
- April 2026: LiqTech Holding A/S expanded its commercial ceramic membrane portfolio through a strategic partnership with Lotec and secured its largest QlariFlow silicon carbide ceramic membrane project to date in Den Helder, Netherlands. The deployment broadens LiqTechs channel access and provides a high-profile reference for high-flow membrane systems.
- March 2026: JIUWU HI-TECH introduced an integrated zero liquid discharge treatment system for the pulp and paper industry that uses membrane-based concentration. The launch aligns ceramic membranes with high-recovery industrial water loops where chemical robustness and stable flux are central operating requirements. It supports a shift toward packaged solutions that combine membranes with process integration, strengthening vendor differentiation beyond element supply.
Ceramic Membranes Market Report Scope and Research Methodology
Market Definition and Coverage
This market covers revenues earned from ceramic membrane products sold for separation and filtration duties, where an inorganic porous structure is used to treat liquids or process streams across industrial and municipal settings.
Scope exclusions: We do not count downstream EPC project value, installation labor, or ongoing plant operations services unless they are priced and sold as part of the ceramic membrane product offering.
Segments Covered in This Report
- By Material Type
- Alumina
- Silica
- Titania
- Zirconium Oxide
- Silicon Carbide
- Others (Glassy Materials, Magnesia, carbon, Glass-Ceramic composites, etc.)
- By End-user Industry
- Water and Wastewater Treatment
- Food and Beverage
- Chemical Industry
- Pharmaceutical
- Others (Biotechnology, Textile, Petrochemical, etc.)
- By Geography
- Asia-Pacific
- China
- India
- Japan
- South Korea
- Malaysia
- Thailand
- Indonesia
- Vietnam
- Rest of Asia-Pacific
- North America
- United States
- Canada
- Mexico
- Europe
- Germany
- United Kingdom
- France
- Italy
- Spain
- NORDIC Countries
- Turkey
- Russia
- Rest of Europe
- South America
- Brazil
- Argentina
- Colombia
- Rest of South America
- Middle-East and Africa
- Saudi Arabia
- Qatar
- United Arab Emirates
- Nigeria
- Egypt
- South Africa
- Rest of Middle-East and Africa
- Asia-Pacific
Data Sources, Market Sizing, and Validation
Desk Research
Desk work starts with building the demand context for ceramic membranes and the adjacent filtration choices that can replace them. We review public sources such as US EPA and local water authority publications, Eurostat and national statistics offices, UN Comtrade trade data, and OECD industrial indicators to understand wastewater loads, industrial output, and investment direction.
After that, we add technical and adoption signals from peer reviewed journals on membrane filtration performance and fouling behavior, patent databases that indicate material and module innovation, and trade association updates from water and process industries. Company annual reports, investor decks, and product catalogs are also used to map typical module formats, end use mentions, and pricing logic. We then use a paid subscription for company financials and news to cross-check revenue exposure and the timing of capacity moves. These sources are illustrative only, and many other public documents and datasets were also used for data collection, validation, and clarification.
Primary Interviews and Surveys
Primary work is used to pressure test assumptions that cannot be read directly from public datasets, such as typical replacement cycles, utilization patterns in harsh duty filtration, and the share of demand that comes from module retrofits versus new builds. We spoke with a mix of manufacturers, channel partners, integrators, and end users across water and wastewater, chemicals, food and beverage, and pharmaceuticals, and we checked for regional differences across major consuming hubs before finalizing the model.
Distribution of primary research fieldwork respondents
| Company type | Respondent position | Region |
|---|---|---|
| Top tier: 31% | CXOs: 19% | APAC: 46% |
| Mid tier: 49% | Functional/Unit leaders: 29% | EMEA: 30% |
| Smaller Players: 20% | Managers: 52% | Americas: 24% |
Market-Sizing & Forecasting
The sizing starts with a top-down build that reconstructs addressable spend from water treatment investment and industrial filtration demand pools, then narrows to the share where ceramic membranes are technically favored. We track inputs including municipal and industrial wastewater treatment additions, desalination and reuse project momentum, chemical and pharmaceutical processing output, and observed shifts in discharge standards that drive upgrades.
To keep the totals realistic, we corroborate the result using selective bottom-up checks, such as sampled module ASP ranges multiplied by implied shipment volumes and channel checks on replacement rates in common use cases. When disclosure is thin for a country, we bridge gaps using proxy indicators like installed treatment capacity growth and industrial production indices, and we then recheck the implied per plant spend with interview feedback.
For forecasting, scenario analysis is applied around the variables that move fastest, such as regulation driven capex cycles, industrial capacity utilization, and cost progression for ceramic materials and module manufacturing. The final curve is adjusted only after expert feedback aligns on adoption pace in water and wastewater versus process industries, which is where the mix can shift the revenue outcome the most.
Data Validation & Update Cycle
Outputs are validated through triangulation across independent signals, so the modeled totals are checked against trade movements, visible project pipelines, and the implied intensity of membrane spend per treatment capacity added. If a regional value moves beyond what those signals can support, the drivers are revisited, and follow-up calls are triggered to confirm whether it is a real step change or a modeling artifact.
Before sign-off, the model goes through multi-step analyst reviews where assumptions, unit economics, and growth logic are cross-verified, and key calculations are reworked to avoid hidden formula errors. The report is refreshed annually, and interim updates are made when material events occur, such as policy shifts, major capacity expansions, or sharp changes in input costs. Right before delivery, a fresh validation pass is done so clients receive the most current view available.
Mordor Intelligence's Ceramic Membranes Market Size Compared Against Other Published Estimates
Published numbers for ceramic membranes can vary even when the topic appears identical, since teams do not always count the same revenue items, time the currency conversion the same way, or use the same demand indicators for adoption. Differences also come from how each model handles replacement demand, how much water and wastewater demand is actually addressable by ceramics, and how often assumptions are revisited.
Some published figures tend to bundle broader filtration system value or related separation equipment into the same headline total, which inflates the number before the forecast even starts. In Mordor Intelligence, ceramic membrane revenue is counted at the product level (modules and related membrane elements), and it is tied back to end-use demand triggers like treatment capacity additions, industrial output, and realistic replacement cycles instead of assuming uniform penetration.
Benchmark comparison
| Source | Market Size | Gaps in Research Methodology |
|---|---|---|
| Mordor Intelligence | USD 8.84 B (2025) | |
| Global Consultancy A | USD 10.67 B (2024) | Uses an earlier base year and can reflect a faster assumed ramp in industrial processing adoption, which shifts the mix toward higher priced applications sooner than field checks typically confirm. |
| Industry Publisher B | USD 12.26 B (2025) | Often applies a wider application and technology perimeter and may include more system level value, which raises the 2025 total even if ceramic membrane element volumes do not move at the same rate. |
The spread in the table is mainly explained by what gets counted and how adoption is scaled across water projects and process industries. By keeping inputs traceable to capacity additions, regulation signals, and replacement behavior, the model remains easier to replicate and simpler to audit when new information arrives.
Key Questions Answered in the Report
How fast is the ceramic membranes market expected to grow between 2026 and 2031?
The market is projected to rise from USD 9.62 billion in 2026 to USD 14.68 billion in 2031, reflecting an 8.78% CAGR driven by regulatory mandates and infrastructure upgrades.
Which region contributes the largest revenue to ceramic filtration solutions?
Asia-Pacific held 52.98% of 2025 revenue and is on track for the fastest 10.02% CAGR, supported by industrial growth and extensive municipal water investments.
What material currently leads commercial adoption in filtration modules?
Alumina-based elements maintain 44.12% share thanks to mature manufacturing economics and versatile performance across municipal and industrial duties.
Why are food and beverage processors accelerating ceramic membrane purchases?
Ceramic microfiltration withstands hot cleaning and sustains high protein-rejection rates, enabling efficient whey processing and cold-pasteurization without compromising product safety.
Which companies are making notable strategic moves in this space?
Saint-Gobain pushes silicon-carbide technology for oil-produced water, LiqTech targets marine and industrial reuse with flat-sheet designs, and NGK partners with MHI for bioethanol dehydration systems.