
Cell Therapy Market Size and Share
Market Overview
| Study Period | 2020 - 2031 |
|---|---|
| Market Size (2026) | USD 6.55 Billion |
| Market Size (2031) | USD 14.56 Billion |
| Growth Rate (2026 - 2031) | 17.32 % |
| Fastest Growing Market | Asia Pacific |
| Largest Market | North America |
| Market Concentration | Medium |
Major Players *Disclaimer: Major Players sorted in no particular order Image © Mordor Intelligence. Reuse requires attribution under CC BY 4.0. | |
Cell Therapy Market Analysis by Mordor Intelligence
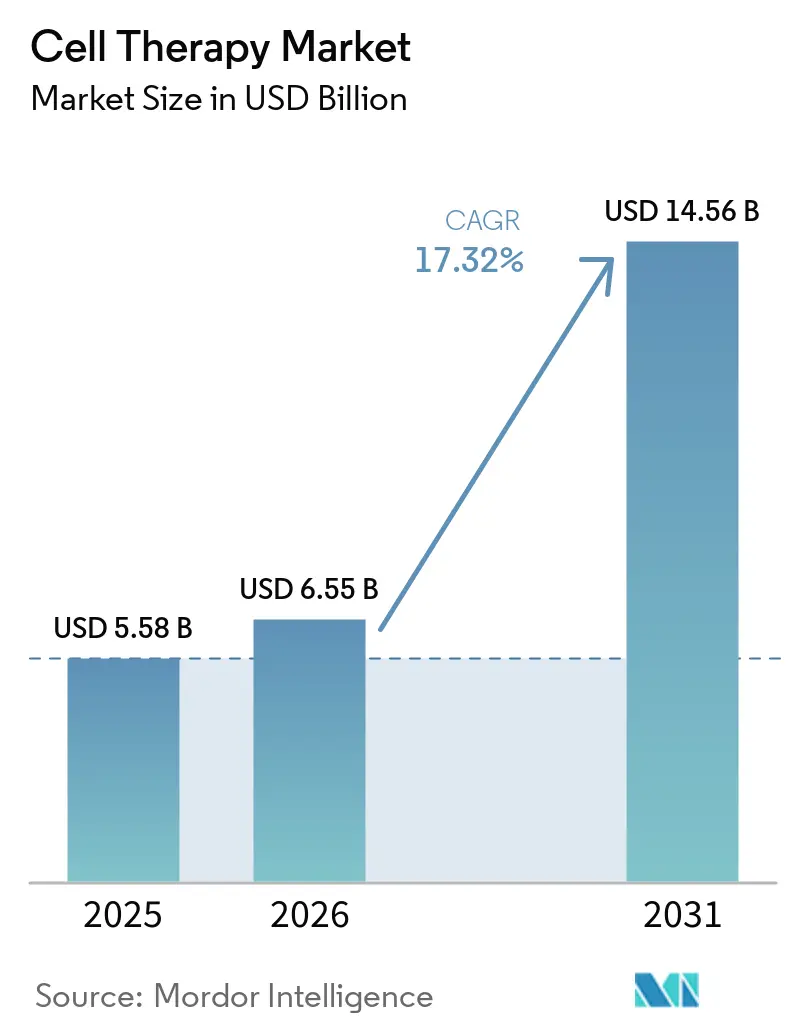
The Cell Therapy Market size is expected to increase from USD 5.58 billion in 2025 to USD 6.55 billion in 2026 and reach USD 14.56 billion by 2031, growing at a CAGR of 17.32% over 2026-2031.
Rising approvals for autologous chimeric antigen receptor T-cell (CAR-T) products, the pivot toward allogeneic platforms, and new reimbursement pathways in the United States, Europe, and Asia-Pacific are widening patient access and shortening time-to-revenue cycles. Contract development and manufacturing organizations (CDMOs) added 180,000 liters of allogeneic capacity between 2024 and 2025, cutting clinical-grade lead times from 8 weeks to 3 weeks and lowering production costs significantly. Medicare’s New Technology Add-on Payment (NTAP) program in the United States has reduced hospital exposure by covering up to 65% of costs above the diagnosis-related group rate for 11 cell therapies, encouraging provider adoption.
Key Report Takeaways
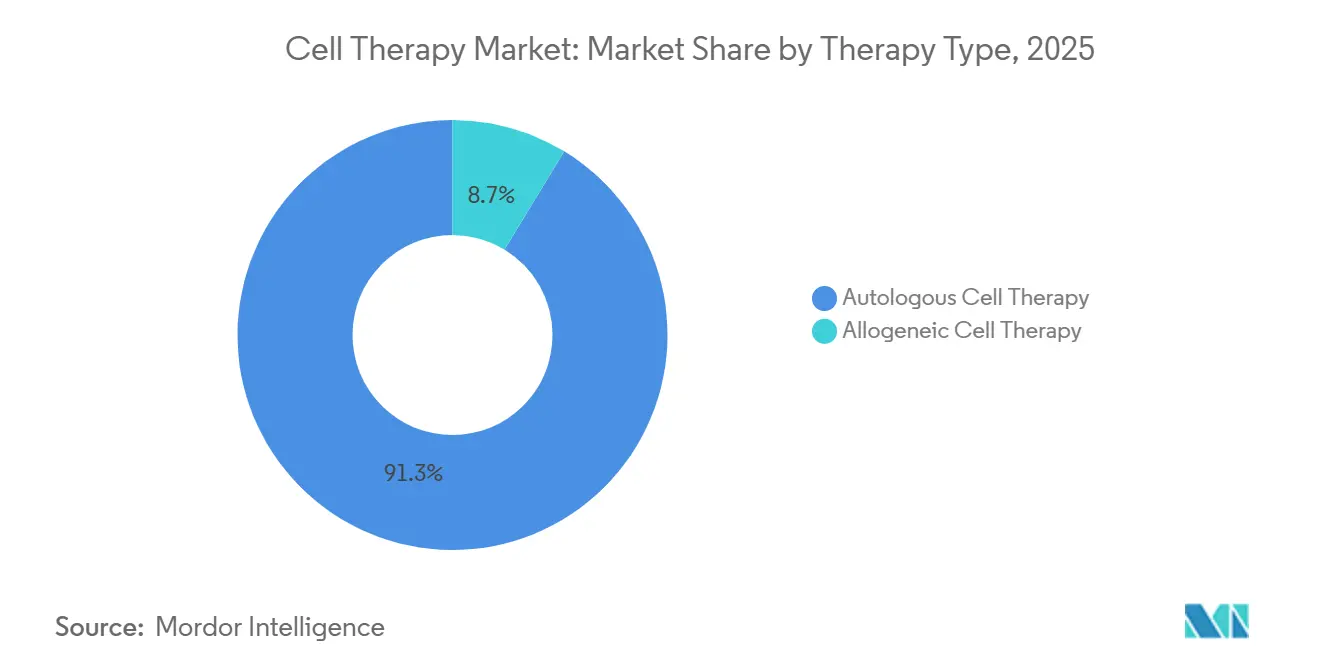
- By therapy type, autologous CAR-T maintained 91.3% of the cell therapy market share in 2025, but allogeneic therapies posted the highest growth at a 17.34% CAGR through 2031.
- By cell type, immune-cell platforms led with 56.1% revenue in 2025; stem-cell products recorded the fastest 18.32% CAGR to 2031.
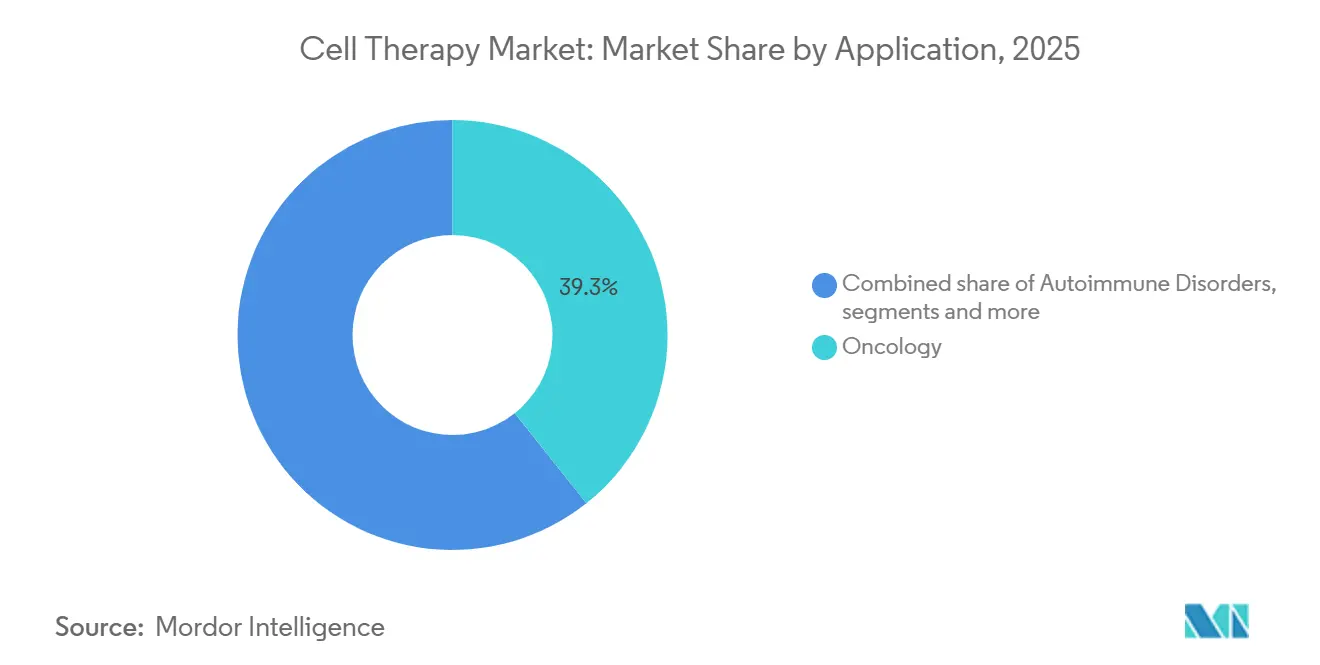
- By application, oncology captured 39.3% revenue in 2025, while neurological disorders expanded at a 17.47% CAGR on the back of late-stage Parkinson’s disease programs.
- By end user, hospitals and clinics accounted for 65.2% spending in 2025; specialized cell-and-gene centers scaled at an 18.08% CAGR as payers favored dedicated infrastructure.
- By geography, North America held 54.2% of the cell therapy market size in 2025; Asia-Pacific registered the fastest 17.89% CAGR, driven by four domestic CAR-T approvals in China during 2024.
Note: Market size and forecast figures in this report are generated using Mordor Intelligence’s proprietary estimation framework, updated with the latest available data and insights as of January 2026.
Global Cell Therapy Market Trends and Insights
Drivers Impact Analysis*
| Driver | (~) (%) Impact on CAGR Forecast | Geographic Relevance | Impact Timeline |
|---|---|---|---|
| Rising approvals and commercial launches of autologous CAR-T therapies | +4.2% | North America, Europe | Short term (≤ 2 years) |
| Build-out of global CDMO capacity for allogeneic pipelines | +3.8% | North America, Europe, Asia-Pacific | Medium term (2-4 years) |
| Expansion of national reimbursement pathways | +3.1% | Germany, United States, Japan, South Korea | Medium term (2-4 years) |
| Indication expansion beyond oncology into autoimmune and cardiovascular diseases | +2.9% | Global | Long term (≥ 4 years) |
| AI-optimized closed bioreactor systems cutting costs ≥40% | +2.2% | Major manufacturing hubs | Medium term (2-4 years) |
| Integration of 3D-bioprinted scaffolds enabling combination implants | +1.0% | United States, Europe | Long term (≥ 4 years) |
| Source: Mordor Intelligence | |||
Rising Approvals and Commercial Launches of Autologous CAR-T Therapies
The United States Food and Drug Administration (FDA) and the European Medicines Agency (EMA) approved nine new CAR-T indications between 2024 and 2025, reducing median review time from 14 months to 9 months [1]U.S. Food and Drug Administration, “Approved Cellular and Gene Therapy Products,” fda.gov. Novartis reported USD 680 million in 2025 revenue for Kymriah, reflecting 28% growth following label expansion to follicular lymphoma. European conditional approvals for three autologous T-cell receptor therapies in 2025 were the first for solid tumors, unlocking a USD 2.1 billion addressable segment by 2028. United States commercial payers linked 30–50% of reimbursement to six-month complete response rates across five CAR-T products in 2024, lowering upfront risk for hospitals. Japan’s regenerative-medicine fast-track designation halved review times for candidates with Phase 2 data showing ≥40% objective responses.
Build-Out of Global CDMO Capacity for Allogeneic Pipelines
CDMOs installed 180,000 liters of allogeneic capacity from 2024 to 2025, including Lonza’s 50,000-liter Portsmouth facility and Charles River’s 40,000-liter Leiden site. Off-the-shelf platforms now generate a therapy batch within 48 hours, down from 4-6 weeks for autologous processes, and the cost-of-goods dropped from USD 350,000 to USD 75,000 per dose. Allogene Therapeutics’ ALPHA2 candidate delivered 67% complete remission in large B-cell lymphoma and targets a U.S. biologics license filing by mid-2026. Vertex and CRISPR Therapeutics committed USD 420 million to a Swiss base-edited T-cell plant, aiming for 100,000 annual doses by 2028. Samsung Biologics’ USD 300 million Incheon facility secured four regional contracts, signaling Asia-Pacific supply-chain localization.
Expansion of National Reimbursement Pathways
Germany’s NUB pathway allowed hospitals to bill three allogeneic candidates ahead of full health-technology assessment, accelerating revenue capture by up to 24 months. Medicare’s NTAP program added 11 cell therapies in 2025, with USD 80,000–200,000 per-case top-ups that eased provider economics. Japan’s conditional reimbursement pathway enabled formulary entry with Phase 2 data in 2024 on the condition of seven-year post-market surveillance. South Korea priced two locally manufactured CAR-Ts at 40% below U.S. list levels, opening access to 1,200 patients annually. The United Kingdom’s final National Institute for Health and Care Excellence (NICE) guidance unlocked GBP 120 million in National Health Service funding for second-line large B-cell lymphoma in 2025.
AI-Optimized Closed Bioreactor Systems Cutting COGs Greater Than 40%
Lonza’s Cocoon platform delivered a 42% per-dose cost reduction for autologous CAR-T production compared with open systems by automating glucose feeds and oxygen control [2]Lonza Group, “Q2 2025 Earnings Transcript,” lonza.com. Machine-learning algorithms trained on 18,000 runs predicted cell viability with 94% accuracy, lowering batch-failure rates to 2%. Kite Pharma trimmed vein-to-vein time for Yescarta from 27 days to 16 days after four U.S. sites adopted automated lines in 2024. Fate Therapeutics hit USD 50,000 cost-of-goods per dose for iPSC-derived NK cells via 21-day continuous perfusion. The FDA recognized AI-controlled bioreactors as compliant process-analytical technology in 2025, allowing post-approval algorithm updates without fresh filings.
Restraints Impact Analysis*
| Restraint | (~) (%) Impact on CAGR Forecast | Geographic Relevance | Impact Timeline |
|---|---|---|---|
| High cost-of-goods for personalized autologous batches | -2.8% | Global | Short term (≤ 2 years) |
| Viral-vector and plasmid supply-chain bottlenecks | -1.9% | North America, Europe | Medium term (2-4 years) |
| Long-term genomic-integrity data gaps post-editing | -1.2% | Global | Long term (≥ 4 years) |
| ESG scrutiny of donor tissue and cryogenic logistics | -0.7% | Europe, North America, Asia-Pacific | Medium term (2-4 years) |
| Source: Mordor Intelligence | |||
High Cost-of-Goods for Personalized Autologous Batches
Autologous CAR-T production averaged USD 350,000 per dose in 2025, driven by patient-specific apheresis, viral-vector transduction, and two-week expansion cycles. Yescarta’s average selling price fell 18% between 2023 and 2025 under outcomes-based contracts, trimming gross margin from 82% to 71%. German and French payers introduced EUR 100,000 per QALY thresholds in 2024, forcing 35% confidential discounts and squeezing profitability. High fixed costs of USD 12 million annually per GMP suite undermine scale for therapies addressing fewer than 500 patients per year. Limited affordability in middle-income countries, where per-capita health spending is below USD 2,000, restricts diffusion and caps revenue growth potential.
Viral-Vector and Plasmid Supply-Chain Bottlenecks
Lentiviral-vector shortages delayed 11 Phase 2 cell-therapy trials in 2024, stretching lead times from 16 weeks in 2022 to 32 weeks in 2024. Thermo Fisher reported a USD 1.8 billion services backlog in Q1 2025 and added 20,000 liters of extra capacity slated for Q4 2026 to ease constraints. Plasmid DNA lead times exceeded 24 weeks in 2024, with 40% price inflation year-over-year. FDA guidance in July 2024 supported non-viral electroporation and lipid-nanoparticle methods for early-phase trials, and six sponsors adopted these approaches by year-end FDA.GOV. Lonza and Catalent committed USD 1.1 billion to viral-vector expansion in 2024, but analysts project a 30% supply deficit through 2028.
*Our forecasts treat driver/restraint impacts as directional, not additive. The impact forecasts reflect baseline growth, mix effects, and variable interactions.
Segment Analysis
Therapy Type: Allogeneic Platforms Reshape Manufacturing Economics
Autologous products held 91.3% of the cell therapy market share in 2025, supported by mature CAR-T franchises and established reimbursement pathways. However, the allogeneic segment is advancing at a 17.34% CAGR through 2031 as off-the-shelf availability removes the 4-6 week manufacturing wait, lowers cost-of-goods to USD 75,000, and streamlines logistics.
Investor confidence intensified in 2025 when Vertex and CRISPR Therapeutics backed a Swiss plant designed for 100,000 doses annually, underscoring the scalability edge of allogeneic platforms. Regulatory flexibility, such as FDA acceptance of non-viral transfection, has shortened timelines, while outcomes-based contracting is tightening margins for autologous players. Allogeneic candidates, therefore, position the cell therapy market for cost-efficient penetration into less-affluent geographies without sacrificing margin integrity.


By Cell Type: Stem Cells Gain on Immune Platforms
Immune-cell therapies dominated 56.1% revenue in 2025, largely from CAR-T and tumor-infiltrating lymphocyte programs endorsed by strong oncology data. Stem-cell platforms are expanding at an 18.32% CAGR as mesenchymal and induced pluripotent stem-cell (iPSC) candidates demonstrate efficacy in cardiovascular and neurological disorders.
Mesoblast’s Phase 3 heart-failure trial cut major adverse events by 34%, while Takeda’s iPSC cardiomyocytes are enrolling ischemic patients with the first readout expected in 2026. Breakthroughs in scaffold and 3D-printing technologies are further elevating stem-cell momentum, positioning them as the cell therapy market’s diversification engine beyond hematologic malignancies.
By Application: Neurological Disorders Outpace Oncology Growth
Oncology delivered 39.3% revenue in 2025, yet neurological disorders are the fastest-growing application, posting a 17.47% CAGR through 2031, thanks to iPSC-derived dopaminergic neuron programs that achieved 32% Unified Parkinson’s Disease Rating Scale motor improvement at 12 months. Autoimmune indications also gained traction as systemic lupus erythematosus entered late-stage evaluation with 73% remission.
Cardiovascular, orthopedic, and ophthalmology segments are emerging as next-wave opportunities on the strength of mesenchymal, chondrocyte, and retinal-cell trials. These trends diversify the cell therapy market size base, lowering reliance on oncology and smoothing revenue volatility linked to competitive saturation in B-cell malignancies.
By End User: Specialized Centers Scale Faster Than Hospitals
Hospitals and clinics accounted for 65.2% of 2025 outlays, but specialized cell-and-gene centers are scaling at an 18.08% CAGR by standardizing apheresis, cell cryopreservation, and post-infusion care. Mayo Clinic’s 12-bed unit treated 180 patients in its first year and reduced cytokine-release-syndrome admissions to 4%, versus a 12% national benchmark.
Academic institutes drive Phase 1-2 innovation, while CDMOs provide industrialized capacity that underpins the cell therapy market size for allogeneic pipelines. High hospital utilization rates of 85% in top U.S. centers create bottlenecks, amplifying the strategic value of purpose-built facilities.
Geography Analysis
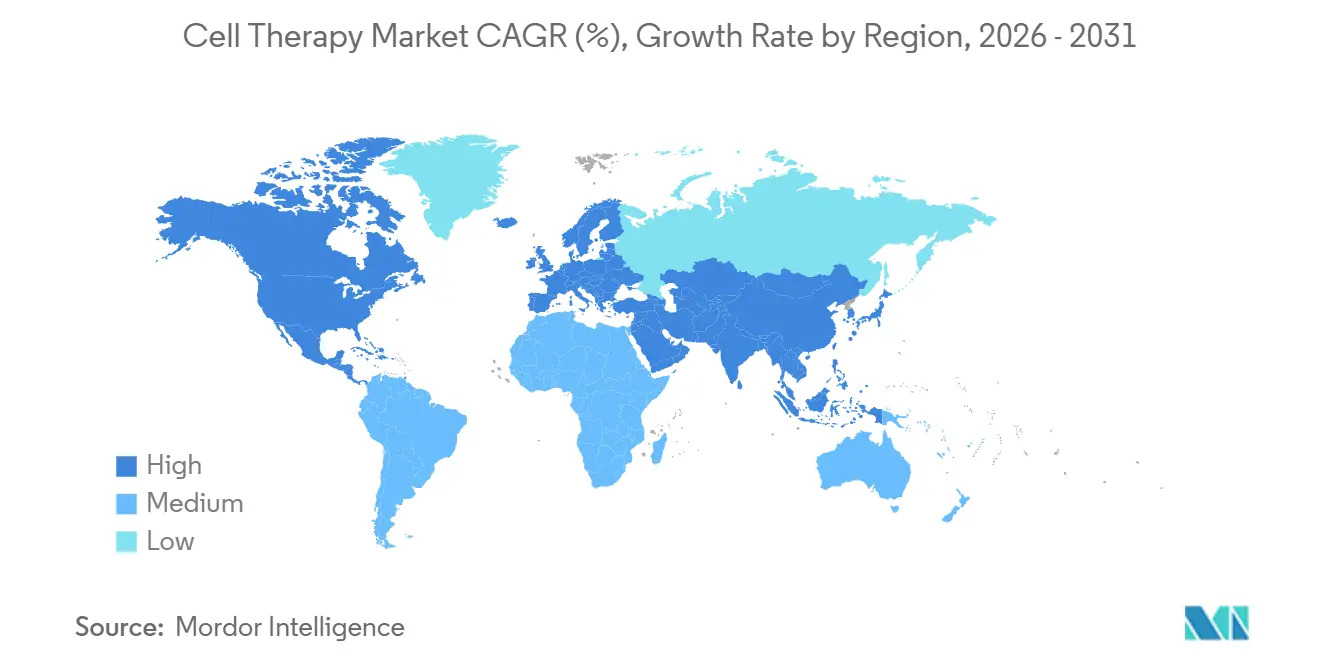
North America recorded a 54.2% share in 2025, with NTAP covering USD 80,000-200,000 per case and five commercial insurers shifting 30-50% payment to outcome-based models. Approvals rose to nine indications for CAR-T therapy between 2024-2025, and Yescarta revenue grew 22% to USD 2.1 billion. High apheresis-suite utilization at 85% created 6-8-week waits, underscoring capacity constraints.
Europe held a 28% share as Germany’s NUB pathway accelerated billing for three allogeneic therapies, while NICE guidance released GBP 120 million in U.K. funding. Conditional approvals for T-cell receptors targeting solid tumors opened a USD 2.1 billion European opportunity. However, QALY thresholds introduced in 2024 require an average of 35% discounts, tempering revenue expansion.
Asia-Pacific registered the fastest 17.89% CAGR; China’s first domestic CAR-T approval, Carvykti, addressed 2,500 multiple-myeloma patients in year one. Japan’s conditional reimbursement route accepted Phase 2 data with a mandatory seven-year follow-up. South Korea reimbursed two local CAR-Ts at 40% lower prices, serving 1,200 patients in 2025. Supply-chain localization via Samsung Biologics and growing CDMO capacity are consolidating the region as the cell therapy market’s next growth engine.

Regulatory Landscape
In the United States, the FDA has continued to formalize flexibility for chemistry, manufacturing, and controls (CMC) requirements that are central to cell therapy scale-up. In 2026, the agency advanced this stance through CMC-focused guidance activity (including draft and updated guidance) and related frameworks for human cellular and gene therapy products. This reinforces regulator tolerance for risk-based approaches in early development, while post-approval oversight remains anchored on process controls and product comparability.
In Europe, cell therapies are regulated as advanced therapy medicinal products (ATMPs) under the EMA framework, with ongoing CAT activity shaping expectations for development and lifecycle management. The EMA authorized ATMPs across 2025 and into 2026, and the European Commission withdrawal of Alofisel in December 2024 underscores active post-authorization lifecycle actions alongside new approvals. Separately, EMA CAT discussions in early 2026 referenced workstreams such as the IPRP Roadmap, indicating continued efforts toward regulatory convergence and reduced duplication for global submissions in gene and cell therapy.
Value Chain Analysis
The cell therapy value chain begins with donor or patient identification and clinical collection, including apheresis and tissue procurement. It then moves through critical raw materials (leukopaks, media, cytokines, viral vectors, plasmid DNA) and consumables used in GMP manufacturing. Manufacturing is executed either in-house or via CDMOs, with the market increasingly splitting into autologous, patient-specific batch workflows and allogeneic, scale-oriented campaigns.
Downstream steps include fill-finish (where applicable), cryopreservation and controlled storage, and chain-of-identity or chain-of-custody documentation. Distribution back to hospitals, clinics, and specialized cell-and-gene centers depends on time- and temperature-sensitive logistics for administration and follow-up. Bottlenecks persist at apheresis capacity, viral vector and plasmid availability, and coordination across multi-site programs, which increases vein-to-vein risk for autologous therapies. Industry responses focus on more integrated, end-to-end operating models that combine manufacturing, biostorage, and logistics under fewer handoffs, supported by digital tracking to manage parallel personalized lots. Capacity additions for allogeneic manufacturing, including the 180,000 liters added by CDMOs during 2024-2025, and logistics expansions such as Cryoport Systems opening a new Global Supply Chain Center in Southern California in May 2026, reflect positioning around reliability and orchestration as much as capacity.
Competitive Landscape
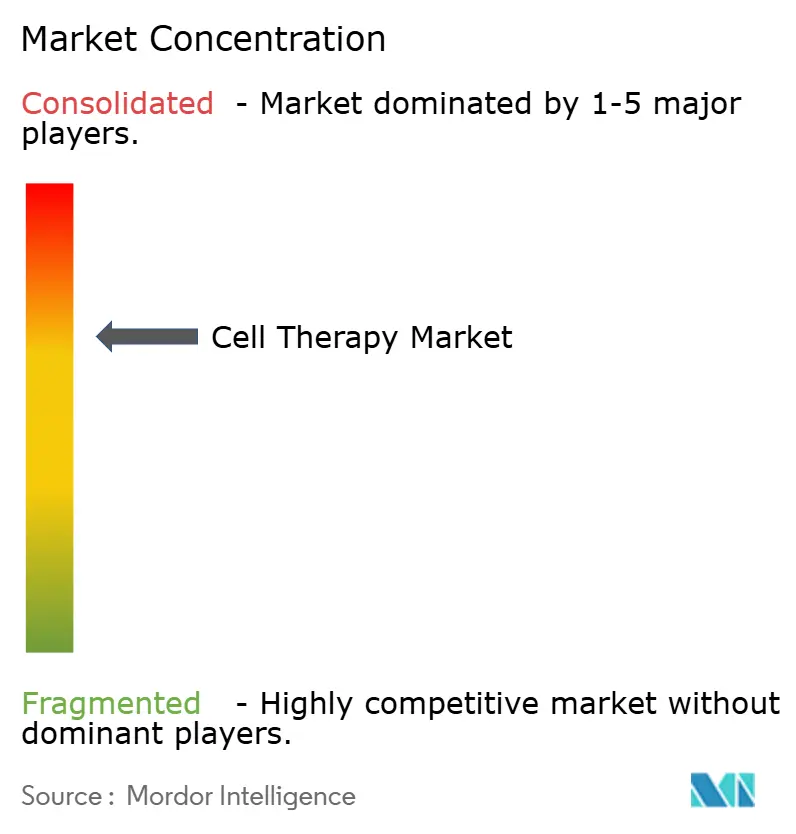
The cell therapy market exhibits moderate concentration: the top five companies, Novartis, Gilead Sciences, Bristol Myers Squibb, Johnson & Johnson, and Legend Biotech captured a significant share of 2025 autologous CAR-T revenue [3]Novartis AG, “Annual Report 2025,” novartis.com. Label expansions and earlier-line oncology approvals underpin incumbents’ defenses, but allogeneic entrants and CDMOs are redistributing share. Vertex and CRISPR’s USD 420 million Swiss facility signals manufacturing scale as a strategic moat, while Allogene Therapeutics posted 67% complete remission in pivotal trials.
Emerging disruptors such as Fate Therapeutics achieved a USD 50,000 per-dose cost, and Samsung Biologics has secured four Asia-Pacific contracts, underscoring how technology and localized capacity shift competitive dynamics. Patent-filing velocity is high. CRISPR Therapeutics registered 14 base-editing patents across 2024-2025 while regulators mandate 15-year follow-up for gene-edited products, favoring well-capitalized firms. Cost-reduction technologies like AI-optimized bioreactors and 3D-printed scaffolds are lowering entry barriers, intensifying rivalry across oncology, autoimmune, and neurologic segments.
Strategic moves in 2025 included Sanofi’s USD 1.2 billion Amunix acquisition, Lonza’s 50,000-liter Portsmouth facility, and Charles River’s 40,000-liter Leiden expansion, each aiming to secure capacity ahead of anticipated demand spikes. As reimbursement models pivot to outcomes and supply scales, competitive advantage is defined increasingly by manufacturing agility, indication breadth, and post-market surveillance infrastructure.
Cell Therapy Industry Leaders
Corestem Inc.
Chiesi Farmaceutici S.p.A.
Tego Science
Allogene Therapeutics Inc.
Takeda Pharmaceuticals
- *Disclaimer: Major Players sorted in no particular order

Market Opportunities and Future Outlook
Manufacturing footprint expansion and automation-led standardization are creating whitespace in cost, throughput, and geographic access, particularly for allogeneic and iPSC-derived platforms that depend on repeatable, industrial-scale processes. The evidence for this investment cycle includes Johnson and Johnson announcing a more than USD 1 billion next-generation cell therapy manufacturing facility in Montgomery County, Pennsylvania (February 2026), FUJIFILM Cellular Dynamics opening a new iPSC development and manufacturing headquarters in Madison, Wisconsin designed to quadruple iPSC capacity (May 2026), and Orca Bio adding East Coast manufacturing capacity in Princeton, New Jersey to complement existing Sacramento operations (June 2026). These moves target constraints that slow commercial rollout, including lead times, regional supply resilience, and the ability to serve more sites with consistent product.
Regulatory and supply-chain enabling actions also support new execution pathways for platforms and suppliers that reduce friction in CMC and critical inputs. The FDA finalized guidance on CMC flexibilities for cell and gene therapy products in 2026 and is running initiatives such as the Manufacturing PreCheck Pilot Program, which included Cellares (June 2026), to support earlier alignment on manufacturing readiness for advanced and automated platforms. On inputs, expansions such as Sartorius Stedim Biotech opening a EUR 140 million competence center in Freiburg, Germany for critical cell therapy components like cytokines (May 2026) and Kincell Bio expanding its Research Triangle Park facility with added ISO 7 cleanroom suites (April 2026) point to a growing addressable market for specialized materials, GMP capacity, and integrated services that reduce the timeline from late-stage development into commercial supply.
Recent Industry Developments
- June 2026: Chiesi Group and Arbor Biotechnologies received European Commission Orphan Drug Designation for ABO-101, an investigational gene-editing therapy for primary hyperoxaluria type 1. The designation strengthens regulatory and commercialization incentives for advanced therapies in rare diseases. It also supports partner-led investment in clinical development and manufacturing readiness.
- December 2025: The FDA approved Waskyra (etuvetidigene autotemcel) for Wiskott-Aldrich syndrome, adding another commercial advanced therapy option for a rare immunodeficiency. The approval reinforces the role of regulator pathways and CMC execution as key differentiators for sponsors moving complex biologics into routine care.
- July 2024: The FDA issued guidance supporting non-viral approaches such as electroporation and lipid nanoparticles for early-phase cellular and gene therapy development. This policy shift expands technical options for developers facing viral vector constraints. It also supports alternative manufacturing routes that can simplify supply planning and comparability strategies.


Research Methodology Framework and Report Scope
Market Definition and Coverage
This market covers revenues generated from using viable human cells as a therapy, where cells are administered to repair, replace, or modulate a patient function. It includes commercially available therapies as well as investigational therapies that are actively moving through clinical development.
Scope exclusions: Gene-only therapies (where cells are not the active therapeutic) and acellular regenerative scaffolds are excluded from this sizing.
Segmentation Overview
- By Therapy Type
- Autologous Cell Therapy
- Allogeneic Cell Therapy
- By Cell Type
- Stem Cell Therapy
- Hematopoietic Stem Cells
- Mesenchymal Stem Cells
- Induced Pluripotent Stem Cells
- Immune Cell Therapy
- T-Cell Therapy (incl. CAR-T, TCR-T)
- NK-Cell Therapy
- Dendritic Cell Therapy
- Fibroblast & Chondrocyte-based Therapies
- Stem Cell Therapy
- By Application
- Oncology
- Autoimmune Disorders
- Cardiovascular Diseases
- Orthopedic & Musculoskeletal
- Neurological Disorders
- Wound Healing & Dermatology
- Ophthalmology
- By End User
- Hospitals & Clinics
- Specialized Cell- & Gene-Therapy Centers
- Academic & Research Institutes
- Contract Manufacturing & CRO Facilities
- By Geography
- North America
- United States
- Canada
- Mexico
- Europe
- Germany
- United Kingdom
- France
- Italy
- Spain
- Rest of Europe
- Asia-Pacific
- China
- Japan
- India
- South Korea
- Australia
- Rest of APAC
- Middle East & Africa
- GCC
- South Africa
- Rest of Middle East & Africa
- South America
- Brazil
- Argentina
- Rest of South America
- North America
Data Sources, Market Sizing, and Validation
Desk Research
Desk work started by mapping the therapy landscape and the development pipeline using public records, then aligning those signals with the revenue that can reasonably be attributed to cell-based treatments. The sources used included, for example, ClinicalTrials.gov and other clinical trial registries, peer reviewed journals in regenerative medicine and oncology, and public drug label and approval databases maintained by regulators.
To keep assumptions grounded, we also reviewed sources such as national health statistics portals, customs and trade summaries for relevant biologics and cold chain flows where available, and websites of major professional societies covering hematology, oncology, and regenerative medicine. Company annual reports, investor decks, and press releases were used to understand launch timing, manufacturing scaling notes, and therapy pricing commentary. In a few cases, paid subscriptions that summarize company financials, patents, and shipment-level trade records were used to fill gaps that public sources did not clearly answer. This list is not exhaustive, and many other public sources were checked during data collection, validation, and clarification.
Primary Interviews and Surveys
Primary work was used to pressure-test what the desk inputs were implying, especially around price realization, patient throughput constraints, and how quickly capacity ramps convert into treatable volumes. We spoke with a mix of therapy developers, manufacturing and supply chain specialists, and clinical stakeholders across key regions, so assumptions could be checked across different care settings and reimbursement environments.
Distribution of primary research fieldwork respondents
| Company type | Respondent position | Region |
|---|---|---|
| Top tier: 31% | CXOs: 13% | APAC: 44% |
| Mid tier: 50% | Functional/Unit leaders: 28% | EMEA: 34% |
| Smaller Players: 19% | Managers: 59% | Americas: 22% |
Market-Sizing & Forecasting
For sizing, a top-down approach was used where treated patient pools and therapy availability by indication are reconstructed from epidemiology signals, clinical adoption patterns, and approval and launch timing, then converted into revenue using realistic price and course assumptions. Once those totals were built, selective bottom-up checks were run using sampled therapy revenues, regional channel checks, and an ASP times volume logic where public disclosures made the inputs traceable.
The model is sensitive to a few practical fingerprints, such as the number of approved therapies by region, therapy pricing ranges and expected net price movement, manufacturing capacity and turnaround times that can cap patient volumes, and the pace of new indication expansion in late-stage pipelines. Since not every therapy has transparent sales disclosure each year, gaps were handled by using proxy adoption curves tied to approved label population and by cross-checking against manufacturing scale-up commentary from public filings.
For forecasting, scenario analysis was used because adoption and capacity build-out can move quickly after approvals, but they can also slow if reimbursement or site readiness lags. The scenarios were anchored to expert consensus on how patient access expands, how capacity bottlenecks ease over time, and how pricing evolves as competition increases.
Data Validation & Update Cycle
Validation is done in steps so that one dataset does not drive the final number on its own. We compare outputs against independent signals such as approval counts, trial activity trends, and disclosed revenue direction, then investigate variances before results are finalized.
If an estimate looks out of line, assumptions are revisited and, when needed, respondents are re-contacted to confirm what changed (for example, a capacity constraint, a reimbursement shift, or a delayed launch). Reports are refreshed annually, and interim updates are made when material events occur in the therapy pipeline or regulatory landscape. Before delivery, an analyst completes a fresh pass so the numbers reflect the most current public information and validated assumptions.
Mordor Intelligence's Cell Therapy Market Size Versus Other Published Estimates
Published market sizes for cell therapy often vary because analysts do not always count the same therapy scope, and they also differ on how they treat investigational revenues, pricing progression, and currency timing. The table makes these gaps easier to see, and it also shows how different time bases can change the headline number.
Key drivers typically come down to whether estimates bundle gene therapy or adjacent biologics into the same bucket, whether early pipeline assets are counted before meaningful patient volumes exist, and whether pricing is modeled using list price or expected net price after rebates and access limits. Another common reason is refresh cadence, since new approvals and label expansions can change the demand pool quickly, which then shifts the near-term market size.
Benchmark comparison
| Source | Market Size | Gaps in Research Methodology |
|---|---|---|
| Mordor Intelligence | USD 6.55 B (2026) | |
| Global Consultancy A | USD 5.89 B (2024) | Uses an earlier time base and a different ramp for adoption, which can understate near-term revenues when approvals and site readiness improve in later years. |
| Industry Publisher B | USD 16.14 B (2024) | Broader inclusions are implied, which can pull in adjacent categories and inflate totals if gene-only therapies or non-cell regenerative products are counted together with cell therapies. |
The table points to a wide spread, and in Mordor Intelligence's model the value is tied to therapies where viable human cells are the active therapeutic and revenues are linked to treatable volumes and realistic price realization rather than a broad regenerative bucket. With clear inclusion rules and repeatable checks against approvals, pipelines, and capacity constraints, the final number stays explainable and can be updated when the underlying signals move.


Key Questions Answered in the Report
How large is the cell therapy market in 2026?
The cell therapy market size reached USD 6.55 billion in 2026 and is projected to climb to USD 14.56 billion by 2031.
Which type of therapy is growing fastest?
Allogeneic, off-the-shelf therapies are the fastest, advancing at a 17.34% CAGR through 2031 due to lower cost-of-goods and shorter manufacturing lead times.
What region will post the highest growth?
Asia-Pacific is expected to deliver the highest regional CAGR of 17.89% as China, Japan, and South Korea streamline approvals and expand reimbursement.
What is the main cost challenge for autologous CAR-T?
Personalized production averages USD 350,000 per dose and involves high fixed GMP costs, pressuring margins and affordability.
How are manufacturers reducing costs?
AI-optimized closed bioreactors, capacity expansion at CDMOs, and non-viral gene-delivery methods are cutting per-dose costs significantly.
Which application segment is expanding fastest?
Neurological disorders lead with a 17.47% CAGR, fueled by late-stage trials in Parkinson’s disease using iPSC-derived neurons.
Page last updated on:


 Your data is secure and never sold or shared.


