
Cell Sorting Market Size and Share
Market Overview
| Study Period | 2020 - 2031 |
|---|---|
| Market Size (2026) | USD 376.84 Million |
| Market Size (2031) | USD 561.71 Million |
| Growth Rate (2026 - 2031) | 8.31 % |
| Fastest Growing Market | Asia Pacific |
| Largest Market | North America |
| Market Concentration | Medium |
Major Players *Disclaimer: Major Players sorted in no particular order Image © Mordor Intelligence. Reuse requires attribution under CC BY 4.0. | |
Cell Sorting Market Analysis by Mordor Intelligence
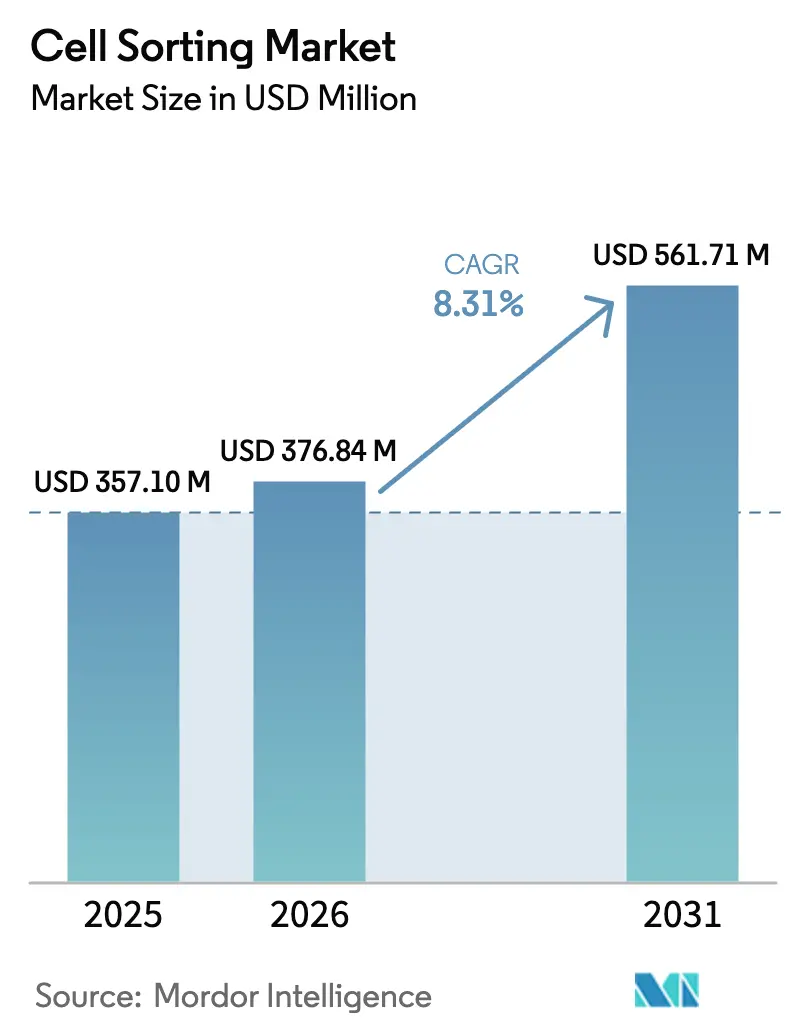
The Cell Sorting Market size is projected to expand from USD 357.10 million in 2025 and USD 376.84 million in 2026 to USD 561.71 million by 2031, registering a CAGR of 8.31% between 2026 to 2031.
The cell sorting market is shifting from a research convenience toward a critical bottleneck in cell and gene therapy (CGT) manufacturing, changing procurement priorities for instruments, reagents, and services. Demand is amplifying as image-enabled and spectral technologies displace filter-based droplet systems, while contract sorting services scale to meet good manufacturing practice (GMP) requirements. Supply-chain vulnerabilities—particularly for lasers and microfluidic chips—put pricing power in the hands of qualified vendors, and regulatory emphasis on post-sort viability compels users to adopt gentler, high-parameter platforms. Together, these forces are redefining capital-allocation strategies, driving recurring consumable revenue, and consolidating sorting capacity in organizations capable of sustaining 24/7 operations.
Key Report Takeaways
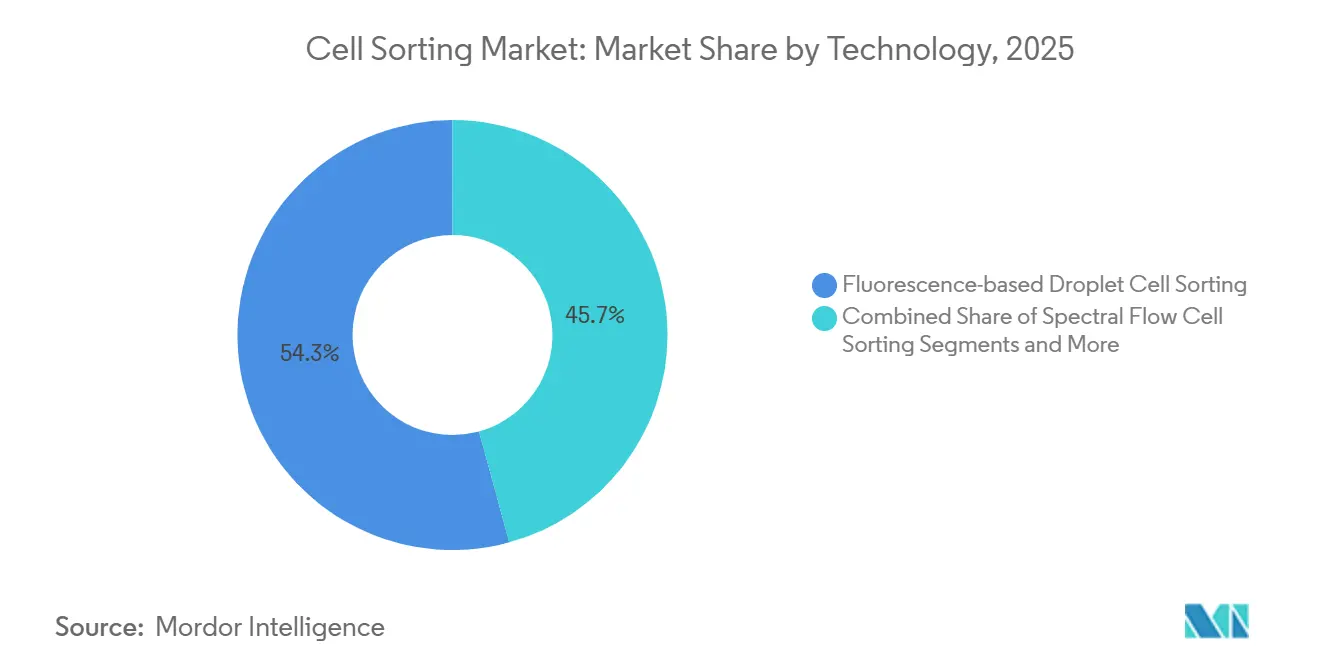
- By technology, fluorescence-based droplet systems commanded 54.26% of the cell sorting market share in 2025, while image-enabled platforms are projected to advance at a 12.35% CAGR through 2031.
- By product and service, reagents and consumables accounted for 42.63% of the cell sorting market size in 2025, whereas services are expected to grow at an 11.45% CAGR over the forecast period.
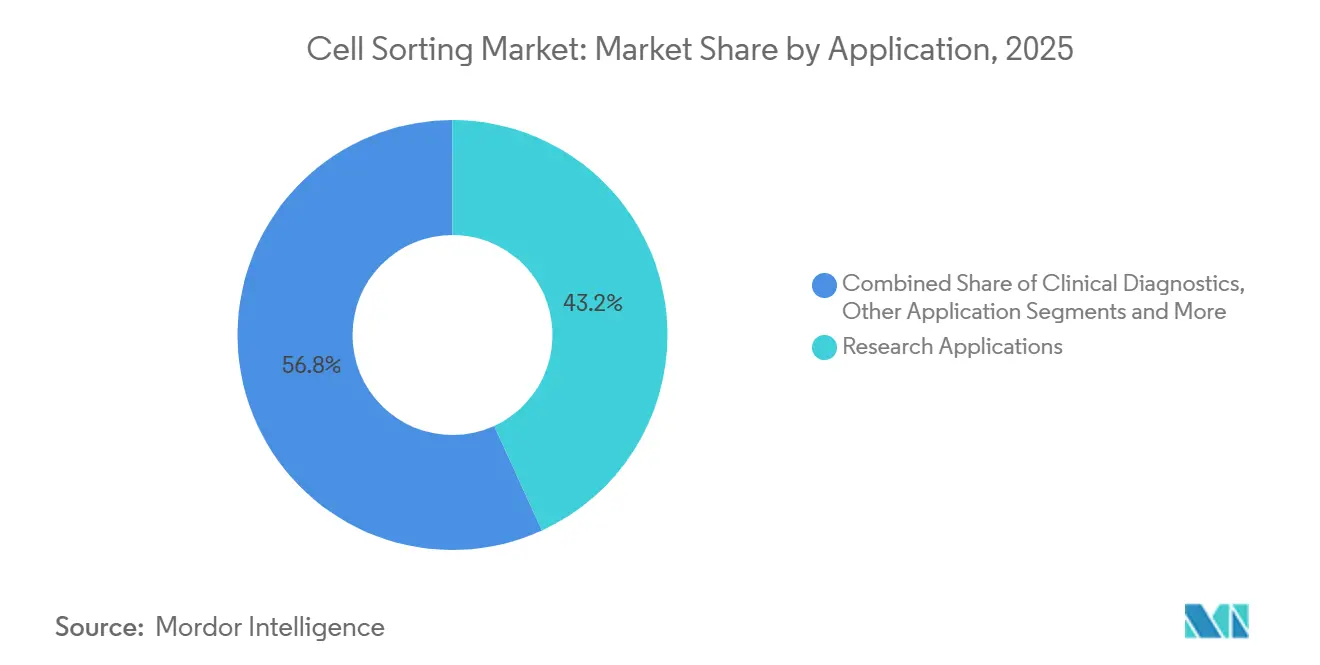
- By application, research retained 43.16% revenue share in 2025, yet cell and gene therapy manufacturing is poised to record an 11.73% CAGR to 2031.
- By cell type, mammalian cells dominated with 71.63% share of the cell sorting market size in 2025, while exosomes and extracellular vesicles are set to increase at a 10.32% CAGR through 2031.
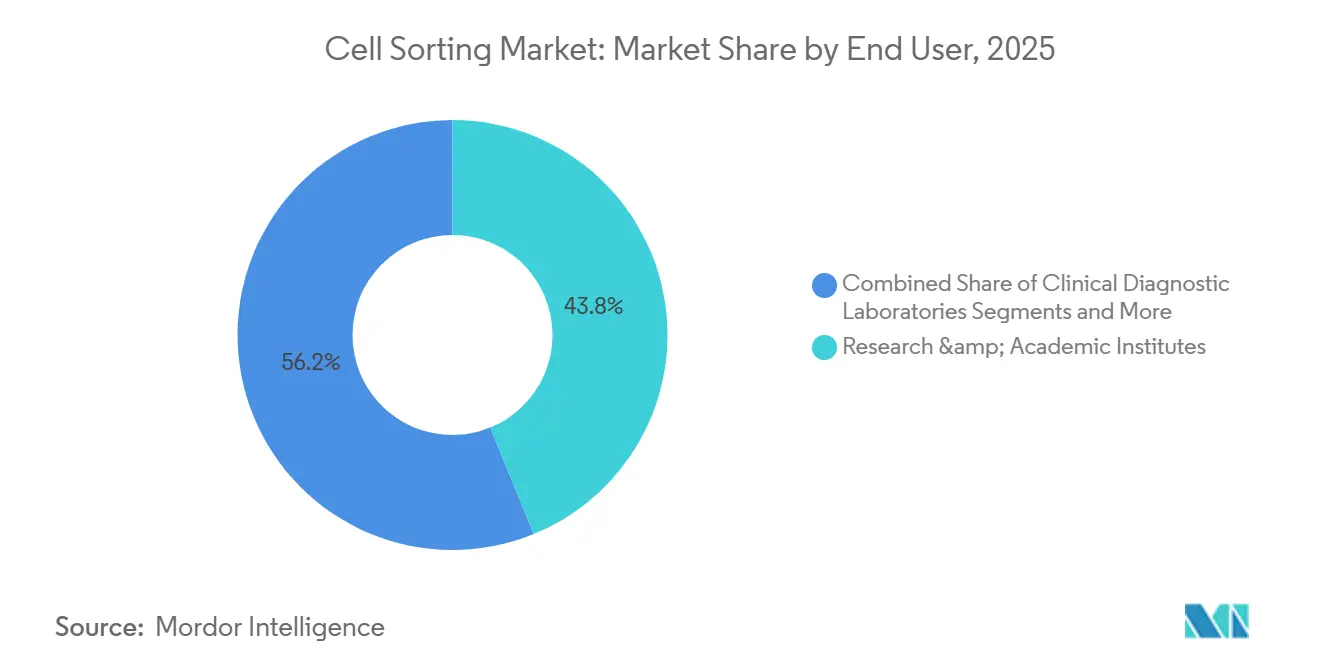
- By end user, research and academic institutes led with 43.83% of the cell sorting market share in 2025, but clinical diagnostic laboratories are projected to expand at a 10.52% CAGR during the same horizon.
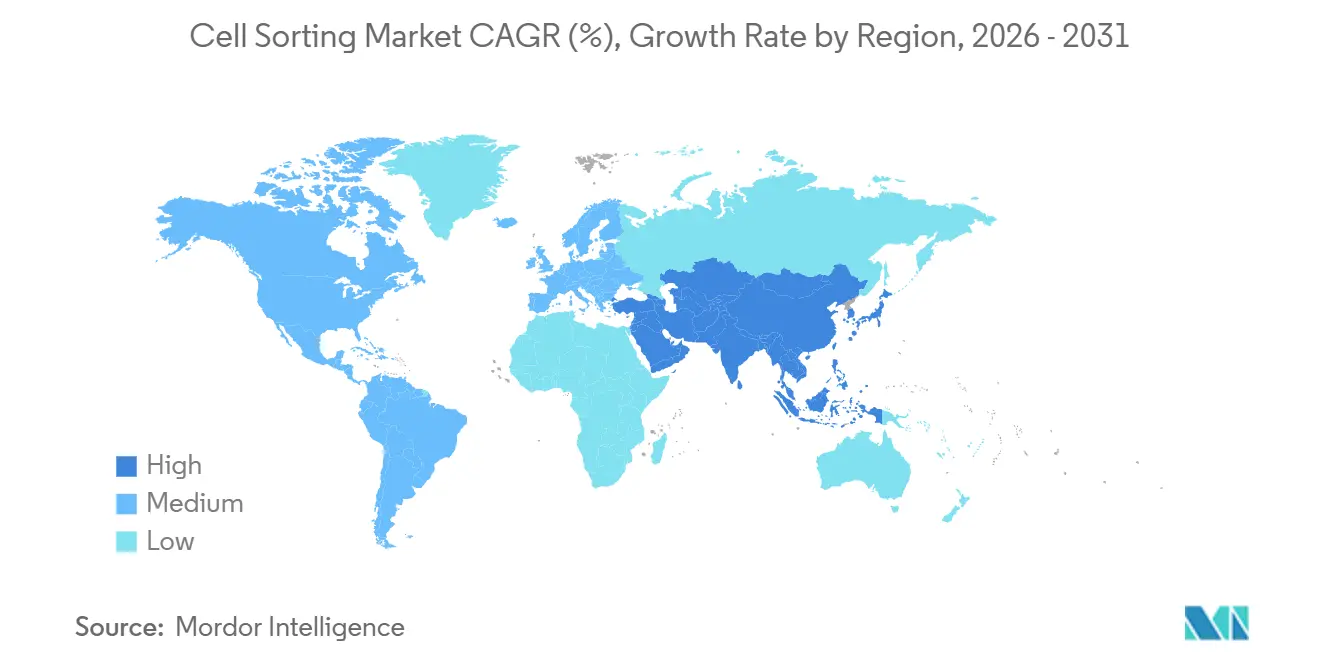
- By geography, North America held 39.62% of revenue in 2025, whereas Asia-Pacific is forecast to achieve the fastest regional growth at a 9.89% CAGR to 2031.
Note: Market size and forecast figures in this report are generated using Mordor Intelligence’s proprietary estimation framework, updated with the latest available data and insights as of January 2026.
Market Trends and Insights
Drivers Impact Analysis of Cell Sorting Market*
| Driver | (~) % Impact on CAGR Forecast | Geographic Relevance | Impact Timeline |
|---|---|---|---|
| Growing prevalence of cancer, HIV, immune disorders | +1.4% | North America, Europe, emerging Asia | Medium term (2–4 years) |
| Expansion of pharmaceutical and biotech R&D pipelines | +1.6% | North America, Europe, China, Japan, South Korea | Long term (≥ 4 years) |
| Rapid instrument innovation (spectral, image-enabled) | +1.8% | Global, early adoption in North America and Europe | Short term (≤ 2 years) |
| Surge in single-cell multi-omics workflows | +1.2% | North America, Europe, spillover to Asia-Pacific | Medium term (2–4 years) |
| Image-enabled morphological gating unlocking new assays | +1.0% | North America, Europe, Japan | Medium term (2–4 years) |
| China-centric CGT trial boom | +1.3% | China with spillover to Southeast Asia | Short term (≤ 2 years) |
| Source: Mordor Intelligence | |||
Growing Prevalence of Cancer, HIV & Immune Disorders
More than 2 million new cancer cases projected for the United States in 2024 sustain multi-parameter isolation of tumor-infiltrating lymphocytes and circulating tumor cells.[1]American Cancer Society Staff, “Cancer Statistics,” American Cancer Society, cancer.org HIV monitoring still relies on flow-based CD4 enumeration across parts of sub-Saharan Africa and Southeast Asia, while autoimmune-disease studies require high-purity B-cell and regulatory T-cell fractions. Functional sorting for downstream omics increases throughput requirements, favoring spectral platforms that resolve overlapping fluorescence spectra without complex compensation. This disease burden underpins instrument refresh cycles and keeps core facilities operating near full capacity.
Expansion of Pharmaceutical & Biotech R&D Pipelines
Novartis reports that Kymriah production involves multiple enrichment steps to secure consistent CD4:CD8 ratios for every lot. Similar protocols underpin approved CAR-T products from Bristol Myers Squibb and Gilead. China authorized 13 CAR-T investigational new drug (IND) applications in 2024, compelling contract manufacturers to install redundant sorters. The enlarged pipeline positions the cell sorting market at the heart of commercial manufacturing schedules and quality-control documentation.
Rapid Instrument Innovation (Spectral, Image-Enabled Sorters)
Cytek’s Aurora CS enables full-spectrum unmixing with post-sort viabilities above 95%.[2]Cytek Biosciences Team, “Aurora CS Spectral Cell Sorter,” Cytek Biosciences, cytekbio.com BD’s FACSDiscover S8 integrates real-time imaging that distinguishes subcellular morphology for fragile induced pluripotent stem cells. Sony’s MA900 chips reduce sample waste by 60%.[3]Sony Biotechnology Team, “MA900 Multi-Application Cell Sorter,” Sony Biotechnology, sonybiotechnology.com These launches shorten assay-development timelines and render decade-old droplet instruments functionally obsolete, encouraging labs to accelerate replacement cycles.
Surge in Single-Cell Multi-Omics Workflows
10x Genomics notes that customers frequently use upstream sorting to enrich rare cell populations before sequencing, cutting per-cell costs. The Human Cell Atlas and pharma biomarker programs rely on high-purity inputs, creating a flywheel that sustains reagent demand and pushes instrument throughput limits. Every growth step in sequencing volume boosts the cell sorting market, widening its downstream influence.
Restraints Impact Analysis of Cell Sorting Market*
| Restraint | (~) % Impact on CAGR Forecast | Geographic Relevance | Impact Timeline |
|---|---|---|---|
| High capital and maintenance costs | -0.9% | Global, especially emerging markets | Short term (≤ 2 years) |
| Shortage of highly skilled flow-cytometry operators | -0.7% | Acute in APAC and Middle East & Africa | Medium term (2–4 years) |
| Regulatory concern over shear-induced perturbations | -0.5% | North America, Europe | Long term (≥ 4 years) |
| Single-source component supply risks | -0.4% | Global, concentrated in Asian manufacturing hubs | Medium term (2–4 years) |
| Source: Mordor Intelligence | |||
High Capital & Maintenance Costs of Advanced Sorters
Entry-level benchtop units approach USD 200,000, while high-parameter spectral systems exceed USD 600,000. Annual service contracts add 12–15% to purchase price, and single-use cartridges can cost USD 50–150 per run. These expenses concentrate ownership within well-funded institutions and push small biotech firms toward contract services, postponing broad adoption of next-generation platforms.
Shortage of Highly Skilled Flow-Cytometry Operators
Only 30% of new PhD graduates receive formal cytometry training, leaving a gap as instruments gain complexity. Contract manufacturers require multiple certified operators per GMP suite, yet competition for talent drives wage inflation. Automation mitigates but does not eliminate regulatory requirements for human oversight, prolonging assay-transfer timelines and heightening quality-control risks.
*Our forecasts treat driver/restraint impacts as directional, not additive. The impact forecasts reflect baseline growth, mix effects, and variable interactions.
Cell Sorting Market Segment Analysis
By Technology:
Image-Enabled and Spectral Platforms Reconfigure WorkflowsFluorescence-based droplet systems retained 54.26% of cell sorting market share in 2025. The segment’s dominance stems from installed fleets of BD FACSAria and Sony SH800 units across academic cores. Yet the fastest growth now lies in image-enabled sorters, projected at 12.35% CAGR through 2031. Users adopt these platforms to separate circulating tumor cells from leukocytes using nuclear-to-cytoplasmic ratios that fluorescence alone cannot capture. Spectral detection, nested within the fluorescence category, enables 40-parameter panels that resolve autofluorescence in tumor biopsies. As a result, legacy filter-based systems face accelerated depreciation schedules. Magnetic-activated cell sorting remains the default for large-scale CD3 or CD34 enrichment in autologous therapies because of closed-system compliance, but its growth moderates as spectral platforms prove GMP-ready. Microfluidic and acoustic technologies hold niche but strategic value. NanoCellect’s WOLF G2 sorts fragile stem cells with 98% post-sort viability, appealing to regenerative medicine players. Bulldog Bio’s acoustic sorters offer label-free separation for organoid workflows. Collectively, these alternatives expand the cell sorting market by adding use cases once limited by shear stress or antibody costs.
Adoption trajectories vary by lab mission. Core facilities with high instrument utilization gravitate toward spectral upgrades because they can redeploy existing antibody inventories. Pharma manufacturing suites prioritize validated droplet systems for continuity but earmark capital budgets for image-enabled add-ons that document cell morphology. Emerging biotech startups, under cost pressure, favor microfluidic instruments that combine lower entry price with reduced consumable spend. Vendors now bundle AI-powered gating software, enabling novice operators to run 30-color panels with guided workflows, shrinking the skills gap. Over the forecast period, technology fragmentation will persist, but spectral and image-enabled platforms are poised to command premium pricing, nudging average selling prices upward and sustaining revenue growth in the cell sorting market.


By Product & Service:
Services Outpace Hardware as GMP Outsourcing SurgesReagents and consumables delivered 42.63% of 2025 revenue, underscoring the annuity-like nature of antibody and cartridge sales. Services will expand at 11.45% CAGR as CGT developers outsource GMP-compliant sorting. Instrument sales still matter because each GMP suite demands redundant units, yet budget cycles stretch when list prices break past USD 600,000. Thermo Fisher’s Attune CytPix integrates acoustic focusing and imaging, giving mid-tier labs a stepping stone into spectral territory.
Consumables break down into antibodies, magnetic beads, and single-use fluidic paths. BD Biosciences, BioLegend, and Miltenyi Biotec compete intensely on antibody panel breadth, while Miltenyi dominates magnetic bead workflows through its CliniMACS Prodigy system. Disposable microfluidic cartridges, though costlier per run, reduce cross-contamination risk, a critical selling point for contract manufacturers juggling multiple client campaigns. Service providers such as Lonza and Charles River offer turnkey cell sorting market solutions, including assay design, regulatory filing support, and chain-of-custody documentation. Their rise reallocates industry profit pools from hardware to expertise and positions high-touch services as the fastest revenue accelerator within the cell sorting industry.
By Application:
CGT Manufacturing Drives Structural Demand ShiftResearch occupied 43.16% demand in 2025 as cancer and stem-cell biology generated sample throughput. However, CGT manufacturing is tracking an 11.73% CAGR, poised to eclipse pure research spending by the decade’s end. Clinical diagnostics, especially leukemia minimal residual disease testing, follows closely with a 10.52% growth rate. Hospitals replace four-color analyzers with eight-color or spectral sorters to conform to European Hematology Association guidelines. Research adoption is stabilizing; grant budgets are flat and reviewers favor translational proposals that bridge benchtop insights to patient outcomes. The cell sorting market size for diagnostics benefits from standardized reimbursement codes that de-risk capital purchases for community labs, extending technology penetration beyond academic strongholds.
In CGT workflows, cell sorting is mission-critical. Each autologous CAR-T infusion requires multiple purification rounds under sterile, closed conditions, making sorter uptime a gatekeeper for patient scheduling. Process deviations trigger expensive batch failures, incentivizing redundant instrument arrays and premium service contracts. Regulatory filings increasingly include image-based documentation of sorted populations, strengthening the case for image-enabled platforms. In clinical diagnostics, throughput trumps parameter count, so mid-speed droplet instruments remain adequate, yet adoption of spectral panels accelerates as labs confront multiplex antibody shortages. Collectively, these trends reshape the application mix and elevate CGT to the anchor segment dictating technology road maps.
By Cell Type:
Exosome Isolation Becomes a Strategic FrontierMammalian cells commanded 71.63% share in 2025, spanning T cells, B cells, natural killer cells, and induced pluripotent stem cells. Exosomes and extracellular vesicles will expand at 10.32% CAGR as liquid-biopsy assays and EV-mediated drug delivery platforms enter late-stage trials. Fluorescence-based immunocapture of CD63-positive vesicles now rivals ultracentrifugation in purity, improving quantitation of tumor-derived RNA cargo. T cells dominate volume because every CAR-T lot requires multiple enrichments. NK-cell programs from Fate Therapeutics and Nkarta rely on sorting to eliminate feeder cells and normalize activation markers. Stem-cell pipelines for spinal-cord injury and macular degeneration cannot tolerate droplet shear, pushing demand toward acoustic or microfluidic systems.
Exosome workflows introduce a new consumable category—affinity antibodies conjugated to magnetic nanobeads—opening cross-sell angles for vendors already supplying stem-cell and immune panels. Microbial sorting remains a niche, yet synthetic biology companies use high-speed dispensing to clone thousands of yeast variants each day, expanding market breadth. Over the forecast horizon, the interplay of mammalian dominance and exosome momentum will stabilize average selling prices and expand addressable applications, underpinning steady growth of the cell sorting market.
By End User:
Clinical Labs Accelerate Adoption for MRD TestingResearch and academic institutes represented 43.83% of 2025 revenue, reflecting entrenched fleets and high utilization rates. However, clinical diagnostic laboratories will post a 10.52% CAGR as hematology departments deploy spectral sorters for acute myeloid leukemia minimal residual disease panels. Pharmaceutical and biotech companies maintain significant spend, yet split strategies. Large pharma builds internal GMP suites to secure timelines, while early-stage biotech relies on contract development and manufacturing organizations (CDMOs) for everything from protocol design to regulatory audits. CDMOs, in turn, are the fastest-growing buyer cohort, installing multiple redundant sorters to guarantee 100% uptime.
Core facilities at R1 universities face booking queues exceeding 90% utilization, forcing researchers to plan experiments months in advance. This congestion nudges institutions to invest in additional units or negotiate volume discounts with vendors. Clinical labs in Europe and North America benefit from updated reimbursement frameworks that justify capital investment in spectral analyzers. Collectively, shifting end user dynamics reinforce services and consumables as the cell sorting market’s growth flywheels.
Geography Analysis
North America and APAC Cell Sorting Market
North America, with 39.62% share in 2025, remains the cell sorting market’s revenue anchor. The FDA cleared six new cell and gene therapies in 2024, each requiring validated sorting documentation. Canada’s regenerative-medicine hubs in Toronto and Vancouver advance stem-cell applications, while Mexico’s vaccine developers integrate benchtop sorters into infectious-disease workflows. Asia-Pacific will record a 9.89% CAGR through 2031, propelled by China’s 13 CAR-T IND approvals in 2024 and the country’s push for localized sorter components. Japan leverages its conditional approval pathway to run iPSC trials for macular degeneration, requiring gentle acoustic sorters inside hospital clean rooms. India’s contract research organizations attract off-shore pharma screening campaigns, boosting reagent volumes.
Europe Cell Sorting Market
Europe ranks second in regional revenue. Germany’s university hospitals host dense fleets of spectral sorters for tumor microenvironment studies. The United Kingdom pilots national minimal residual disease monitoring, potentially standardizing spectral flow across public hospitals. France emphasizes microbial cell sorting in infectious-disease research. EMA guidance on advanced therapy medicinal products places higher weight on process consistency, spurring automated sorter adoption. Southern European labs, constrained by public-sector budgets, enter shared-facility agreements to access high-parameter platforms, keeping unit sales steady.
MEA and South America Cell Sorting Market
Middle East & Africa and South America offer smaller bases but strategic upside. Gulf Cooperation Council states import high-end sorters to populate new biotech parks in Dubai and Riyadh, aiming to localize precision medicine. South Africa’s HIV programs keep legacy droplet units busy, but grant cycles limit upgrades. Brazil’s vaccine institutes demand benchtop sorters for yellow fever and dengue projects, while Argentina’s currency volatility delays capital expenditures, pushing users toward fee-for-service sorting. These regions collectively contribute modest volume but broaden the distribution footprint, offering vendors risk diversification and long-term growth optionality for the cell sorting market.

Regulatory Landscape
Cell sorting platforms sit across life-science instrumentation, IVD/medical-device classification, and GMP controls when used in cell and gene therapy (CGT) manufacturing. In the United States, FDA/CBER expectations for cellular and gene therapy products require manufacturers to describe critical processing steps and controls, including sorting methodology and in-process controls supporting identity, purity, and potency, in IND-enabling documentation under applicable 21 CFR frameworks. This raises documentation requirements for post-sort viability, sterility controls, and software-enabled gating decisions.
In Europe, classification and qualification of products that support diagnostic workflows are shaped by Regulation (EU) 2017/746 (IVDR) and related guidance. A sorter may be regulated as an IVD, medical device, accessory, or remain research-use-only depending on intended purpose and risk classification rules. In April 2026, the European Commission Borderline and Classification Working Group (BCWG) published Version 5 of the Manual on Borderline and Classification for Medical Devices and IVDs, reinforcing the need for consistent qualification decisions across member states. Quality frameworks also influence sorting-adjacent infrastructure, including ISO 20387:2020/A11:2024 for biobanking competence, which biobanks and advanced research facilities increasingly use to formalize quality management around biological material handling and associated processes.
Value Chain Analysis
The cell sorting value chain spans (1) upstream component supply, including optoelectronic parts such as laser diodes and detectors (including multi-channel photomultiplier tubes) plus optical filters, and precision fluidics and microfluidic chip fabrication, (2) instrument OEM integration and software, such as spectral unmixing, imaging, and AI-assisted gating, (3) recurring consumables including fluorochrome-conjugated antibodies, magnetic beads and columns, and platform-specific single-use fluidic paths or microfluidic cartridges, and (4) downstream distribution, installation, validation, and service, including third-party and vendor-provided maintenance plus fee-for-service sorting. Constraints in critical components, including observed 16-24 week lead times for high-reliability lasers and optical detection parts, can tighten availability for high-parameter systems and increase the importance of qualified alternative suppliers.
For clinical-grade and CGT-adjacent use, the chain extends into qualification and compliance activities. Consumables that contact therapeutic products require tighter change control, and supplier qualification cycles for single-use cartridges can run 12-24 months, which increases switching costs and reinforces vendor lock-in for proprietary consumables. At the technology edge, peer-reviewed work in 2026 highlighted scalable microfluidic separation approaches for CAR-T manufacturing, including deterministic lateral displacement platforms with reported improvements in leukocyte recovery versus traditional approaches. Academic-to-OEM transfer can introduce new sub-supplier ecosystems, such as chip molders and microfabrication, and shift value toward closed, automated, gentler workflows that preserve post-sort viability.
Competitive Landscape
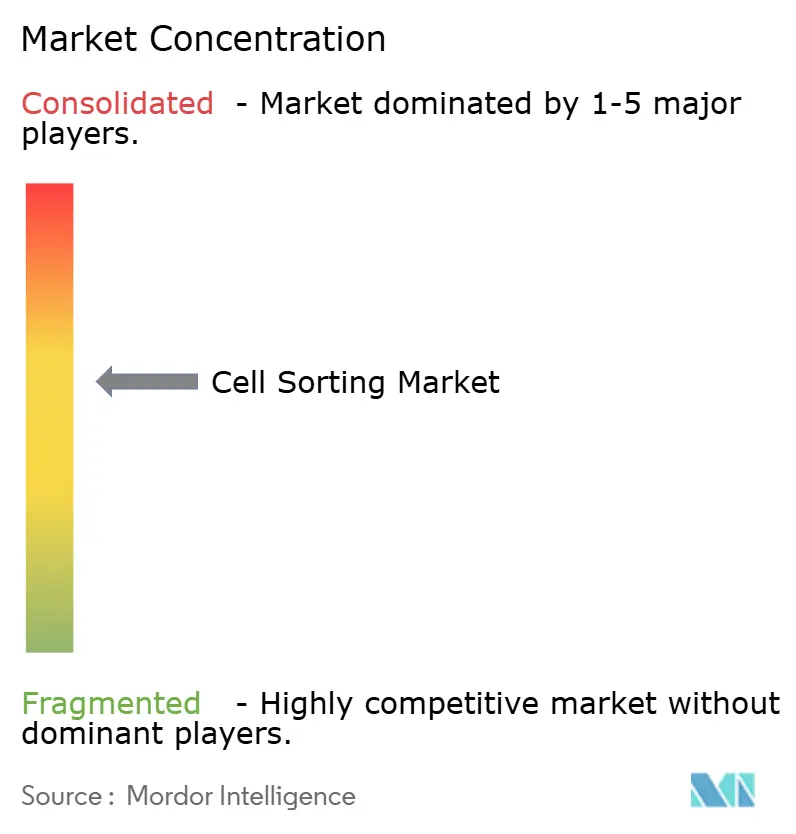
The cell sorting industry has a moderate concentration profile. BD’s FACSDiscover S8 commands premium pricing through 40-parameter detection and automated quality control. Danaher’s CytoFLEX SRT addresses mid-throughput needs, and the corporation’s 2024 acquisition of Cytek signals a bet on spectral technology. Thermo Fisher captures mid-market users with the Attune CytPix, bundling acoustic focusing and imaging to differentiate from droplet incumbents. Smaller challengers include NanoCellect with microfluidic units, Bulldog Bio with acoustic sorting platforms, and Akadeum Life Sciences with microbubble depletion kits.
Strategic patterns diverge. Integrated suppliers bundle instruments, reagents, and service plans, creating lock-in for large pharma. Open-architecture vendors court core facilities seeking flexibility on antibody sourcing and software. Patent activity centers on AI-assisted gating; BD’s February 2024 patent covers real-time morphology-based classification. Disruptors target neglected niches such as organoid screening and exosome sorting, suggesting future competition will hinge on automation depth, AI workflows, and expansion into non-traditional sample types. This evolving mix maintains competitive tension and spurs continuous innovation in the cell sorting market.
Cell Sorting Industry Leaders
Becton, Dickinson and Company
Bio-Rad Laboratories, Inc.
Sony Biotechnology Inc.
Miltenyi Biotec GmbH
Danaher
- *Disclaimer: Major Players sorted in no particular order
Cell Sorting Market Companies Covered in this Report
- 10x Genomics
- Akadeum Life Sciences
- Becton Dickinson & Co.
- Bio-Rad Laboratories
- Bio-Techne
- Bulldog Bio
- Cell Microsystems
- Cytek Biosciences
- Cytonome/St
- Danaher
- Fluidigm (Standard BioTools)
- Miltenyi Biotec
- NanoCellect Biomedical
- On-Chip Biotechnologies
- Owl Biomedical
- Sony Biotechnology
- Sysmex Partec
- Thermo Fisher Scientific

Market Opportunities and Future Outlook
A major whitespace sits in GMP-aligned, closed, and automated sorting or enrichment steps that reduce operator dependency while preserving viability for fragile cell types used in CGT and regenerative medicine. This is reinforced by manufacturing expansion signals in 2026, including Johnson & Johnsons announcement of more than USD 1 billion investment in a next-generation cell therapy manufacturing facility in Pennsylvania and Fujifilm Cellular Dynamics commissioning of a 175,000-ft2 Madison, Wisconsin site designed to expand iPSC-related research and manufacturing capacity. As new CGT suites come online, demand increases for validated workflows that combine high-parameter identification with reproducible separation. That supports opportunities for vendors that pair instruments with locked-down software, single-use fluidics, and documentation packages suited to regulated environments.
Technology whitespace is also visible in non-bead and microfluidic enrichment approaches that aim to reduce shear stress, hands-on time, and contamination risk, while improving recoveries for upstream processes. Multiple 2026 academic and technical publications described programmable electromagnetic microfluidics, inertial microfluidic enrichment approaches for T-cell workflows, and automated microfluidic platforms positioned for manufacturing-relevant cell handling. On the clinical side, FDA approval activity in advanced therapies continues to raise the bar for multi-component cellular manufacturing control, exemplified by Orca Biosystems Tregzi approval (June 30, 2026), which underscores the need for robust characterization and separation steps across complex immune subsets. Together, these developments create product and service opportunities across software-validated panel design, closed consumables, and contract sorting capacity that supports chain-of-custody and batch record requirements.
Recent Industry Developments in Cell Sorting Market
- January 2026: BD commercially released BD Research Cloud 7.0, adding AI-enabled capabilities such as BD Horizon Panel Maker to streamline panel design for immunology and oncology workflows. By reducing iteration time and standardizing complex panel setup, the update supports higher-parameter sorting adoption and increases the value of integrated software subscriptions alongside instruments and reagents.
- August 2025: Bio-Rad introduced additional StarBright dye options for spectral flow cytometry panel design, expanding the usable marker space for high-multiplex experiments. Broader dye availability strengthens consumables pull-through for labs upgrading to spectral and image-enabled sorters and reduces a common bottleneck in building reproducible, high-color panels.
- September 2024: Cellares and Sony announced a joint development collaboration to integrate flow cytometry-based sorting and online analysis into an automated, high-throughput cell therapy manufacturing platform. The collaboration links sorting directly with manufacturing automation, signaling a move toward in-line analytics and closed workflows that can simplify process validation and reduce manual handoffs in CGT production.


Cell Sorting Market Report Scope and Research Methodology
Market Definition and Coverage
This market covers tools and services used to separate cells from a mixed sample based on measurable traits, so that a lab gets a targeted cell population for research, diagnostics, or manufacturing workflows.
Scope exclusions: It does not count downstream lab testing that happens after sorting (for example, sequencing or imaging runs) unless it is sold as part of a sorting service.
Segments Covered in This Report
- By Technology
- Fluorescence-based Droplet Cell Sorting
- Spectral Flow Cell Sorting
- Image-Enabled Cell Sorting
- Magnetic-Activated Cell Sorting (MACS)
- Microfluidic (MEMS) Cell Sorting
- Acoustic & Dielectrophoresis-based Sorting
- By Product & Service
- Instruments
- Benchtop Sorters
- High-Parameter / Spectral Sorters
- Microfluidic Single-Cell Dispensers
- Reagents & Consumables
- Fluorochrome-Conjugated Antibodies
- Magnetic Beads & Columns
- Disposable Microfluidic Cartridges
- Sorting Buffers & Kits
- Services
- Cell Sorting Services
- CGT Manufacturing Sorting Services
- Instruments
- By Application
- Research Applications
- Cancer Research
- Immunology & Inflammation
- Stem-Cell & Developmental Biology
- Microbiology & Environmental
- Clinical Diagnostics
- HIV/CD4 Monitoring
- Leukemia & Lymphoma Phenotyping
- Cell & Gene Therapy Manufacturing
- Other Applications
- Research Applications
- By Cell Type
- Mammalian Cells
- T Cells
- B Cells
- NK Cells
- Stem Cells (iPSC, MSC)
- Tumour / CTCs
- Microbial Cells (Bacteria, Yeast)
- Exosomes & Extracellular Vesicles
- Mammalian Cells
- By End User
- Research & Academic Institutes
- Pharmaceutical & Biotechnology Companies
- Contract Manufacturers / CDMOs
- Clinical Diagnostic Laboratories
- Other End Users (CROs, Core Facilities)
- By Geography
- North America
- United States
- Canada
- Mexico
- Europe
- Germany
- France
- United Kingdom
- Italy
- Spain
- Rest of Europe
- Asia-Pacific
- China
- Japan
- India
- South Korea
- Australia
- Rest of Asia-Pacific
- Middle East & Africa
- GCC
- South Africa
- Rest of Middle East & Africa
- South America
- Brazil
- Argentina
- Rest of South America
- North America
Data Sources, Market Sizing, and Validation
Desk Research
Desk research was used to set the basic market map and the demand context before any modeling was finalized. We relied on public sources such as the US FDA databases for cleared or authorized diagnostic uses, NIH and similar grant databases to gauge funded single cell and immunology work, and CDC or comparable public health sources to understand testing loads that can influence cell analysis activity.
To keep the numbers grounded, trade and macro indicators were also reviewed. That included UN Comtrade for instrument and reagent trade signals, OECD and World Bank health and R&D indicators, and peer reviewed articles that describe adoption patterns for flow based sorting and magnetic sorting in real labs. We also used company filings, investor presentations, and reputable press to confirm product focus, pricing direction, and where installations are happening, then cross checked these with paid subscriptions used for company financials, patent coverage, and shipment level trade reads when needed. This list is illustrative, and many other sources were also used for data collection, validation, and clarification.
Primary Interviews and Surveys
Primary work centered on interviews and structured surveys with product managers, sales leaders, application specialists, lab managers, and procurement contacts who buy or influence cell sorting systems and consumables. We used these inputs to confirm adoption by application (research, clinical diagnostics, and cell and gene therapy manufacturing), typical replacement cycles, consumables pull through, and how service revenues show up in practice across APAC, EMEA, and the Americas.
Distribution of primary research fieldwork respondents
| Company type | Respondent position | Region |
|---|---|---|
| Top tier: 30% | CXOs: 16% | APAC: 46% |
| Mid tier: 54% | Functional/Unit leaders: 41% | EMEA: 36% |
| Smaller Players: 16% | Managers: 43% | Americas: 18% |
Market-Sizing & Forecasting
Sizing was built using top-down and bottom-up logic, starting with a top-down demand pool that is reconstructed from lab activity levels and installed base behavior, and then checked against selective supplier and channel signals. For cell sorting, the demand pool is shaped by the number of active research and clinical labs, the share of workflows that require sorting (especially immunology, oncology, and single cell work), and the typical split between instrument revenue and recurring reagents, consumables, and services.
Key model inputs included average selling prices for core instruments, annual reagent and consumable spend per active instrument, service attachment rates, replacement and upgrade cycles, and regional utilization patterns that change as funding and CGT manufacturing capacity expands. Where direct bottom-up coverage was incomplete, gaps were handled by using conservative ranges from interviews for adoption and spend, then narrowing the range through cross checks against trade and patent activity trends.
Forecasting used scenario analysis supported by simple multivariate regression on a small set of drivers that interviewees consistently linked to purchasing. These included life science R&D funding direction, clinical translation of cell therapies, and lab automation investment. The final forecast was adjusted only after the assumptions matched the way buyers describe budgeting, procurement timing, and the lag between new research programs and equipment purchases.
Data Validation & Update Cycle
Validation steps were applied before the numbers were signed off, so unusual jumps were investigated and explained rather than carried forward. We compared model outputs against independent signals such as visible pricing moves, major installation and expansion announcements, and changes in public funding intensity that can shift lab purchasing in a given year.
Anomaly checks were followed by a multi step analyst review, and respondents were re contacted when a key assumption moved outside the expected range for a region, application, or product mix. Reports are refreshed annually, and interim updates are made when material events occur that could affect demand, pricing, or supply. Before delivery, a final analyst pass is completed so clients receive the latest updated view.
Mordor Intelligence's Cell Sorting Market Size Compared With Other Published Estimates
Different published market sizes for cell sorting can look far apart because teams do not always count the same revenue streams, and they also choose different base years and growth setups. The spread is usually driven by what is treated as product revenue versus service revenue, how recurring consumables are tied to the installed base, and how quickly pricing is assumed to change.
Some estimates lean heavily on broad cell separation revenue, or they extend the scope into adjacent cell analysis tools that are not strictly used for sorting. In the model used by Mordor Intelligence, the total is limited to cell sorting instruments plus the linked reagents, consumables, and sorting services, and it is then stress tested using utilization and replacement cycle checks shared by labs and manufacturers.
Benchmark comparison
| Source | Market Size | Gaps in Research Methodology |
|---|---|---|
| Mordor Intelligence | USD 357.10 M (2025) | |
| Global Consultancy A | USD 261.10 M (2024) | Uses a different base year and may apply a tighter near term view of instrument placements, which can understate the consumables pull through that follows active sorter utilization. |
| Industry Publisher B | USD 262.30 M (2024) | Often relies on broad segment shares and regional splits that are not always rechecked against installed base behavior, and this can shift totals depending on how services and consumables are allocated. |
Taken together, the table shows that year selection and what gets counted alongside instruments are the main reasons the numbers do not match. We keep the estimate traceable by tying recurring revenues to practical usage drivers, then revalidating the outcome with interviews so the final view stays balanced and repeatable.


Key Questions Answered in the Report
What is the projected value of the cell sorting market in 2031?
The market is expected to reach USD 561.71 million by 2031.
Which segment will grow the fastest through 2031?
CGT manufacturing applications, with an 11.73% CAGR, lead growth.
How large is fluorescence-based droplet sorting within the market?
It represented 54.26% of cell sorting market share in 2025.
Why are services outpacing instrument sales?
Pharma and biotech firms outsource GMP-compliant sorting, driving an 11.45% CAGR for services.
Which regions present the highest growth rates?
Asia-Pacific leads with a projected 9.89% CAGR, driven by China’s CGT pipeline.
What is a primary barrier to wider adoption in smaller labs?
High instrument prices and maintenance contracts limit purchases among budget-constrained institutions.
Page last updated on:


 Your data is secure and never sold or shared.


