
Cell Harvesting Market Size and Share
Market Overview
| Study Period | 2020 - 2031 |
|---|---|
| Market Size (2026) | USD 7.57 Billion |
| Market Size (2031) | USD 13.86 Billion |
| Growth Rate (2026 - 2031) | 12.86 % |
| Fastest Growing Market | Europe |
| Largest Market | North America |
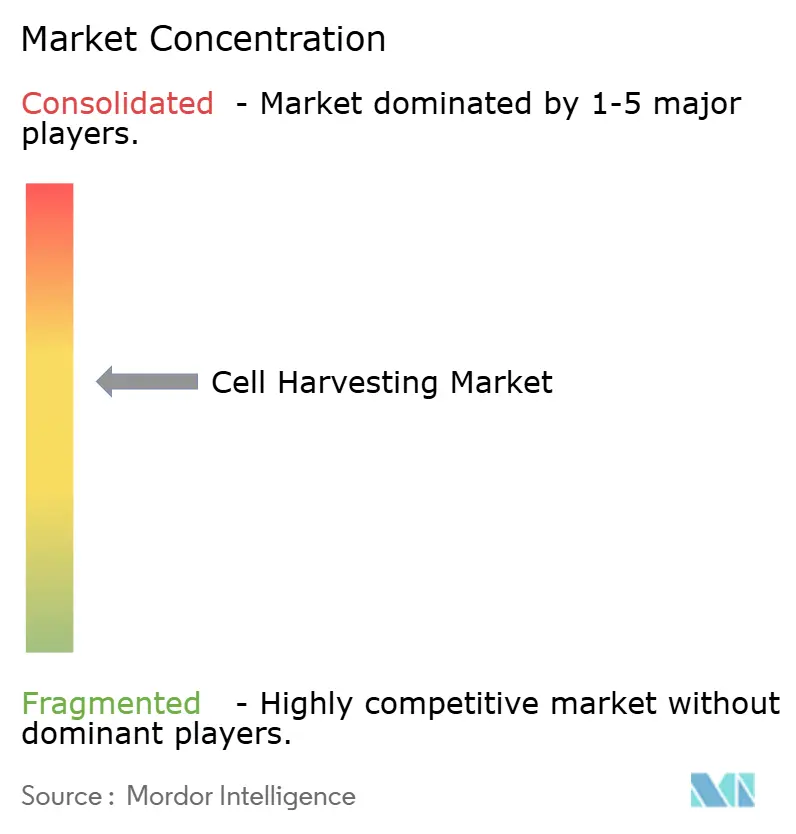
| Market Concentration | Medium |
Major Players *Disclaimer: Major Players sorted in no particular order Image © Mordor Intelligence. Reuse requires attribution under CC BY 4.0. | |
Cell Harvesting Market Analysis by Mordor Intelligence
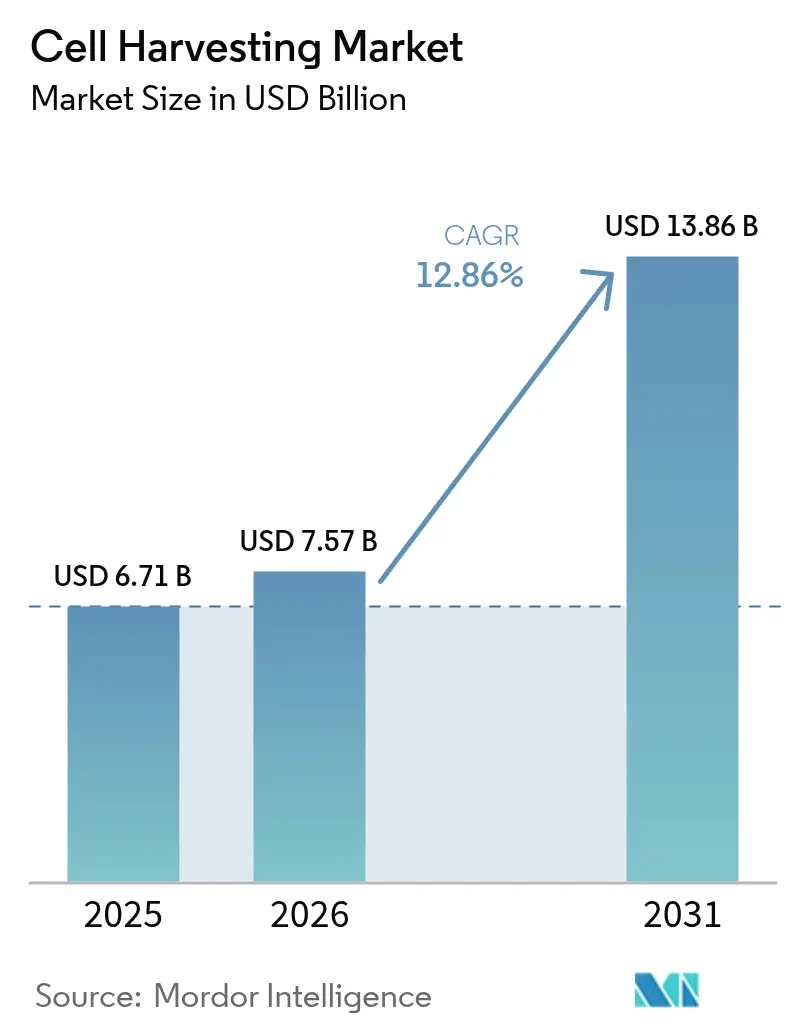
The cell harvesting market size in 2026 is estimated at USD 7.57 billion, growing from 2025 value of USD 6.71 billion with 2031 projections showing USD 13.86 billion, growing at 12.86% CAGR over 2026-2031. Widespread adoption of advanced, closed, and automated harvesters that cut labor requirements by up to 75% and improve batch consistency is the prime growth catalyst. Public- and private-sector financing worth USD 2.3 billion over the past decade, regulatory commitments to approve 10–20 cell and gene therapies per year, and supply-chain investments in point-of-care (PoC) manufacturing hubs reinforce this expansion. North American early-adopter demand, Asia-Pacific capacity build-outs, and continuous platform innovation that combines AI analytics with single-use hardware create additional momentum.
Key Report Takeaways
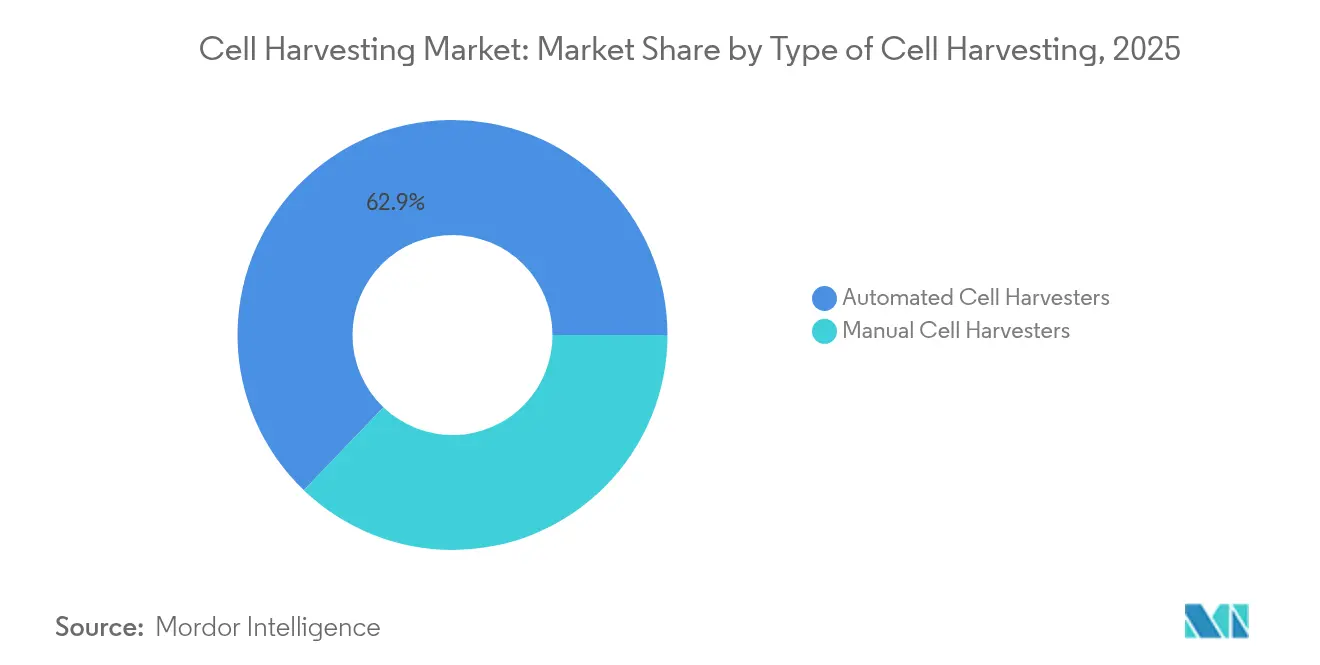
- By type of cell harvesting, automated cell harvesters held 62.85% share in 2025 and are projected to expand at a 14.92% CAGR through 2031.
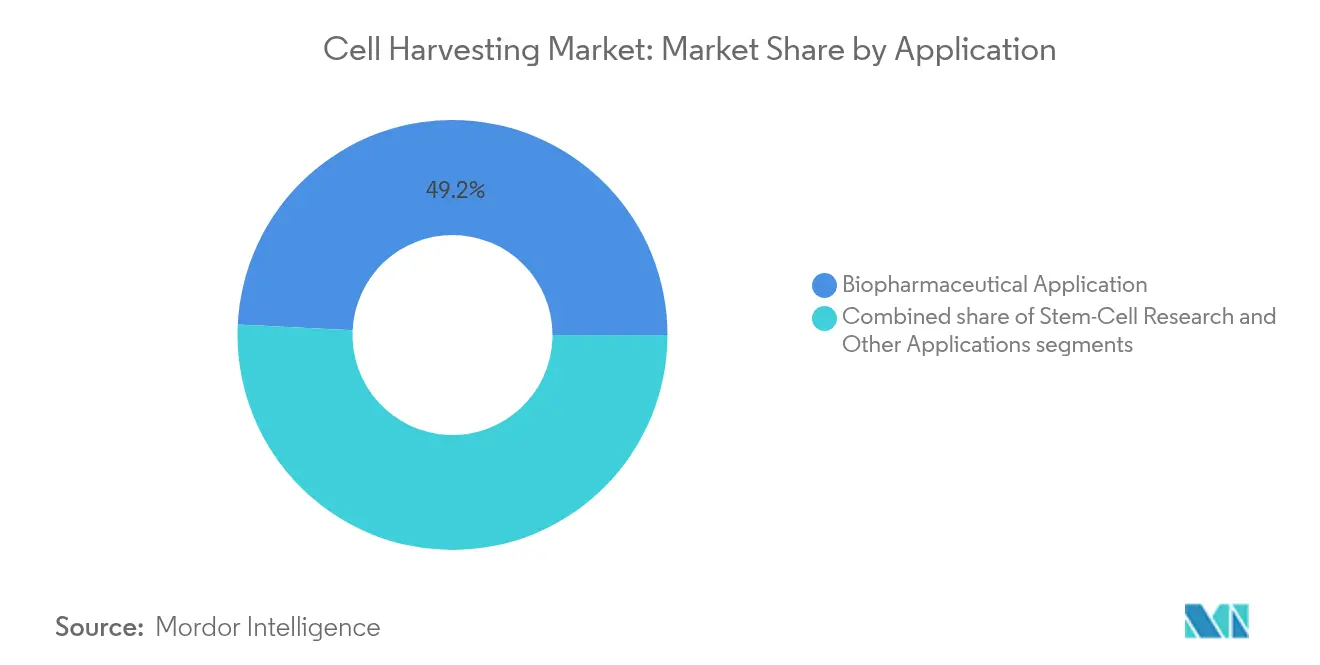
- By application, biopharmaceutical production accounted for 49.23% of revenue in 2025, while stem-cell research is expected to post a 16.05% CAGR to 2031.
- By end user, biotechnology and biopharmaceutical companies commanded 51.84% of the cell harvesting market size in 2025; research institutes are set to grow at a 15.67% CAGR during 2026-2031.
- By geography, North America contributed 38.95% of global sales in 2025, whereas Asia-Pacific is anticipated to deliver a 14.11% CAGR between 2026 and 2031.
Note: Market size and forecast figures in this report are generated using Mordor Intelligence’s proprietary estimation framework, updated with the latest available data and insights as of 2026.
Market Trends and Insights
Drivers Impact Analysis of Cell Harvesting Market*
| Driver | % Impact on CAGR Forecast | Geographic Relevance | Impact Timeline |
|---|---|---|---|
| Growing investment in cell and gene therapies | +3.2% | North America and Europe | Long term (≥ 4 years) |
| Expansion of biopharmaceutical manufacturing infrastructure | +2.8% | Global, APAC rising | Medium term (2–4 years) |
| Rising prevalence of chronic diseases requiring cell therapies | +2.1% | Global | Long term (≥ 4 years) |
| Technological advancements in automated cell processing | +2.4% | North America and EU, APAC adoption | Medium term (2–4 years) |
| Supportive regulatory frameworks for advanced therapies | +1.8% | North America, EU, Japan, South Korea | Medium term (2–4 years) |
| Emergence of personalized and PoC cell therapy platforms | +1.3% | North America and EU | Long term (≥ 4 years) |
| Source: Mordor Intelligence | |||
Growing Investment in Cell and Gene Therapies
More than USD 2.3 billion in equity has entered cell and gene therapy ventures during the last decade, underpinning over 1,500 active clinical studies worldwide[1]Journal of Translational Medicine, “Global Cell Therapy Market Forecast,” translational-medicine.biomedcentral.com. The FDA cleared eight novel advanced therapies in 2024, including the first mesenchymal stromal cell product, Ryoncil, demonstrating regulatory confidence in complex biologics[2]U.S. Food and Drug Administration, “Cellular & Gene Therapy Guidance Documents,” fda.gov. Pharmaceutical majors are scaling quickly: Bristol Myers Squibb opened three dedicated CAR-T plants, and AstraZeneca spent USD 425 million for EsoBiotec to accelerate in vivo programs. Capital inflows shorten development timelines and increase the volume of autologous and allogeneic batches that require reliable, high-throughput harvesters. Investors now prioritize platforms that can support multiproduct pipelines, lifting the appeal of integrated harvest devices with modular add-ons.
Expansion of Biopharmaceutical Manufacturing Infrastructure
Fujifilm Diosynth’s USD 1.6 billion Denmark-Texas expansion adds eight 20,000 L bioreactors and specialized downstream suites, while Lotte Biologics is committing USD 1 billion for its Songdo Bio Campus to reach 120,000 L capacity by 2027. Such mega-projects create regional clusters that need harvesters compatible with both single-use and stainless-steel trains. Many CDMOs still operate at less than 50% utilization, prompting demand for flexible systems that can cost-effectively handle clinical-scale autologous lots today and pivot to large allogeneic runs tomorrow. Suppliers offering modular skid architecture with interchangeable centrifugation or filtration elements address this utilization gap and can be rapidly redeployed as production priorities change.
Rising Prevalence of Chronic Diseases Requiring Cell Therapies
Cancer incidence and refractory hematological conditions continue to rise, expanding the pool of patients who may benefit from CAR-T and NK-cell therapies. Autologous treatment protocols demand time-critical harvesting of functional cells, motivating oncology centers to deploy closed, sterile harvest workstations. Parallel growth in orthopedic and cardiovascular regenerative applications fuels demand for large, high-quality mesenchymal stromal cell yields. Demographics in North America, Europe, and high-income Asian economies magnify this trend, as aging populations require novel regenerative interventions. Providers that can deliver consistent, viable harvests despite patient-to-patient variability are well placed to capture clinician trust.
Technological Advancements in Automated Cell Processing
Terumo BCT’s Quantum Flex system cuts harvest time by 88% relative to manual flasks while preserving >90% viability. Cellares reports 760% throughput gains and 80% floor-space savings with its Cell Shuttle compared with traditional laminar-flow suites. Sartorius’ Ksep instrument achieves >90% cell recovery under low-shear conditions, reducing contamination risks through single-use chambers. Emerging AI layers adjust spin speed and buffer exchanges in real time, lowering error rates that currently range from 4–10% in commercial CAR-T batches. Smaller footprints, lower headcount requirements, and digital batch records combine to improve cost-of-goods and regulatory traceability.
Restraints Impact Analysis of Cell Harvesting Market*
| Restraints Impact Analysis | (~) % Impact on CAGR Forecast | Geographic Relevance | Impact Timeline |
|---|---|---|---|
| Ethical and regulatory concerns around stem cell sourcing | -1.9% | Global, intensity varies by jurisdiction | Medium term (2–4 years) |
| High cost of automated harvesting systems | -2.3% | Global, greater impact in emerging markets | Short term (≤ 2 years) |
| Variability and quality control challenges in donor-derived cells | -2.0% | Global, pronounced where donor pools are heterogeneous | Medium term (2–4 years) |
| Cold-chain and logistics complexities for live cells | -1.6% | Global, especially regions with limited infrastructure | Short term (≤ 2 years) |
| Source: Mordor Intelligence | |||
Ethical and Regulatory Concerns Around Stem Cell Sourcing
Embryonic stem cell research and unproven adipose-derived procedures face increased oversight after U.S. appellate courts confirmed that reinjected cells fall under FDA biologics regulation. Divergent donor screening rules in the EU, United States, and Asia complicate multinational studies and raise documentation costs. Unlicensed clinics advertising miracle cures in regions with light enforcement undermine public confidence, prompting regulators to publish warning letters and mandate clinic closures. Compliant suppliers that document ethical sourcing and GMP provenance can differentiate, but they must navigate evolving consent requirements and tissue-bank audits that vary by country.
High Cost of Automated Harvesting Systems
Top-tier automated harvesters often exceed USD 1 million per unit, and annual validation plus service contracts add further burden. Smaller biotechs, early-stage academic labs, and emerging-market hospitals frequently lack capital to purchase such systems, postponing adoption. Manufacturing-as-a-service models are easing the pain: Cellares offers pay-per-batch access to its Cell Shuttle, eliminating upfront investment. Competitive pressure has spurred development of modular harvesters priced 20–30% below flagship devices, but the need for trained technicians and validated clean utilities continues to slow uptake in low-resource settings.
*Our forecasts treat driver/restraint impacts as directional, not additive. The impact forecasts reflect baseline growth, mix effects, and variable interactions.
Cell Harvesting Market Segment Analysis
By Type of Cell Harvesting:
Automation Drives Market EvolutionAutomated systems held 62.85% of the cell harvesting market share in 2025 thanks to closed, programmable workflows that cut labor hours and contamination risk. They are projected to record a 14.92% CAGR through 2031. Manual harvesters remain relevant for exploratory work or highly variable early-phase protocols that benefit from hands-on manipulation. However, even academic labs are adopting semi-automated modules that bolt onto legacy incubators, blending tactile oversight with digital monitoring. Industry-wide migration toward continuous processing and single-use assemblies will likely elevate automated systems to more than 70% of the cell harvesting market size by decade’s end.
Automation’s momentum aligns with factory digitization goals. Vendors are bundling integrated centrifugation, filtration, and washing in one chassis to streamline line clearance and validation. Remote diagnostics and software updates provide shorter downtimes and keep performance within specification. Suppliers able to certify systems in multiple jurisdictions and offer 24-hour parts support gain a competitive edge as global trials expand.


By Application:
Biopharmaceutical Dominance with Research AccelerationCommercial biologics accounted for 49.23% of the 2025 revenue pool, supported by an increasing number of on-market CAR-T products and regulatory approvals for next-generation allogeneic candidates. Autologous oncology programs drive batch volumes that must meet stringent sterility and timeline targets, reinforcing demand for robust harvest platforms. Meanwhile, stem-cell and regenerative medicine research is the fastest-growing application, advancing at a 16.05% CAGR to 2031. Investment in induced pluripotent stem cell lines, 3D organoid models, and CRISPR-edited therapeutics boosts laboratory harvesting requirements. High-throughput screen-expansion-harvest combinations permit scientists to analyze hundreds of cell lines per week, accelerating lead identification.
Cross-disciplinary convergence blurs historical boundaries. Vaccine developers adapting cell-based production, exosome therapy startups, and protein deuteration specialists are adopting the same harvest infrastructure. Vendors certified for multi-mode payloads gain preferential status because clients can amortize equipment across several programs. As product pipelines diversify, harvesters capable of switching from T lymphocytes to MSCs with minimal cleaning or changeover time become essential.
By End User:
Biotech Leadership with Academic GrowthBiotechnology and biopharmaceutical companies represented 51.84% of 2025 demand due to their focus on late-stage trials and commercial launches that require cGMP harvest capacity. They prefer integrated, high-throughput suites featuring automated cell collection, concentration, and buffer exchange modules. Academic and government institutes are the fastest-growing end user group, expanding at 15.67% CAGR, fueled by public grants and collaborative research initiatives. Canada’s USD 22.5 million grant to STEMCELL Technologies for a GMP plant exemplifies this support. Hospitals and specialized treatment centers are piloting PoC manufacturing, often via containerized cleanrooms that host compact harvesters. Suppliers offering turnkey service packages—compliance documentation, operator training, remote monitoring—stand to expand market reach among resource-constrained centers.
Geography Analysis
North America Cell Harvesting Market
North America held 38.95% of global revenue in 2025, supported by a mature CGT regulatory framework, extensive CDMO network, and specialized logistics operators. Yet fewer than 20% of eligible U.S. patients accessed available therapies in 2024, underscoring process inefficiencies that automated harvesters can mitigate. Regional growth also depends on skilled labor supply, prompting partnership programs between equipment vendors and community colleges to cultivate technicians.
APAC Cell Harvesting Market
Asia-Pacific is projected to expand at 14.11% CAGR to 2031. China hosted 37% of global CGT trials in 2024, and Japan’s Fast Track and South Korea’s Regenerative Medicine Law cut approval timelines. Domestic players like WuXi AppTec and SK Bioscience have invested heavily in CGT hubs, driving bulk orders for harvest modules compatible with local GMP guidelines. Lower operating costs, government incentives, and rising chronic-disease prevalence amplify demand, but suppliers must adapt to evolving import regulations and multilingual quality documentation.
EMEA and South America Cell Harvesting Market
Europe maintains a sizable share anchored by harmonized EMA guidelines and robust CDMO infrastructure in Denmark, Ireland, and Germany. Fujifilm Diosynth’s Danish plant expansion exemplifies continued capital inflow aimed at increasing regional self-sufficiency. Energy costs push facilities to adopt energy-efficient harvesters with shorter cycle times. The Middle East & Africa and South America are emerging opportunity zones as healthcare systems invest in tertiary care and establish bilateral technology-transfer agreements. Compact, rugged harvesters that tolerate power fluctuations find growing reception in these regions.


Regulatory Landscape
Regulation for cell harvesting equipment and workflows is largely framed through advanced therapy and biologics requirements that emphasize GMP, closed processing, traceability, and validated analytical methods. In the United States, the FDA has continued to publish and update guidance for cellular and gene therapy products and programs aimed at modernizing early- and late-stage clinical development expectations, tightening the link between manufacturing control strategies (including harvest, wash, and concentration steps) and product quality attributes.
In Europe, the EMA maintains the legal framework for advanced therapy medicinal products (ATMPs) and is progressing updates to ATMP-focused GMP guidance, reinforcing expectations around contamination control, documentation, and comparability when processes scale or move sites. Standard-setting for harvesting-adjacent controls is also becoming more explicit: ISO published new biotechnology standards in June 2026 covering cell viability analytical methods (ISO 8934-1:2026) and cell line authentication (ISO 23511), and advanced a draft international standard in March 2026 for equipment systems used in manufacturing cellular therapeutic products (ISO/DIS 23565). Together, these updates raise the compliance bar for equipment qualification and method standardization across jurisdictions.
Competitive Landscape
The cell harvesting market features moderate fragmentation, yet consolidation is accelerating. Thermo Fisher’s USD 4.1 billion acquisition of Solventum’s purification and filtration business and Danaher’s merger of Cytiva and Pall into a USD 7.5 billion bioprocess entity illustrate platform convergence. Large vendors leverage scale to offer integrated upstream-to-downstream suites, pressuring smaller specialists focused on single modalities. Mid-size firms differentiate via technological depth—for example, Miltenyi Biotec’s magnetic separation or Sartorius’ low-shear centrifugation—and by offering flexible financing plans attractive to smaller clients.
White-space opportunities center on point-of-care systems and AI-driven optimization layers. Orgenesis’ PoCare cabins and Cellares’ Cell Shuttle reduce capital outlay and operational complexity for autologous products. Emerging startups harness real-time imaging and predictive analytics to automate harvest end-points, attracting strategic partnerships with established equipment brands. Service models that bundle validation, remote monitoring, and cybersecure cloud batch records offer additional revenue streams and help vendors differentiate in an otherwise hardware-centric competitive arena.
Supply-chain resilience remains a strategic concern. Only a handful of companies can supply GMP-compliant, closed-system harvesters at commercial volumes across three continents. Manufacturers seeking dual sourcing push vendors to open regional assembly facilities and expand spare-parts depots to minimize downtime.
Cell Harvesting Industry Leaders
Perkin Elmer Inc.
Sartorius AG
Terumo Corporation
Danaher Corporation
Thermo Fisher Scientific Inc.
- *Disclaimer: Major Players sorted in no particular order
Cell Harvesting Market Companies Covered in this Report
- Thermo Fisher Scientific
- Danaher (Cytiva, Beckman Coulter)
- Sartorius
- Miltenyi Biotec
- Becton Dickinson & Co.
- Lonza Group
- Stem Cell Technologies
- Corning
- PerkinElmer
- Eppendorf
- Greiner Bio-One
- Eurofins
- Terumo
- Nipro
- Tomtec Inc.
- Alcami
- Esco Lifesciences
- PromoCell
- CellGenix
- Regen Lab SA
- PluriStem Therapeutics

Market Opportunities and Future Outlook
White-space opportunities are concentrated in closing remaining manual and open processing steps around harvest, particularly where therapy developers and CDMOs want end-to-end closed workflows that reduce operator touchpoints and simplify batch records. Thermo Fisher Scientifics 2026 introductions in the Gibco CTS portfolio, including the CTS Compleo Fill and Finish System (April 2026) and an integrated platform positioned for scalable cell therapy manufacturing (May 2026), reflect ongoing buyer pull for integrated, functionally closed unit operations that reduce cleanroom burden and changeover time. ScaleReadys GatheRex launch (April 2026) targets automation of media removal and cell collection from G-Rex bioreactors, pointing to demand for purpose-built harvest automation around widely used expansion formats.
A second opportunity area is capacity build-outs and supply chain resilience efforts that reward standardized, high-throughput, single-use compatible harvesting and clarification. In July 2026, Johnson & Johnson announced a more than USD 1 billion investment in a next-generation cell therapy manufacturing facility in Pennsylvania, while AGC Biologics announced a USD 350 million Yokohama site for cell therapy and other modalities (April 2026) and Kincell Bio expanded its Research Triangle Park facility with additional ISO 7 cleanroom suites (April 2026). These moves support more multi-site tech transfers and scale-ups where harmonized harvesting equipment, validation packages, and analytical standards (including ISO activity in 2026) can become procurement differentiators, especially for CDMOs supporting both autologous and allogeneic programs.
Recent Industry Developments in Cell Harvesting Market
- June 2026: I&L Biosystems partnered with GEA to distribute the kytero 10 single-use disk-stack centrifuge for cell harvesting in the Benelux region. The move expands access to single-use, GMP-aligned clarification and harvesting hardware through a regional channel, supporting faster deployment for CDMOs and therapy developers scaling closed processing.
- April 2026: Thermo Fisher Scientific introduced the Gibco CTS Compleo Fill and Finish System to automate cell therapy formulation and filling in a functionally closed setup. By tightening the link between downstream handling and final fill, the launch supports more standardized manufacturing lines where harvesting and post-harvest steps are designed to reduce open manipulations and documentation friction.
- December 2024: The FDA approved Ryoncil, described as the first mesenchymal stromal cell therapy for pediatric graft-versus-host disease. The approval reinforced regulatory willingness to clear complex cell-based products, increasing emphasis on validated harvesting, washing, and viability control strategies that underpin consistent product release.


Cell Harvesting Market Report Scope and Research Methodology
Market Definition and Coverage
This market covers the tools and systems used to detach, collect, and recover cells from culture surfaces or bioreactor streams so the cells can move into downstream steps like washing, concentration, or further processing.
Scope exclusions: We do not count upstream cell culture media and reagents, downstream chromatography and fill-finish equipment, or therapy administration services unless they are bundled and priced as part of the harvesting system.
Segments Covered in This Report
- By Type of Cell Harvesting
- Manual Cell Harvesters
- Automated Cell Harvesters
- By Application
- Biopharmaceutical Application
- Stem-Cell Research
- Other Applications
- By End User
- Biotechnology & Biopharmaceutical Companies
- Research Institutes
- Other End Users
- Geography
- North America
- United States
- Canada
- Mexico
- Europe
- Germany
- United Kingdom
- France
- Italy
- Spain
- Rest of Europe
- Asia-Pacific
- China
- Japan
- India
- Australia
- South Korea
- Rest of Asia-Pacific
- Middle East & Africa
- GCC
- South Africa
- Rest of Middle East & Africa
- South America
- Brazil
- Argentina
- Rest of South America
- North America
Data Sources, Market Sizing, and Validation
Desk Research
Desk research helped set the technical boundary and gather starting data points that we could check across multiple sources. We mainly used public sources such as the US FDA databases for biologics and manufacturing updates, the NIH and PubMed for cell therapy and bioprocess publications, and OECD health and science indicators to understand country-level R&D direction. Trade signals were also reviewed using sources such as UN Comtrade for relevant equipment flows, along with customs style import export summaries where available.
On the supply side, we reviewed annual reports, investor presentations, and product documentation to understand typical system configurations, selling models, and replacement cycles. In a few spots, we used paid subscriptions that aggregate company financials and news, patent databases, and shipment level import export records to cross check company exposure and technology activity. The source list above is not exhaustive, and we referred to additional public materials for validation and research clarification.
Primary Interviews and Surveys
Primary work was used to confirm which harvesting methods are most commonly purchased, how pricing shifts with automation and closed processing, and where demand is coming from across biopharma manufacturing and research labs. We spoke with a mix of manufacturers, distributors, end users, and process specialists across APAC, EMEA, and the Americas, so assumptions on adoption timing, utilization, and replacement could be corrected before finalizing the model.
Distribution of primary research fieldwork respondents
| Company type | Respondent position | Region |
|---|---|---|
| Top tier: 39% | CXOs: 12% | APAC: 44% |
| Mid tier: 47% | Functional/Unit leaders: 39% | EMEA: 30% |
| Smaller Players: 14% | Managers: 49% | Americas: 26% |
Market-Sizing & Forecasting
Sizing is built using a top-down approach where bioprocessing and cell therapy activity is translated into an addressable harvesting demand pool by region, and then converted into revenue using typical equipment and consumables spending patterns. To keep it grounded, we corroborated the totals with selective bottom-up checks, such as sampled product price points, distributor feedback, and an approximate roll up of supplier exposure where public financial splits were clear.
Inputs used in the model include the number of active biomanufacturing sites and expansions, estimated cell therapy and biologics pipeline momentum, the share of processes moving to closed and automated workflows, replacement and service cycles for harvesting setups, and observed pricing differences between manual and automated systems. For the forecast, scenario analysis was used so adoption speed and capital spend cycles could be varied, then aligned back to what experts described as realistic planning ranges. When coverage gaps appeared in smaller countries or niche applications, we applied proxy ratios from similar markets and reviewed them again during validation.
Data Validation & Update Cycle
Outputs are checked against independent signals like manufacturing capacity additions, regulatory and funding activity, and observed purchasing patterns from channel conversations. If the model creates a sharp year-to-year jump that cannot be explained by a known trigger, the assumptions are reopened, and follow-up calls are made to confirm what changed. Before sign off, the work goes through multi step analyst reviews, including variance checks across regions and across manual versus automated spend shares.
Reports are refreshed annually, and interim updates are made when material events shift demand or pricing. Right before delivery, we complete a fresh pass so the final view reflects the latest available public updates and the newest interview feedback.
Mordor Intelligence's Cell Harvesting Market Size Measured Against Other Published Estimates
Published market sizes for cell harvesting can differ a lot, even when the topic label looks the same, because each publisher draws the boundary and the year basis in a different way. The main drivers are usually what is counted as harvesting versus adjacent steps, the treatment of manual tools versus automated systems, and the way currency timing and inflation are handled.
Regulatory and capacity signals, such as biologics and cell therapy manufacturing expansions and the mix shift toward closed processing, are evidence checks that tie Mordor Intelligence's estimate to a realistic purchasing cycle, instead of letting broad lab equipment spend inflate the harvesting total. Differences also come from whether a source starts from a 2024 demand snapshot, or a 2026 modeled base year, and whether service revenue and general cell processing tools are bundled into the number without a clear rule.
Benchmark comparison
| Source | Market Size | Gaps in Research Methodology |
|---|---|---|
| Mordor Intelligence | USD 7.57 B (2026) | |
| Global Consultancy A | USD 6.87 B (2025) | Uses a different base year and is framed as cell harvesting systems, which can shift the total depending on whether manual tools and certain downstream preparation steps are counted consistently across end users. |
| Industry Publisher B | USD 6.29 B (2024) | Earlier base year and a longer forecast window, with less clarity on how automated versus manual harvesting revenue is separated from broader lab and bioprocess tool spending, which can compress the stated current market value. |
The table shows that the spread is mainly explained by base year choice and how tightly the harvesting boundary is defined around the actual harvesting workflow. By keeping the model anchored to observable manufacturing activity, adoption of automated harvesting, and realistic replacement cycles, the resulting value stays traceable to inputs that can be reviewed and repeated.


Key Questions Answered in the Report
What is the current size of the cell harvesting market?
The cell harvesting market size is USD 7.57 billion in 2026 and is forecast to reach USD 13.86 billion by 2031.
Which segment holds the largest cell harvesting market share?
Automated cell harvesters led with a 62.85% share in 2025, driven by demand for process intensification.
Which application area is growing fastest?
Stem-cell research is registering a 16.05% CAGR through 2031, making it the most rapid-growth application.
Which region is expected to expand quickest?
Asia-Pacific is projected to achieve a 14.11% CAGR to 2031 due to regulatory fast-track programs and extensive clinical trial activity.
What are the key restraints limiting adoption of automated harvesters?
High capital cost—often exceeding USD 1 million per unit—and varying ethical regulations on stem cell sourcing continue to impede widespread uptake.
How consolidated is the competitive landscape?
The market scores a 6 on a 10-point concentration scale, with the top five vendors holding around 60% of worldwide revenue.
Page last updated on:


 Your data is secure and never sold or shared.


