
Cell Counting Market Size and Share
Market Overview
| Study Period | 2020 - 2031 |
|---|---|
| Market Size (2026) | USD 12.39 Billion |
| Market Size (2031) | USD 17.71 Billion |
| Growth Rate (2026 - 2031) | 7.40 % |
| Fastest Growing Market | Asia-Pacific |
| Largest Market | North America |
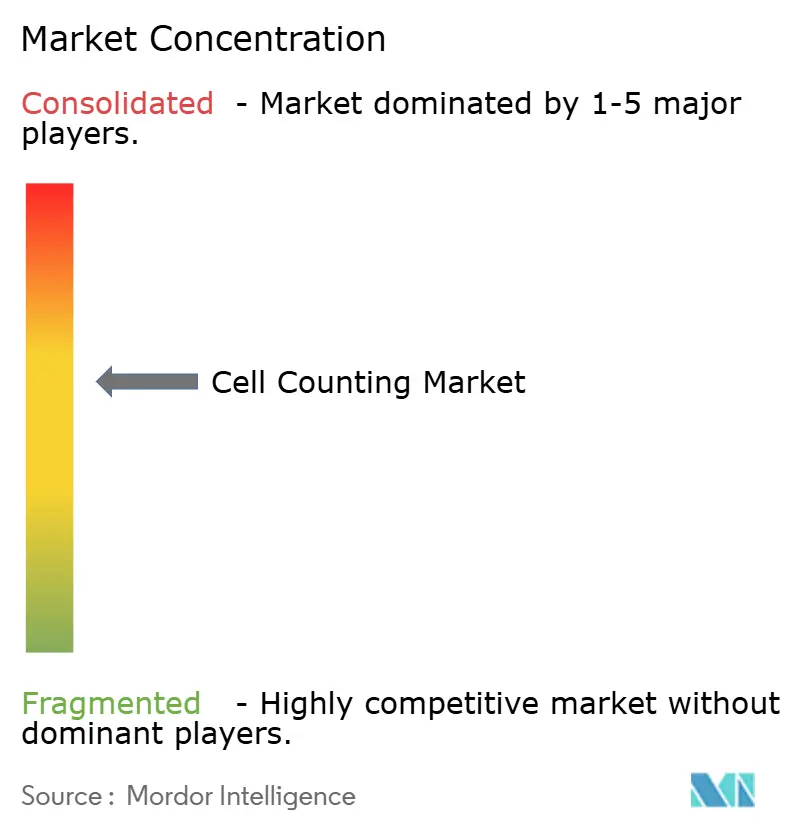
| Market Concentration | Medium |
Major Players *Disclaimer: Major Players sorted in no particular order Image © Mordor Intelligence. Reuse requires attribution under CC BY 4.0. | |
Cell Counting Market Analysis by Mordor Intelligence
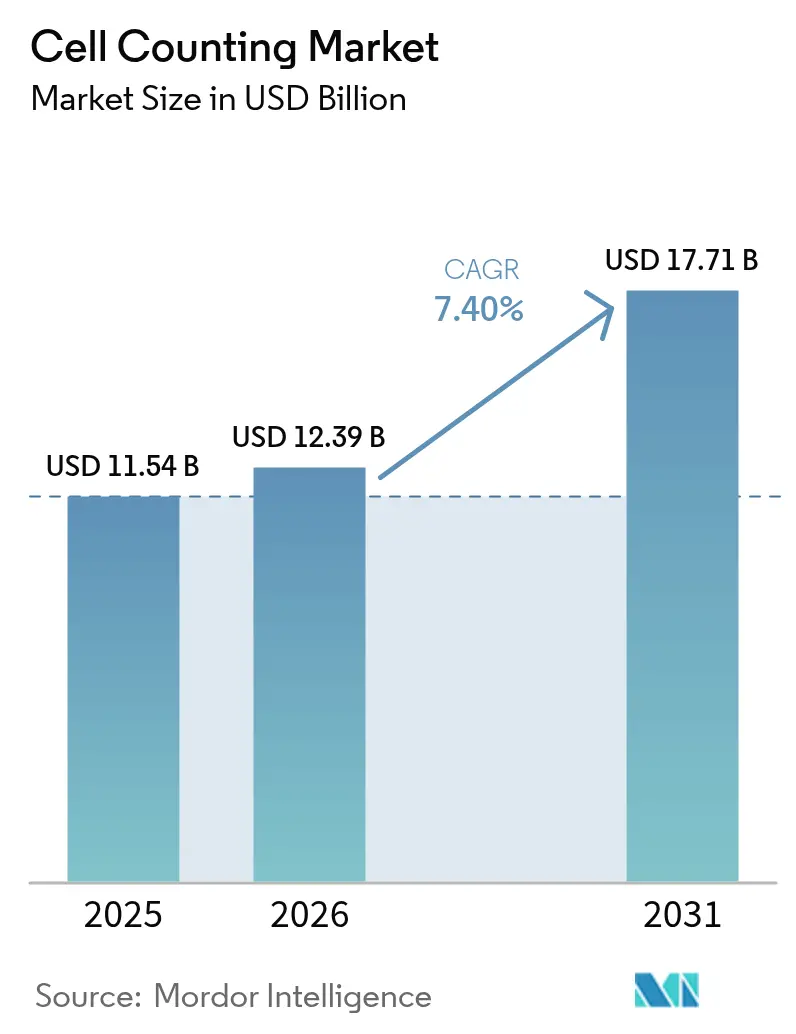
The cell counting market size was valued at USD 11.54 billion in 2025 and estimated to grow from USD 12.39 billion in 2026 to reach USD 17.71 billion by 2031, at a CAGR of 7.40% during the forecast period (2026-2031). Continued demand for precision diagnostics, tighter process control in cell-therapy manufacturing, and the routine use of real-time viable cell density monitoring in single-use bioprocessing sustain this robust expansion. Consumables remain the economic engine, as laboratories purchase reagents, assay kits, and media every day to keep culture workflows running. Image-based and microfluidic platforms equipped with machine learning are widening access to high-quality counts, reducing operator subjectivity, and cutting turnaround times. Capital investment decisions are guided by the need to integrate automation and AI so that one platform can handle routine hematology, multiparametric flow cytometry, and advanced regenerative-medicine assays within the same ecosystem. North America’s early adoption of spectral cytometry and Asia-Pacific’s race to build local cell therapy capacity jointly anchor near-term revenue visibility, while supply-chain resilience strategies are tempering risk.
Key Report Takeaways
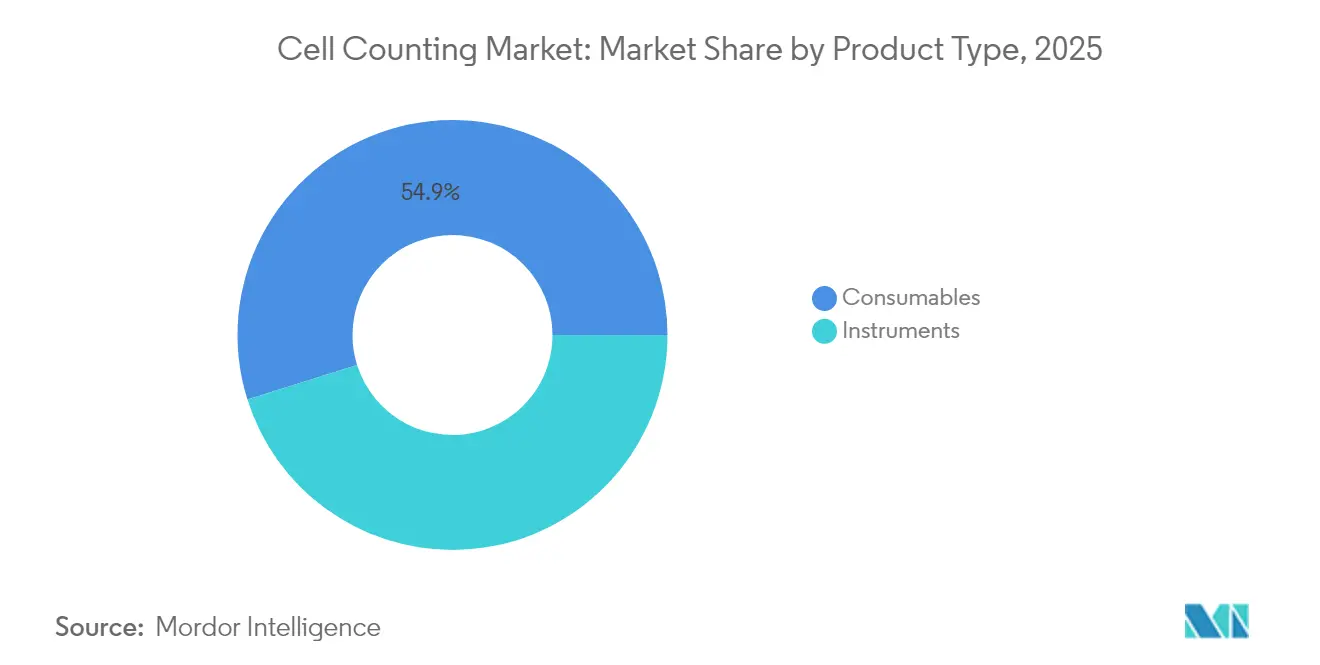
- By product type, consumables commanded 54.85% of 2025 revenue; instruments will expand at a 7.60% CAGR to 2031.
- By application, research led with 40.10% of 2025 revenue, while clinical diagnostics is advancing at a 7.55% CAGR.
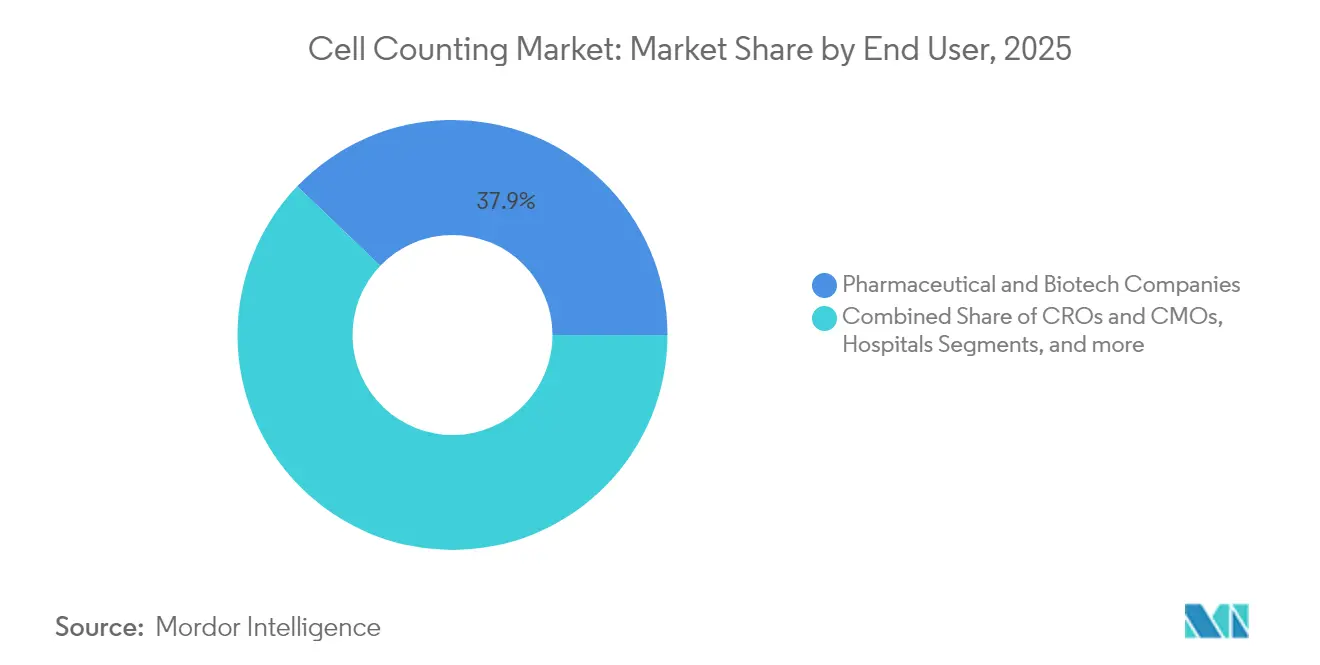
- By end-user, pharmaceutical and biotech companies controlled 37.85% of demand in 2025; hospitals and clinical labs are growing fastest at 7.88% CAGR.
- By technology, flow cytometry held 44.10% revenue share in 2025, whereas image-based cytometry is projected to grow at an 8.02% CAGR.
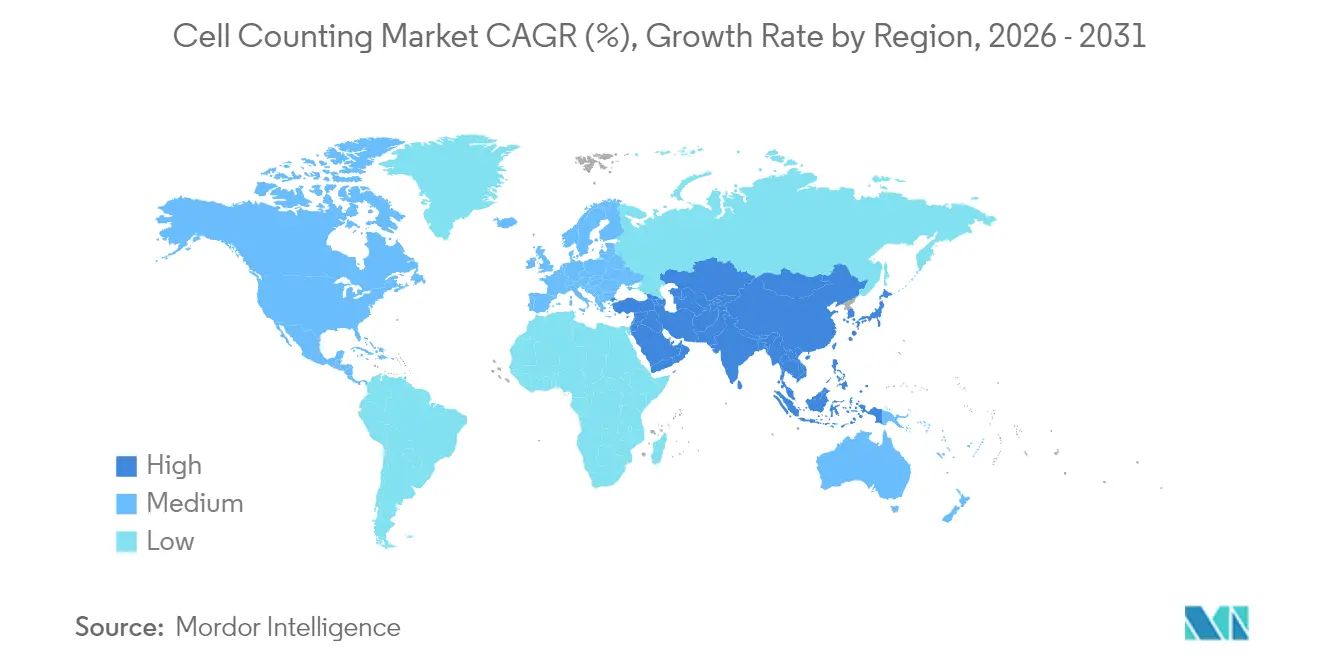
- By region, North America captured 39.20% of 2025 revenue; Asia-Pacific is forecast to show the strongest 7.66% CAGR through 2031.
Note: Market size and forecast figures in this report are generated using Mordor Intelligence’s proprietary estimation framework, updated with the latest available data and insights as of 2026.
Market Trends and Insights
Drivers Impact Analysis of Cell Counting Market*
| Driver | ( ~ ) % Impact on CAGR Forecast | Geographic Relevance | Impact Timeline |
|---|---|---|---|
| Growing incidence of target diseases & blood disorders | +1.2% | North America, Europe | Medium term (2-4 years) |
| High-throughput flow cytometry & automated hematology analyzers | +1.8% | North America, Europe, APAC | Short term (≤ 2 years) |
| AI-powered image-based cell counters for regenerative medicine | +1.5% | US, Japan, Germany | Medium term (2-4 years) |
| Microfluidic lab-on-chip cell counting in point-of-care testing | +1.0% | APAC, MEA, Latin America | Long term (≥ 4 years) |
| Single-use bioprocessing boosting real-time monitoring | +0.8% | North America, Europe, China, India | Medium term (2-4 years) |
| Label-free impedance-based cytometry for rapid QC | +0.6% | North America, Europe | Long term (≥ 4 years) |
| Source: Mordor Intelligence | |||
Growing Use of High-throughput Flow Cytometry & Automated Hematology Analyzers
New spectral flow cytometers such as Beckman Coulter’s CytoFLEX mosaic offer 88 detection channels and nanoparticle sensitivity down to 80 nm, enabling deep immunophenotyping that exceeds the limits of traditional 10-color panels. Spectral unmixing algorithms remove complex compensation steps and shrink operator training requirements, while automated hematology systems from Sysmex and Siemens Healthineers integrate coagulation and immunology modules to streamline consolidated testing workflows. Combined, these platforms reduce sample hand-offs, lower error rates, and allow labs to scale routine counts and specialized assays on a single software spine.
Rising Adoption of AI-powered Image-based Cell Counters for Regenerative Medicine
Machine learning-enabled image analysis drives consistent enumeration even when operators vary in skill. The Singapore-MIT Alliance for Research and Technology showed that UV absorbance spectroscopy paired with AI detects microbial contamination in 30 minutes versus 14 days for sterility culture tests. NanoEntek’s fluorescence-based counters differentiate live and dead CAR T cells from tiny sample volumes, trimming reagent costs and supporting precise dosing. Deep learning libraries built on diverse donor samples adapt to different culture conditions, solving historical challenges caused by clumping and debris.
Integration of Microfluidic Lab-on-a-chip Cell Counting in Point-of-care Testing
Smartphone-linked chips count 10^5–10^7 cells/mL with accuracy comparable to benchtop flow cytometers while fitting in a clinician’s pocket. BD’s MiniDraw fingertip sampling kit pairs seamlessly with such platforms, widening access to near-patient complete blood counts. By coupling bright-field imaging with automated recognition algorithms, these devices produce live-dead discrimination without staining, bringing CD4+/CD8+ enumeration and fetal cell analysis to remote clinics.
Expansion of Single-use Bioprocessing Driving Demand for Real-time Viable Cell Density Monitoring
Sartorius Stedim’s ambr miniature bioreactors yielded 125 × 10^6 cells/mL and cut media consumption by 87%, yet such intensification requires in-situ monitoring so that sterile bags remain closed. Raman probes mounted through disposable ports now predict metabolite trends and viable density in perfusion systems, eliminating contamination risk. Corning’s cloud-connected confluence sensors let operators adjust feed profiles remotely, improving batch consistency.
Restraints Impact Analysis of Cell Counting Market*
| Restraint | ( ~ ) % Impact on CAGR Forecast | Geographic Relevance | Impact Timeline |
|---|---|---|---|
| High cost of advanced cell counting systems & maintenance | -1.8% | Global, higher in developing markets | Short term (≤ 2 years) |
| Shortage of skilled technicians in low-income regions | -1.2% | APAC, MEA, Latin America | Medium term (2-4 years) |
| Standardization gaps in digital cell-imaging analytics hindering cross-lab reproducibility | -0.9% | Global | Medium term (2-4 years) |
| Data-integrity compliance burdens slowing cloud-connected device rollout | -0.7% | Global | Medium term (2-4 years) |
| Source: Mordor Intelligence | |||
High Cost of Advanced Cell Counting Systems & Maintenance
Spectral flow cytometers can exceed USD 500,000, and annual service contracts often add 10–15% of purchase price. Core facility surveys confirm that upkeep competes with funding for new assays, pressing labs to stagger upgrades or share instruments. Smaller clinics in emerging economies face steeper barriers because manufacturer service hubs cluster around major urban centers.
Shortage of Skilled Technicians in Low-income Regions
Flow cytometry demands mastery of optics, compensation theory, and large-file data analytics, whereas advanced image-based instruments require familiarity with AI model validation. Many training programs lag behind commercial innovation, and skilled operators migrate to wealthier regions, leaving rural and peripheral labs under-utilizing expensive assets. Remote-learning modules and simplified end-user interfaces help, yet sustainable competence still hinges on long-term investment in local education programs.
*Our forecasts treat driver/restraint impacts as directional, not additive. The impact forecasts reflect baseline growth, mix effects, and variable interactions.
Cell Counting Market Segment Analysis
By Product Type:
Consumables Drive Recurring Revenue GrowthConsumables captured 54.85% of cell counting market share in 2025 and are tracking a 7.14% CAGR toward 2031. Reagents, assay kits, sera, and single-use sensors are reordered continuously, unlike instruments whose purchases are episodic. The shift to disposable bioreactors reinforces this dynamic because every new batch requires a fresh set of sterile bags, tubing, and media supplements. Within consumables, specialized growth media tailored for stem-cell expansion command premium pricing due to stringent purity requirements, while viability assay kits that combine fluorometric stains with apoptotic markers are displacing trypan-blue methods. Instruments, although a smaller revenue pool, set the installed-base foundation that fuels downstream consumables. Spectrophotometers remain ubiquitous in academia for quick density checks, yet multiparametric flow cytometers and image-based counters are becoming indispensable in therapy production suites where morphology, viability, and phenotype must be tracked in parallel.
The installed fleet of automated cell counters is splitting along two innovation tracks. Image-based models leverage high-resolution CMOS sensors and cloud analytics to return confluence, viability, and morphology readouts in under 30 seconds, while impedance-based devices offer label-free counts ideal for hematopoietic stem cell transplants where minimal manipulation is vital. Microfluidic chip counters further promise to reduce reagent volumes by orders of magnitude, making them attractive for high-cost cell therapy batches that cannot spare large sample volumes. As instrument vendors adopt pay-per-use cloud licenses, laboratories in budget-constrained settings gain entry without large capital outlays, yet long-term cost of ownership remains tied to consumables subscription models embedded in reagent cartridges.

By Application:
Clinical Diagnostics Accelerate Automation AdoptionResearch activities maintained 40.10% of 2025 revenue as oncology, immunology, and vaccine programs continue to absorb high-throughput platforms. Tumor organoid screening requires precise seeding densities and viability confirmation before drug dosing, while CRISPR screens depend on accurate counts to normalize editing efficiencies. Clinical diagnostics, though smaller in absolute terms, will outpace research by growing at 7.55% CAGR as hospitals automate hematology lines and deploy point-of-care analyzers capable of providing differential counts within five minutes of finger-stick collection. Digital smear analysis cuts pathologist review time, enhancing diagnostic throughput during seasonal surges of hematologic testing.
Industrial and bioprocess segments are advancing as real-time viable cell density becomes mandatory for both fed-batch and continuous perfusion modes. Raman and capacitance sensors feed closed-loop controllers that adjust glucose or lactate feeds to stabilize metabolic profiles, mitigating batch-to-batch variability. Environmental testing has emerged as a niche, with breweries and water-treatment plants adopting rapid microfluidic counters to detect microbial contamination faster than plate counts. Combined, these trends ensure diversified demand so that no single application dominates the cell counting market.
By End-User:
Hospitals Embrace Automation for Efficiency GainsPharmaceutical and biotech companies consumed 37.85% of 2025 outlays, leveraging automated capacity for screening, process development, and release testing. Continuous manufacturing pilots in gene therapy rely on in-line counters synchronized with process analytical technology frameworks to maintain evidence trails for regulators. CROs and CMOs adopt flexible counters that can toggle between research-grade and GMP-compliant modes, catering to variable client requirements. Hospitals and clinical labs, growing at 7.88% CAGR, push suppliers to integrate robotics so one technician can supervise multiple instruments. BD and Biosero’s robotic link reduces human touchpoints, raising daily throughput without adding headcount bd.com. Academic centers remain vital early-adopter hubs; they test prototype features such as unsupervised gating algorithms before these trickle into mainstream clinical versions.
In low-resource settings, NGOs finance the deployment of portable analyzers for HIV monitoring and maternal health programs. These devices combine microfluidic chips, solar-charged batteries, and smartphone interfaces, reflecting an inclusive design philosophy that widens the cell counting market. Public-private partnerships explore lease-to-own models so district hospitals can shift capital expenditure into manageable operating payments, sustaining instrument fleets and driving recurring reagent demand.
By Technology:
Image-Based Systems Gain AI-Powered AdvantagesFlow cytometry retained 44.10% revenue share in 2025 thanks to regulatory familiarity and unmatched multiplex throughput. Spectral flow advances collapse fluorescence overlap issues, enabling 40+ color panels in routine labs and pushing experimental design toward systems-level immunoprofiling. Yet image-based cytometry is set to expand at 8.02% CAGR to 2031 because AI eliminates subjective gating and extracts morphological context absent from light-scatter data. Vendors embed convolutional neural networks validated on open datasets to meet reproducibility expectations of peer-review journals and regulators, accelerating trust in automated output cellandgene.com.
Spectrophotometry retains a foothold when cost and simplicity trump granularity; yeast-based fermentation labs appreciate the absence of staining and low calibration overhead. Impedance counters offer reagent-free operation ideal for stem-cell harvesting stations concerned about functional residue contamination. Microfluidic chips consolidate hydrodynamic focusing, staining, and imaging on a credit-card-sized substrate, opening doors for rugged field units used in disaster-relief clinics or animal health campaigns. Collectively, these technology options ensure end-users can match analytical depth to budget and workflow needs, preserving the diversified appeal of the cell counting market.
Geography Analysis
North America Cell Counting Market
North America led the cell counting market with 39.20% revenue share in 2025 on the back of a mature biopharmaceutical manufacturing base, heavy federal research funding, and quick integration of next-generation cytometry in clinical pathways. The United States benefits from FDA device-clearance momentum for automated hematology and home-use differential counters, encouraging hospitals and at-home care providers to adopt advanced platforms. Canada’s public health labs deploy image-based systems for hematologic malignancy surveillance, while Mexico’s growing medical-device import incentives widen access to mid-range analyzers. Across the region, integrated service networks ensure downtime is minimal, strengthening customer loyalty to incumbent vendors.
APAC Cell Counting Market
Asia-Pacific is the fastest-growing territory, projected at 7.66% CAGR, underpinned by China’s push to localize cell therapy supply chains and Japan’s expedited regulatory routes for regenerative-medicine products. Government grants fund the build-out of GMP suites, each anchored by high-throughput counters that guarantee process consistency. South Korea, leveraging its biosimilar leadership, invests in continuous perfusion plants where real-time capacitance probes guard against culture crashes. India’s vaccine hubs adopt low-cost microfluidic instruments, pairing them with digital dashboards to satisfy stringent batch-release documentation. Australia’s translational institutes emphasize point-of-care deployment in remote communities, fostering demand for rugged field analyzers.
Regulatory Landscape
In the United States, cell counting instruments used for clinical decision-making commonly route through FDA 510(k) pathways, with multiple hematology and home-use type clearances reinforcing expectations around analytical performance, software validation, and Quality System Regulation compliance (21 CFR Part 820). Recent clearances in this scope include HemoScreen Hematology Analyzer (May 2024) and Cito CBC System (February 2025). In 2026, the FDA cleared Athelas Home (February 2026) for automated white blood cell and neutrophil percentage determination, and the SMART M-CELL PRP Concentration System (April 2026), underscoring continued regulator scrutiny of accuracy, usability, and data integrity in decentralized and automated workflows.
In Europe, device commercialization is shaped by the EU MDR and IVDR frameworks and the capacity and processes of notified bodies. Commission Implementing Regulation (EU) 2026/977 (May 2026) introduced uniform quality management and procedural requirements for conformity assessments conducted by notified bodies, tightening procedural consistency for manufacturers pursuing CE marking. Standardization efforts relevant to counting and viability workflows are also maturing, including ISO 8934-1:2026 (published May 2026) on general requirements for biotechnology cell viability analytical methods, which supports more consistent validation and comparability for cell-therapy and bioprocess QC use cases.
Value Chain Analysis
The value chain spans precision component supply (optics, detectors, high-resolution CMOS sensors, microfluidic assemblies), instrument design and manufacturing (flow cytometers, hematology analyzers, image-based and impedance counters, and lab-on-chip platforms), and a high-margin consumables layer (media, sera, reagents, assay kits, and single-use sensors) that drives recurring revenue through installed-base utilization. Software and informatics are increasingly embedded across steps, connecting acquisition, AI-assisted image analysis, and audit-ready data management for regulated labs and GMP environments.
Key friction points concentrate upstream and in qualification. High-resolution CMOS sensors and specialty optical components can drive 8 to 16 week lead times for mid-range analyzers, while proprietary reagent production is often centralized to only a few global sites, creating continuity risk for routine workflows. Regulatory and quality requirements such as ISO 15189 for clinical labs, EU IVDR expectations, and FDA QSR/Part 820 extend product qualification timelines by roughly 12 to 18 months. Distribution commonly relies on regional hubs (notably the Netherlands, Singapore, and the United States) with climate-controlled logistics for reagents, adding cost and complexity. Against this backdrop, manufacturers emphasize dual-sourcing of critical sub-assemblies and bundled hardware-reagent-software offerings to stabilize supply, protect margins, and simplify procurement for end users.
Competitive Landscape
The cell counting market remains moderately fragmented, with the top five suppliers well short of an 80% aggregate share. Danaher (Beckman Coulter), Thermo Fisher Scientific, and BD dominate multiparametric flow cytometry, leveraging global service networks and broad reagent catalogs. Sartorius Stedim and Corning focus on single-use bioprocess monitoring, while NanoEntek and Logos Biosystems carve niches in compact, image-based counters. Competitive differentiation centers on workflow integration; suppliers pair hardware with informatics platforms so users can archive raw FCS files, AI-generated morphometric features, and batch metadata in a single cloud environment.
Strategic collaboration intensity is rising. BD’s link with Biosero embeds robotic arms that load tubes, run washes, and start acquisitions without human intervention, shrinking shift-labor costs[1]. Siemens Healthineers and Scopio Labs deliver digital morphology modules that cut smear-review times by 60%, proving the value of high-resolution, full-field imaging[2]. Meanwhile, start-ups commercialize smartphone-based microfluidic chips that fit humanitarian budgets, nudging incumbents toward tiered pricing strategies.
Regulatory harmonization exerts further pressure. The FDA and NIST jointly drafted standards for cell therapy counting, covering linearity, precision, and reference materials[3]. Vendors able to validate against these benchmarks win early adopter confidence. M&A activity is therefore likely as established firms acquire agile AI or microfluidic innovators to fast-track compliance. Overall, the cell counting market rewards those combining instrument breadth, reagent continuity, and software orchestration into cohesive, scalable solutions.
Cell Counting Industry Leaders
-
Thermo Fisher Scientific
-
Becton, Dickinson and Company
-
Bio-Rad Laboratories
-
Merck KGaA
-
Danaher Corporation (Beckman Coulter, Inc.)
- *Disclaimer: Major Players sorted in no particular order
Cell Counting Market Companies Covered in this Report
- Danaher
- Thermo Fisher Scientific
- Becton Dickinson & Co.
- Sysmex Corp.
- Merck KGaA (MilliporeSigma)
- Agilent Technologies (Nexcelom)
- Bio-Rad Laboratories
- Siemens Healthineers
- Roche
- PerkinElmer
- GE Healthcare
- Tecan Group
- DeNovix
- Chemometec A/S
- Logos Biosystems
- Countstar (Shanghai Ruiyu)
- Orflo Technologies
- Luminex (DiaSorin)
- Abbott Laboratories
- HORIBA Medical
- Mindray Bio-medical
Market Opportunities and Future Outlook
Workflow integration around automation and closed-system manufacturing is expanding the addressable opportunity for cell counting beyond standalone instruments into end-to-end, auditable production and QC environments. A visible 2026 proof point is the ChemoMetec and Tecan integration (May 2026), linking the XcytoMatic 30 cell analyzer with the Fluent Automation Workstation and aligning cell counting with liquid-handling automation and data-driven process control for higher throughput and reduced operator variability in bioprocess and cell-therapy workflows. This direction also amplifies the role of software, connectivity, and services as buyers look for validated, interoperable systems that reduce manual handoffs and support compliance.
AI-driven counting and label-free quantification are creating whitespace in reproducibility and operator independence, especially for image-based cytometry and advanced bioprocess monitoring. In 2026, Agilent released an AI-driven analysis module for the xCELLigence RTCA eSight platform to automate cell segmentation and reduce manual parameter tuning. CellVoyant launched FateView cell detection (April 2026) as a label-free approach using predictive analytics for identification and quantification. Alongside these commercial moves, research outputs such as CountXplain (May 2026) highlight growing attention to interpretability in deep-learning-based cell counting, which aligns with clinical and GMP buyers that require transparent validation and cross-lab comparability rather than black-box outputs.
Recent Industry Developments in Cell Counting Market
- July 2026: NanoEntek launched the EVE-HT A26, a fully automated high-throughput cell counter positioned for CDMO workflows. The product focus on automation and throughput directly targets capacity constraints in cell-therapy and biologics manufacturing lines, where consistent viable counts are tied to dosing and release decisions.
- May 2026: Thermo Fisher Scientific introduced the Gibco CTS DynaXS Single Use Bioreactor as part of an integrated platform approach for scalable cell therapy manufacturing. By emphasizing single-use expansion in a closed workflow, the launch reinforces demand for in-process cell counting and viable cell density monitoring that can be documented for GMP operations.
- December 2025: BD announced global commercial release of new BD FACSDiscover A8 Cell Analyzer configurations featuring spectral flow cytometry with real-time cell imaging. Adding imaging to spectral analysis increases content per run and supports higher-parameter workflows, strengthening the shift toward richer single-cell characterization alongside routine counting.
Cell Counting Market Report Scope and Research Methodology
Market Definition and Coverage
For this study, the cell counting market is defined as revenue earned from instruments and related consumables used to measure cell concentration and viability (live or dead) in lab workflows across research and clinical settings.
Scope exclusions: We exclude metabolic viability readers that only infer counts from ATP or resazurin chemistry and do not perform cell counting.
Segments Covered in This Report
- By Product Type
- Instruments
- Spectrophotometers
- Flow Cytometers
- Hematology Analyzers
- Automated Cell Counters
- Image-based Cell Counters
- Impedance Cell Counters
- Microfluidic Chip Counters
- Consumables
- Media, Sera & Reagents
- Assay Kits
- Others
- Instruments
- By Application
- Research
- Cancer Research
- Stem-Cell & Regenerative Medicine
- Immunology & Infectious-Disease
- Drug Discovery & Toxicology
- Clinical & Diagnostic
- Hematology Diagnostics
- Point-of-Care Testing
- Industrial & Bioprocess
- Biopharmaceutical Manufacturing
- Food & Beverage Quality-Control
- Environmental Monitoring
- Research
- By End User
- Hospitals & Clinical Labs
- Research & Academic Institutes
- Pharmaceutical & Biotech Companies
- CROs & CMOs
- Other Industrial Labs
- By Technology
- Flow Cytometry
- Image-Based Cytometry
- Spectrophotometry
- Impedance (Coulter Principle)
- Microfluidics & Lab-on-Chip
- Geography
- North America
- United States
- Canada
- Mexico
- Europe
- Germany
- United Kingdom
- France
- Italy
- Spain
- Rest of Europe
- Asia-Pacific
- China
- Japan
- India
- South Korea
- Australia
- Rest of Asia-Pacific
- Middle East and Africa
- GCC
- South Africa
- Rest of Middle East and Africa
- South America
- Brazil
- Argentina
- Rest of South America
- North America
Data Sources, Market Sizing, and Validation
Desk Research
Desk work started by fixing a clear product boundary around cell counting tools, and then mapping how demand shows up in real lab and bioprocessing settings. We relied on public sources such as NIH and FDA publications, CDC laboratory guidance where relevant, OECD health and R&D indicators, World Bank macro series, and USPTO patent filings to understand activity levels, adoption direction, and technology shifts.
To translate these inputs into sizing variables, we used annual reports, investor decks, product catalogs, and credible press coverage to track instrument categories, typical purchase cycles, and consumables attachment behavior. When helpful, we also used paid subscriptions for company financials and news screening, a patent database for innovation signals, and an import and export shipment-level database for directional checks on instruments moving across borders. These examples are not exhaustive, and many other public references were reviewed to collect, validate, and clarify data points during the work.
Primary Interviews and Surveys
Primary work focused on speaking with lab managers, procurement teams, distributors, and product specialists across major regions, so we could pressure-test volumes, pricing movements, and the split between manual and automated workflows. We also used these conversations to confirm which use cases drive repeat consumables demand, and to sanity-check whether unusual year-to-year changes were real or caused by reporting noise.
Distribution of primary research fieldwork respondents
| Company type | Respondent position | Region |
|---|---|---|
| Top tier: 39% | CXOs: 14% | APAC: 41% |
| Mid tier: 40% | Functional/Unit leaders: 29% | EMEA: 35% |
| Smaller Players: 21% | Managers: 57% | Americas: 24% |
Market-Sizing & Forecasting
Sizing was built using a top-down approach where research and clinical demand pools were reconstructed using lab activity signals, installed-base replacement patterns, and the share of workflows that require counting and viability checks. After shaping the total demand, we corroborated it with selective bottom-up approximations, including sampled average selling price times unit volumes for key instrument types, distributor channel checks, and an attachment-rate view for consumables. These supporting checks were then used to adjust totals when gaps appeared.
Key inputs that moved the model included instrument mix across image-based and impedance counting, consumables pull-through per installed instrument, average selling price changes tied to automation features, research funding and bioprocess scale-up intensity, and regional lab infrastructure growth. Forecasts were produced using scenario analysis, with base assumptions on adoption and pricing aligned to expert consensus, then stress-tested for faster automation uptake or slower capital budgets. Where direct volume visibility was limited, we used range-based assumptions and kept them anchored to observable signals such as procurement cycles and published budget priorities.
Data Validation & Update Cycle
Outputs were checked against independent signals, including whether implied instrument demand matched known replacement cycles and whether consumables growth tracked expected usage intensity in active labs. When variances looked too large, we investigated the drivers, then revisited the underlying inputs with follow-up questions as needed before finalizing the numbers.
Reviews are done in steps, first by the analyst building the model and then by a second reviewer checking logic, units, and year-over-year movements. Reports are refreshed annually, with interim updates triggered by material events such as major regulatory changes, sharp currency swings, or clear pricing resets. Before delivery, a final pass is done so clients receive the latest updated view based on the most recent information available.
Mordor Intelligence's Cell Counting Market Sizing Compared With Other Published Estimates
Published market values for cell counting can look far apart because scope is not always consistent, and the base-year and currency conversion timing can also shift results. Differences also come from how studies treat consumables pull-through and whether manual counting workflows are valued in the same way as automated systems.
Some estimates fold in adjacent cell analysis tools or broader viability measurement revenues, while others narrow the view to a smaller set of counters, which naturally changes the total. The spread also reflects assumptions on average selling price progression and how quickly labs shift to automation, where more aggressive scenarios can lift short-term totals. When the model counts dedicated counting instruments and their attached consumables, then cross-checks them with replacement cycles and lab activity indicators, the outcome typically aligns better with repeatable purchasing behavior, which is the modeling choice applied by Mordor Intelligence.
Benchmark comparison
| Source | Market Size | Gaps in Research Methodology |
|---|---|---|
| Mordor Intelligence | USD 12.39 B (2026) | |
| Industry Research Publisher A | USD 9.48 B (2024) | Uses 2024 as the base year and a 2025-2030 window, and the scope wording leans toward cell counting solutions tied to viability and proliferation, which can exclude parts of the broader instrument and consumables basket counted in other scopes. |
| Industry Research Publisher B | USD 11.94 B (2025) | Reports a 2025 value with a longer 2034 horizon, and the definition can vary by how it classifies overlapping cell analysis tools and how it projects consumables attachment and price increases over time. |
Looking across the three figures, most of the gap is explained by base-year selection and what gets counted as part of the cell counting toolchain, especially around adjacent analysis tools and consumables pull-through. By keeping the inputs tied to observable purchase drivers and checking them against practical demand signals, the final number stays transparent and easier to replicate year after year.
Key Questions Answered in the Report
What is the current size of the cell counting market?
The cell counting market size reached USD 12.39 billion in 2026 and is projected to hit USD 17.71 billion by 2031.
Which product segment generates the most revenue?
Consumables lead the market with 54.85% revenue share in 2025, thanks to the constant need for reagents, media, and assay kits.
Which geographic region is growing the fastest?
Asia-Pacific is the fastest-growing region, forecast to expand at a 7.66% CAGR through 2031, driven by large-scale investments in cell and gene therapy manufacturing.
Why are image-based cytometers gaining popularity?
Image-based cytometers combine AI-driven analysis and label-free imaging to reduce operator subjectivity, cut reagent costs, and support real-time monitoring in regenerative-medicine workflows.
What is the main restraint hindering wider adoption of advanced cell counters?
High capital and maintenance costs—spectral flow cytometers can exceed USD 500,000—limit uptake, especially in budget-constrained laboratories and developing markets.
Which end-user group is growing the fastest?
Hospitals and clinical laboratories are the fastest-growing end-user segment, advancing at an 7.88% CAGR as automation initiatives shorten turnaround times and cut labor costs.