
Cell Analysis Instruments Market Size and Share
Market Overview
| Study Period | 2020 - 2031 |
|---|---|
| Market Size (2026) | USD 24.55 Billion |
| Market Size (2031) | USD 34.49 Billion |
| Growth Rate (2026 - 2031) | 7.02 % |
| Fastest Growing Market | Asia Pacific |
| Largest Market | North America |
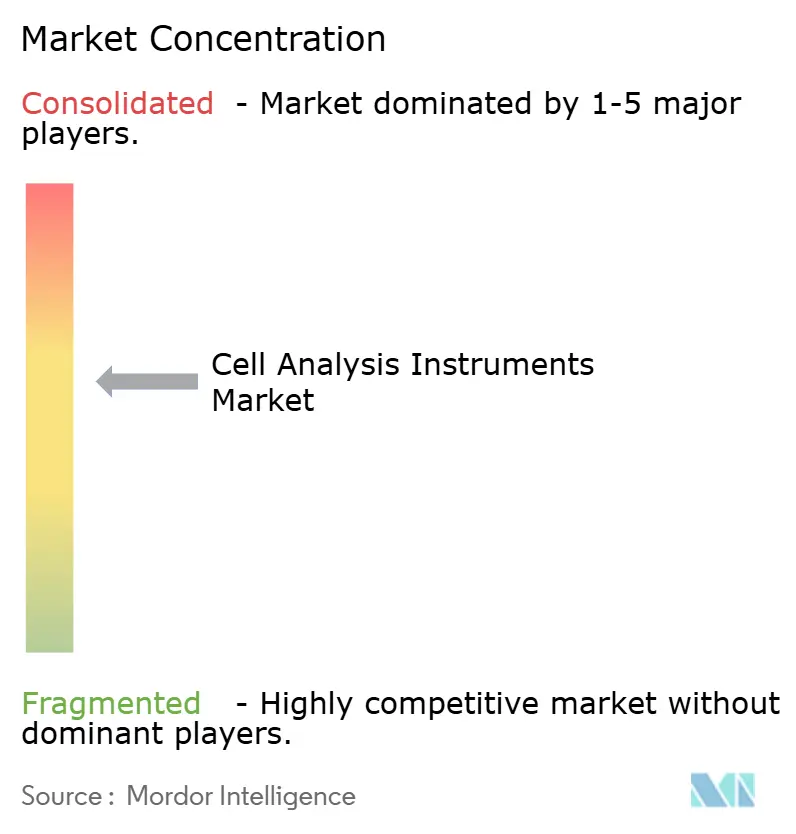
| Market Concentration | Medium |
Major Players *Disclaimer: Major Players sorted in no particular order Image © Mordor Intelligence. Reuse requires attribution under CC BY 4.0. | |
Cell Analysis Instruments Market Analysis by Mordor Intelligence
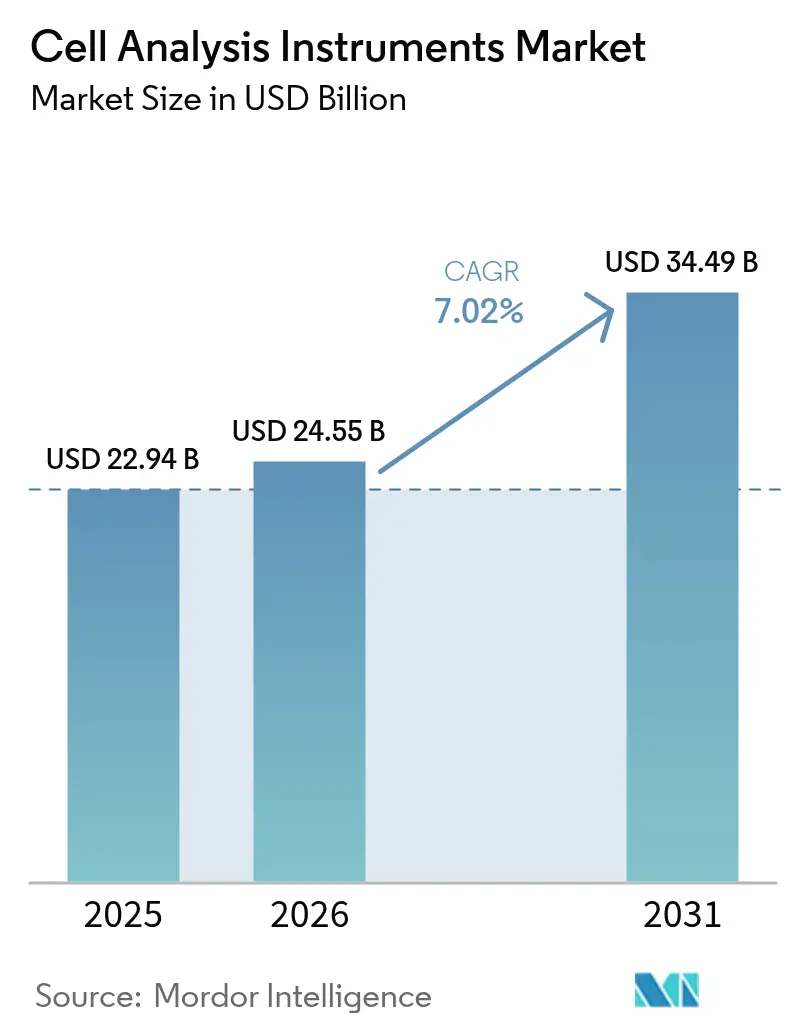
The cell analysis instruments market size is expected to grow from USD 22.94 billion in 2025 to USD 24.55 billion in 2026 and is forecast to reach USD 34.49 billion by 2031 at 7.02% CAGR over 2026-2031. Demand rises as chronic disease management shifts toward early molecular detection, artificial-intelligence (AI) driven imaging, and large-scale single-cell sequencing workflows that are now affordable for mid-sized laboratories. Consumables keep laboratories operational on a daily basis and already account for nearly half of 2024 revenue, while instrument innovation pushes spectral, high-content, and automation features into routine bench work. Geographically, North America continues to set the purchasing pace through generous National Institutes of Health (NIH) and National Science Foundation (NSF) instrumentation grants, whereas Asia-Pacific registers double-digit growth on the back of expanding biomanufacturing capacity. Regulatory clarity is improving; the US Food and Drug Administration (FDA) in 2025 classified multiplexed antimicrobial susceptibility cell-analysis systems as Class II devices, signalling confidence in advanced analytical platforms. Mergers and acquisitions—such as Thermo Fisher Scientific’s multi-year USD 40-50 billion expansion budget—underscore how scale and portfolio breadth will determine long-term competitive advantage.
Key Report Takeaways
- By product category, consumables led with 58.72% revenue share in 2025, whereas instruments are forecast to expand at a 11.94% CAGR to 2031.
- By application, cell counting held 37.96% of the cell analysis instruments market share in 2025, while PCR/qPCR is projected to rise at a 12.54% CAGR through 2031.
- By end user, academic and research institutes captured 45.05% of 2025 revenue, whereas contract research and CDMOs will post the fastest 12.06% CAGR.
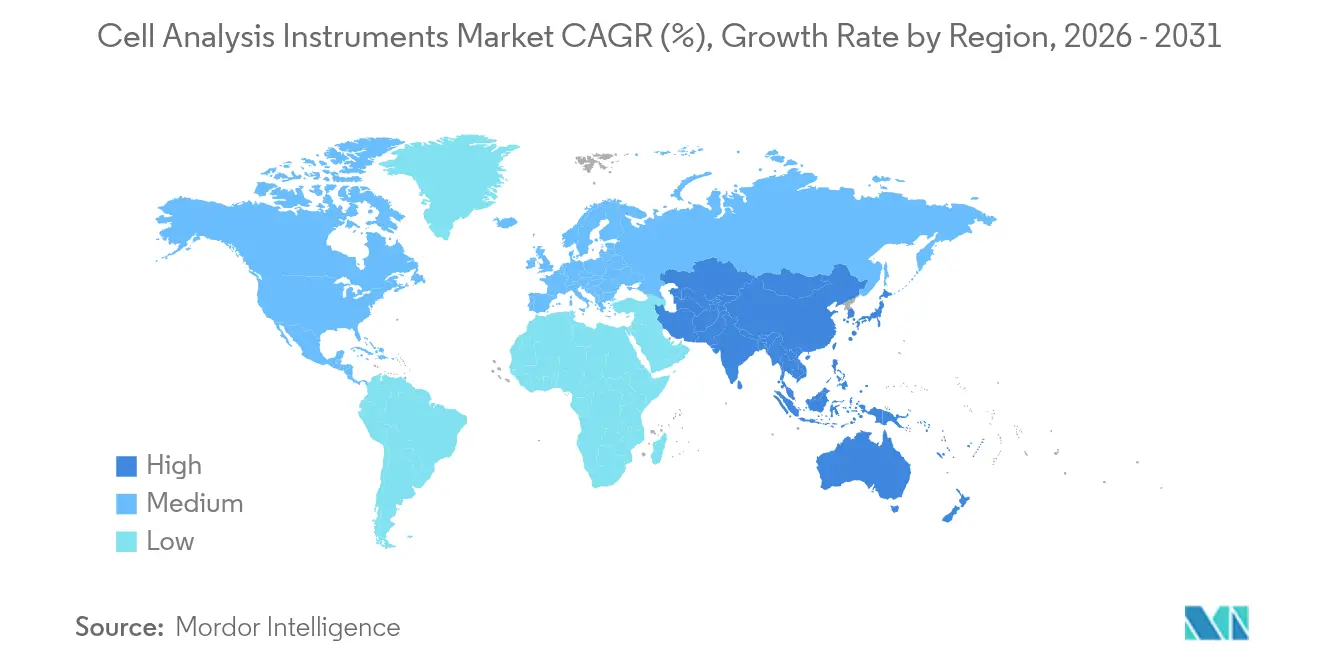
- By geography, North America commanded 40.21% of 2025 revenue; Asia-Pacific is the fastest-growing region at an 11.75% CAGR to 2031.
Note: Market size and forecast figures in this report are generated using Mordor Intelligence’s proprietary estimation framework, updated with the latest available data and insights as of 2026.
Market Trends and Insights
Drivers Impact Analysis of Cell Analysis Instruments Market*
| Driver | (~) % Impact on CAGR Forecast | Geographic Relevance | Impact Timeline |
|---|---|---|---|
| Chronic disease prevalence | +1.2% | Global, concentrated North America & Europe | Long term (≥ 4 years) |
| Biotech & cell-therapy pipeline expansion | +1.8% | North America & EU, expanding to Asia-Pacific | Medium term (2-4 years) |
| Falling single-cell sequencing costs | +1.5% | Global, led by North American research institutions | Short term (≤ 2 years) |
| Government funding for life-science tools | +0.9% | Primarily North America & EU; selective Asia-Pacific programs | Medium term (2-4 years) |
| AI-enabled image analysis | +1.1% | Global, concentrated in advanced research centers | Short term (≤ 2 years) |
| Demand for closed GMP-compliant microfluidics | +0.7% | Global, driven by cell-therapy manufacturing hubs | Long term (≥ 4 years) |
| Source: Mordor Intelligence | |||
Rise in chronic disease prevalence
Growing cancer, cardiovascular, and metabolic disorder caseloads force health systems to prioritise early detection, pushing demand for high-throughput cellular profiling platforms that can uncover subtle phenotypic changes before symptoms manifest. The FDA’s 2024 approval of the Shield blood-based assay—with 83% colorectal cancer detection accuracy—demonstrates how multiparametric cell analysis supports mainstream screening[1]. AI-enhanced histopathology algorithms now outperform manual reads in identifying invasive breast-tumour patterns. Cervical-cancer programmes that must screen 70% of women aged 35-45 by 2030 are adopting automated slide readers to compensate for pathologist shortages. These use cases cement a feedback loop in which clinical adoption validates technology and, in turn, draws further investment into the cell analysis instruments market.
Expansion of biotech and cell-therapy pipelines
More than 1,200 active US cell- and gene-therapy trials in 2024 propel purchases of spectral sorters, high-content imagers, and GMP-grade flow cytometers for in-process control. Roche’s USD 1.0-1.5 billion acquisition of Poseida Therapeutics highlights the rush to secure allogeneic CAR-T platforms that require rigorous cell phenotyping during scale-up. Tenpoint Therapeutics plans first-in-human retinal cell therapy studies by late 2025, widening analytical demand beyond oncology. Contract development and manufacturing organisations (CDMOs) fill capability gaps for smaller biotechs, bolstering instrument sales as they build analytical suites to serve multiple clients. Consequently, the cell analysis instruments market sees growth in both instrument platforms and consumable kits optimised for GMP environments.
Falling single-cell sequencing costs
Sequencing a single human genome once cost USD 100 million; by 2023 that figure dropped to just above USD 500, and further decreases unlock single-cell RNA-seq protocols for standard bench science. Comparative testing shows 10x Genomics’ fixed RNA profiling kit outperforming peers on transcript capture, whereas Becton Dickinson’s Rhapsody kit delivers lower cost per cell[2]. Droplet microfluidics now screens millions of individual cells in hours, reshaping expectations for throughput. As a result, institutions that once outsourced sequencing now buy integrated instruments, expanding the addressable cell analysis instruments market across academic, clinical, and industrial labs.
AI-enabled image analysis boosting throughput
Machine learning automates the extraction of dozens of morphological and fluorescence-based parameters from every cell image. BD’s FACSDiscover A8 analyser collects spectral flow and real-time images on 50-plus markers in one run, thereby collapsing weeks-long manual work into a single day. Nikon’s AX R microscope records six-times faster and four-times wider fields than previous confocal systems, making live-cell dynamics observable in near real time. Synthetic labelling via generative AI promises to replace certain immunofluorescence steps, lowering reagent spend while preserving information content. Collectively, these advances improve per-run economics, further accelerating adoption across the cell analysis instruments market.
Restraints Impact Analysis of Cell Analysis Instruments Market*
| Restraint | (~) % Impact on CAGR Forecast | Geographic Relevance | Impact Timeline |
|---|---|---|---|
| High capital cost of flagship instruments | -0.8% | Global, more acute in emerging markets | Long term (≥ 4 years) |
| Complex multi-jurisdiction regulatory path | -1.2% | Global, centered North America & European Union | Medium term (2-4 years) |
| Bio-informatics talent shortage | -0.9% | Global, acute in specialised research centres | Long term (≥ 4 years) |
| Rare-earth supply chain risk | -0.6% | Global, impacts high-end optics and detectors | Short term (≤ 2 years) |
| Source: Mordor Intelligence | |||
High capital cost of flagship instruments
State-of-the-art spectral flow cytometers, high-content imagers, and mass cytometry platforms often list above USD 500,000, pricing out many teaching hospitals and public universities. NIH attempts to bridge the gap with High-End Instrumentation grants that award USD 750,000-2 million for single items. Yet the number of eligible proposals still far exceeds available funds, evidenced by Bio-Rad’s 5.4% year-over-year decline in academic sales during Q1 2025. Shared-use cores improve utilisation but lengthen queue times, occasionally compromising experimental timelines. Currency swings and import levies amplify costs in developing markets, dampening unit shipments and slowing cell analysis instruments market penetration where unmet medical need is rising fastest.
Complex multi-jurisdiction regulatory path
The FDA’s final rule on laboratory-developed tests mandates a five-stage transition from 2025 through 2029, imposing new pre-market review obligations that will cost laboratories USD 566 million to USD 3.56 billion annually. Europe continues to refine In Vitro Diagnostic Regulation (IVDR) implementation, while Japan and China maintain separate device-registration pathways. Vendors must customise labelling, firmware, and quality-system documentation for every major jurisdiction, stretching regulatory affairs budgets. Smaller innovators often seek strategic alliances or acquisition exits rather than navigate alone, indirectly feeding consolidation within the cell analysis instruments market.
*Our forecasts treat driver/restraint impacts as directional, not additive. The impact forecasts reflect baseline growth, mix effects, and variable interactions.
Cell Analysis Instruments Market Segment Analysis
By Product:
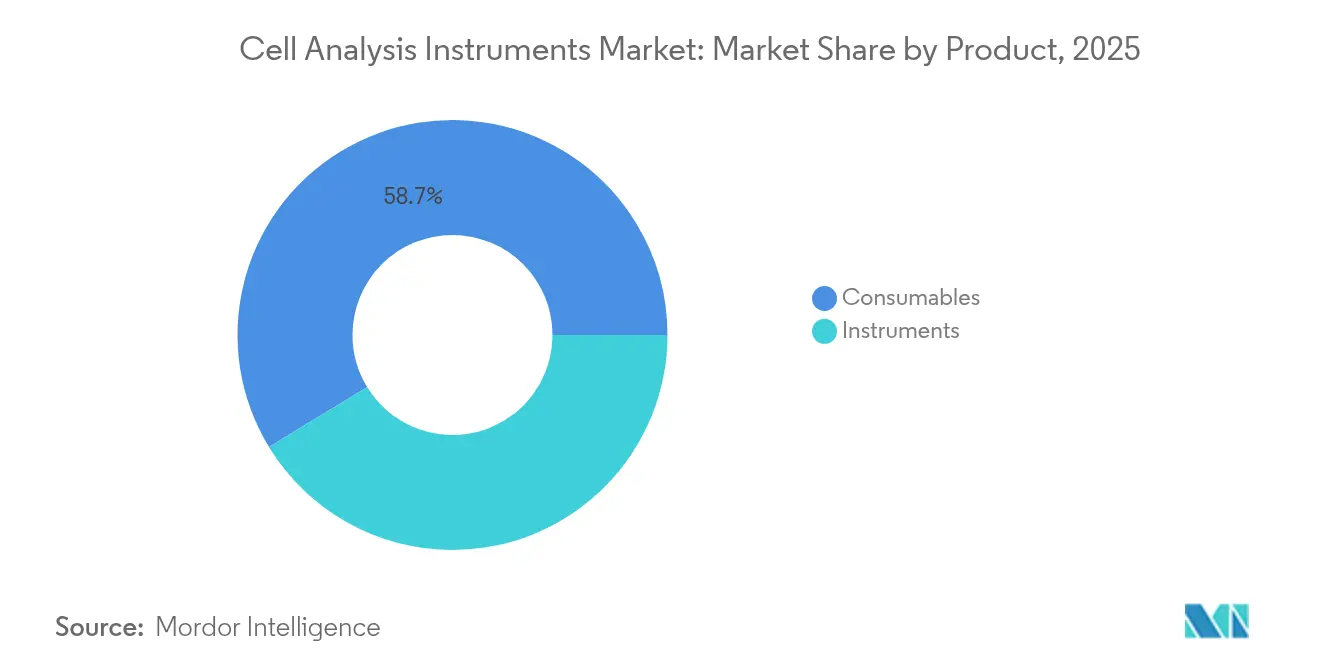
Consumables Sustain Revenue StreamsConsumables generated 58.72% of 2025 revenue and deliver predictable margins because laboratories reorder assay kits, reagents, and disposable cartridges throughout an instrument’s life cycle. Flagship instrument launches nevertheless propel top-line growth; the BD FACSDiscover S8 spectral sorter marries high-speed imaging with traditional fluorescence to enable phenotype-based sorting, a first for the category. Yokogawa’s CellVoyager CQ3000 offers live 3-D imaging of organoids using sCMOS cameras, broadening single-plate analytical capacity. As new optical paths and on-board AI shorten protocols, laboratories replace older hardware earlier than the typical seven-year depreciation curve, supporting a 11.94% CAGR for instruments. Spectrophotometers, microarrays, and advanced microscopes plug into cloud-based analytic dashboards that automate compliance documentation, securing recurring software subscriptions that anchor vendors deeper into the cell analysis instruments market.
Second-order effects further reinforce consumable demand. AI-assisted assays often multiplex more biomarkers per run, increasing reagent pull-through. Spectral flow cytometry requires proprietary dye panels optimised for narrow emission bins, converting technique adoption directly into consumable sales. Collectively, these drivers ensure that consumables remain the volume backbone, while big-ticket hardware remains the swing factor in annual revenue for the cell analysis instruments industry.

By Application:
PCR/qPCR Accelerates Beyond Traditional CountingCell counting still led with a 37.96% slice of 2025 spending, reflecting routine viability checks, dose calculations, and basic QC across research and clinical labs. Yet PCR/qPCR applications are projected to expand at 12.54% annually through 2031 as laboratories migrate toward molecular endpoints. The ClearLLab 10C panel analyses samples at 0.0469 × 10⁶ cells/mL—far below conventional thresholds—underscoring how sensitive reagent mixes unlock low-input workflows for oncology and immune profiling. Coupling cell culture monitoring with real-time polymerase reads collapses days of incubator waiting into hours, increasing experimental throughput.
Target-identification workflows, especially CRISPR screens, now integrate transcriptomic and proteomic readouts, escalating data volume exponentially. This multi-omics convergence elevates informatics requirements and pushes demand for turnkey analysis software that accompanies instrument installs. Drug-screening and biomarker-discovery labs adopt microfluidics to evaluate thousands of conditions in parallel, further enlarging the cell analysis instruments market size for high-throughput platforms.
By End User:
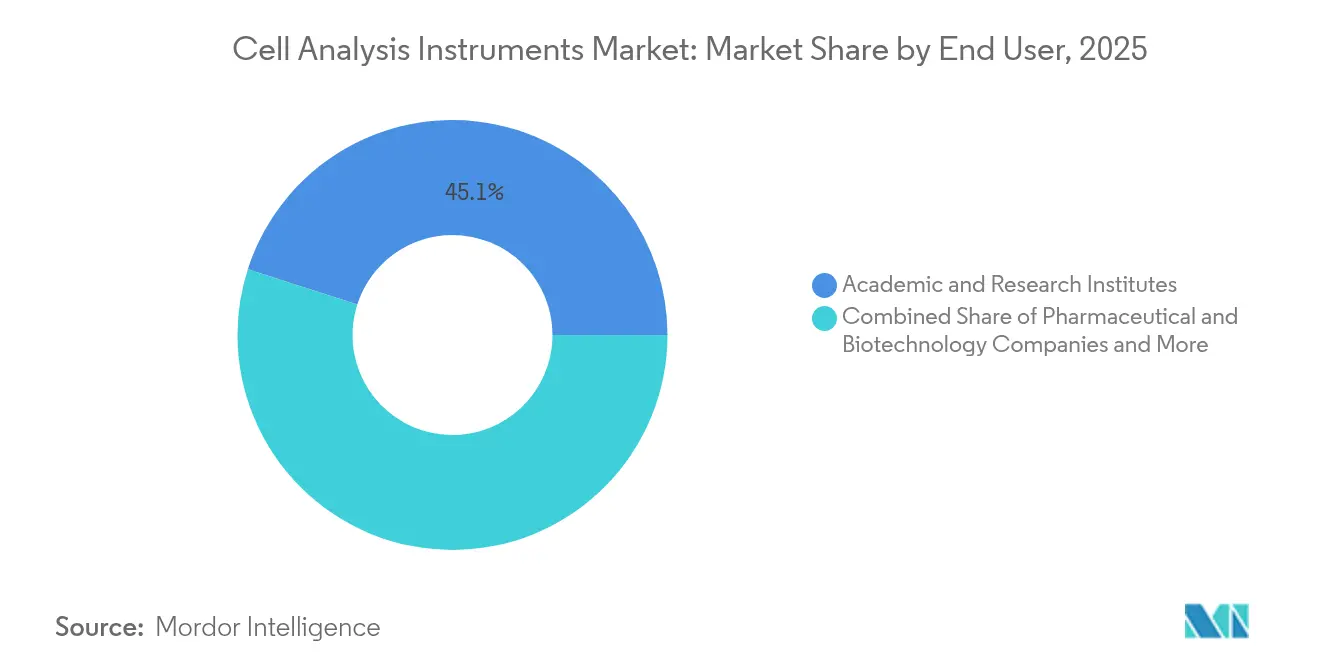
CDMOs Drive Manufacturing TransformationAcademic and research institutions dominated 2025 revenue at 45.05%, buoyed by public funding streams like the NIH S10 programmes and NSF biotechnology allocations. Yet the fastest growth—12.06% CAGR—comes from CDMOs that scale cell-therapy manufacturing for multiple sponsors. These facilities require validated, 21 CFR Part 11-compliant analytics to release GMP batches, stimulating purchases of inline flow cytometers, sterility testers, and automated microscopy. Pharmaceutical and biotech companies remain steady buyers but increasingly outsource late-stage process development, shifting incremental demand toward CDMOs. Clinical laboratories round out the segment mix as FDA clarifies pathways for integrating multiplex cell-analysis systems into routine diagnostic testing, which bolsters confidence to invest in high-end instruments.
Geography Analysis
North America Cell Analysis Instruments Market
North America retains leadership with 40.21% of 2025 revenue, anchored by NIH High-End Instrumentation grants of USD 750,000-2 million per award and USD 421 million in NSF biotechnology budget for fiscal 2025. Robust venture funding, a mature biopharma cluster, and early-adopter culture pushed laboratories to adopt AI-enabled analytical platforms ahead of other regions. Canada’s federal innovation funds and Mexico’s burgeoning contract-manufacturing footprint add to regional demand; Shimadzu’s new Mexican subsidiary aims for 150% business growth by 2028, signalling instrument vendors’ confidence in the market. The current cell analysis instruments market size for North America supports vendors specialising in premium instrumentation, bioprocess analytics, and cloud-connected data services.
APAC Cell Analysis Instruments Market
Asia-Pacific registers the highest growth rate at 11.75% CAGR through 2031. China’s pivot toward Southeast Asian biopharma investments and control of 90% global rare-earth output influences supply security for optical components. India’s ambition to become a Quad biomanufacturing hub positions the region for demand in closed, GMP-compliant analytical suites. Japan’s Nikon and Yokogawa supply cutting-edge imagers that feed back into domestic adoption, while South Korea invests heavily in precision-medicine infrastructure. Consequently, the cell analysis instruments market enjoys both manufacturing cost advantages and large untapped clinical segments across Asia’s diverse economies.
EMEA Cell Analysis Instruments Market
Europe maintains a solid installed base thanks to clustered pharma activity in Germany, the United Kingdom, and France. Coordinated research funding, combined with IVDR roll-out, ensures a stable if moderate demand trajectory. Eastern European nations look to EU structural funds to modernise laboratory infrastructure, creating future unit-growth pockets. Meanwhile, the Middle East and Africa begin to modernise pathology labs and life-science education facilities, often bundled with technology-transfer agreements. These regions contribute a small but rising share of the global cell analysis instruments market as governments diversify away from hydrocarbon-driven economies.
Regulatory Landscape
Cell analysis instruments that support clinical decision-making or in vitro diagnostics fall under medical-device controls in major markets, shaping design controls, validation, and post-market obligations for manufacturers. In the United States, many immunology and microbiology cell-analysis systems are regulated under FDA oversight as Class II devices, and FDA clarified this category through a 2025 final classification action for cellular analysis systems within immunology and microbiology devices. Separately, FDA began a staged transition for laboratory-developed tests from 2025 through 2029, increasing the number of workflows that require formal premarket review pathways when cell analysis platforms are used in diagnostic settings.
In Europe, cell analysis instrumentation used for IVD claims must align with the In Vitro Diagnostic Medical Devices Regulation (IVDR 2017/746) and the Notified Body conformity assessment model. In May 2026, the European Commission advanced implementation infrastructure by mandating use of the first four EUDAMED modules (Actors, UDI/Devices, Notified Bodies/Certificates, and Market Surveillance), which increases traceability expectations for manufacturers and importers. Also in May 2026, Implementing Regulation (EU) 2026/977 standardized quality management and procedural requirements for Notified Bodies under MDR and IVDR, and the June 2026 update to harmonised standards further tightened the documentation baseline used for conformity assessment across the EU.
Competitive Landscape
Market structure tilts toward moderate concentration as leading players use acquisitions to broaden technology stacks. Danaher generated USD 24 billion across biotechnology, life-science, and diagnostics units in 2023 while investing USD 1.5 billion in R&D, demonstrating the fiscal firepower needed to sustain innovation cycles. Roche, Agilent, and Bruker augment internal pipelines with targeted buys that extend into spatial, proteomic, or environmental analytics, creating interlocking ecosystems of instruments, reagents, and software.
Technology differentiation now centres on AI, spectral analysis, and single-cell depth. BD’s spectral sorter and analyser launches combine real-time imaging with cytometry to offer phenotypic gating previously impossible on traditional sorters. Nikon introduces super-resolution confocal systems packaged with neural-network image-reconstruction tools, recasting microscopy as a data science problem. Vendors with proprietary chemistries—fluorochromes, antibody panels, and microfluidic cartridges—lock-in recurring consumables revenue, raising switching costs for end users and deepening vendor relationships in the cell analysis instruments market.
Still, white-space remains. Mid-tier firms exploit gaps for cost-effective single-cell proteomics or microfluidic-based drug-screening platforms. Supply-chain dependency on rare-earth magnets and specialised lasers incentivises near-shoring strategies, with US rare-earth output reaching 45,000 tons valued at USD 260 million in 2024[3]. Start-ups offering AI-native software suites for multi-omics data integration attract venture funding, frequently partnering with instrument majors for distribution. As consolidation proceeds, competitive intensity will continue to hinge on the ability to deliver complete, compliant, and cost-efficient workflows.
Cell Analysis Instruments Industry Leaders
-
Becton Dickinson and Company
-
Sartorius AG
-
Merck KGaA
-
Thermo Fisher Scientific
-
Danaher Corp. (Beckman Coulter Life Sciences)
- *Disclaimer: Major Players sorted in no particular order
Cell Analysis Instruments Market Companies Covered in this Report
- Beckton Dickinson
- Danaher Corp. (Beckman Coulter Life Sciences)
- Thermo Fisher Scientific
- Merck
- Sartorius
- Miltenyi Biotec
- Agilent Technologies
- Bio-Rad Laboratories
- GE Healthcar
- PerkinElmer (Revvity)
- 10x Genomics
- Luminex (DiaSorin)
- Olympus
- Sysmex
- Promega
- Terumo
- Stem Cell Technologies
- Chemometec A/S
- Countstar (Ruiyu Biotech)
Market Opportunities and Future Outlook
Software-led upgrades and automation are creating identifiable whitespace in routine cell analysis workflows, particularly in image interpretation and flow cytometry sample preparation. In July 2026, Agilent launched an AI-driven analysis module for its xCELLigence RTCA eSight platform to reduce manual cell segmentation and parameter tuning in label-free imaging, reinforcing the shift toward software-defined performance improvements that can be applied across installed bases. In June 2026, Curiox expanded automation on its Pluto Workstation with guided workflow tools for end-to-end flow cytometry sample preparation, supporting integrated prep-to-acquisition systems that standardize upstream variability and increase throughput for multi-site labs and CDMOs.
Regulatory and quality-system digitization is also increasing demand for compliance-ready, connected instruments and supporting documentation toolchains. The EU made the first four EUDAMED modules mandatory in May 2026 for IVDR-compliant devices, and the IVDR harmonised standards list was amended with effect from June 17, 2026 (Decision (EU) 2026/1313), raising the premium on manufacturers that can provide UDI-ready device master records, surveillance reporting, and standardized technical documentation. In the United States, FDA alignment of the Quality Management System Regulation with ISO 13485:2016 in 2026 supports investment in audit-ready instrument software, cybersecurity, and traceable performance verification, favoring vendors that bundle instruments with validated analytics and integration into quality systems.
Recent Industry Developments in Cell Analysis Instruments Market
- July 2026: Merck KGaA signed a five-year agreement with Curiosis to supply cell imaging automation products based on the Celloger Mini Plus platform for worldwide distribution under the Merck brand. The deal expands Merck's reach in routine cell imaging and analysis by adding a branded automation offering without a full in-house instrument build. It also raises competitive pressure on incumbents that rely on imaging systems for recurring consumables and software pull-through.
- June 2026: Merck KGaA announced an agreement to acquire Bio-Techne for approximately USD 11.3 billion, adding ProteinSimple automated protein detection and analysis capabilities alongside Bio-Techne's life-science portfolio. The combination broadens Merck's position across adjacent analytical workflows that increasingly sit next to cell analysis in bioprocess and translational labs. It reinforces the consolidation trend toward end-to-end instrument, reagent, and software ecosystems.
- April 2024: Becton, Dickinson and Company launched the BD FACSDiscover S8 cell sorters featuring BD CellView Image Technology and BD SpectralFX Technology. The product positioned image-enabled spectral sorting as a more accessible workflow for phenotype-driven sorting beyond traditional fluorescence-only gating. Expanded availability of such integrated platforms supports faster adoption of multi-parameter cell profiling in shared cores and mid-sized laboratories.
Cell Analysis Instruments Market Report Scope and Research Methodology
Market Definition and Coverage
For this study, the cell analysis instruments market is defined as the revenue generated from tools and related consumables used to count, identify, characterize, and assess cell function in research and applied lab workflows.
Scope exclusions: We exclude standalone lab services and consulting, and we also exclude pure software-only tools that are sold without an instrument-linked workflow.
Segments Covered in This Report
- By Product
- Instruments
- Microscopes
- Flow Cytometers
- Spectrophotometers
- Cell Microarrays
- Other Instruments
- Consumables
- Instruments
- By Application
- Cell Counting
- Cell Viability
- Cell Identification
- Target Identification
- PCR / qPCR
- Other Applications
- By End-User
- Academic & Research Institutes
- Pharmaceutical & Biotechnology Companies
- Contract Research & CDMO
- Other End-Users
- Geography
- North America
- United States
- Canada
- Mexico
- Europe
- Germany
- United Kingdom
- France
- Italy
- Spain
- Rest of Europe
- Asia-Pacific
- China
- Japan
- India
- South Korea
- Australia
- Rest of Asia-Pacific
- Middle East and Africa
- GCC
- South Africa
- Rest of Middle East and Africa
- South America
- Brazil
- Argentina
- Rest of South America
- North America
Data Sources, Market Sizing, and Validation
Desk Research
Desk research was used to establish the factual base and keep the model tied to measurable demand signals. We referenced public sources such as US FDA device databases, CDC and NIH publications for research activity signals, OECD and World Bank macro indicators, and UN Comtrade for trade direction checks on lab instrument categories.
We then reviewed company annual reports, investor presentations, press releases, and relevant association pages to understand product positioning and typical purchasing patterns across labs. Where needed, licensed datasets were used for company financials and intelligence, news and financials, and patents to support product mapping and to avoid double counting across overlapping instrument classes. This list is indicative rather than exhaustive, and many additional sources were used to collect, cross-check, and clarify inputs.
Primary Interviews and Surveys
Primary work focused on confirming what gets bought, how lab systems are replaced, and how budgets shift between instruments and consumables across end users. We spoke with a mix of instrument suppliers, distributors, lab managers, and procurement-aligned roles across APAC, EMEA, and the Americas. Their input helped tighten ASP bands, adoption timing, and utilization assumptions used in the sizing model.
Distribution of primary research fieldwork respondents
| Company type | Respondent position | Region |
|---|---|---|
| Top tier: 29% | CXOs: 13% | APAC: 47% |
| Mid tier: 54% | Functional/Unit leaders: 28% | EMEA: 31% |
| Smaller Players: 17% | Managers: 59% | Americas: 22% |
Market-Sizing & Forecasting
Sizing was built using a top-down approach where lab research intensity and installed-base expansion are translated into instrument demand, and then scaled using realistic replacement cycles and average selling price ranges. The totals were cross-checked with selective bottom-up approximations, including sampled supplier revenue splits by product line, distributor channel checks, and ASP x unit logic for a few high-penetration instrument categories.
Key inputs used in the model included direction in life sciences R&D spending, funded research activity signals, instrument replacement timing in core labs, mix shifts between high-throughput systems and routine analyzers, and the consumables-to-instruments attach rate that follows utilization. Where local data was thin, gaps were handled by using regional proxy ratios that were validated in interviews and then stress-tested against trade patterns and funding direction.
For forecasting, scenario analysis was used around adoption pace and budget tightening versus expansion, and then a simple regression-style check was applied between demand and leading indicators that primary respondents repeatedly highlighted. Assumptions were kept transparent so the steps can be repeated when new public signals or interview updates come in.
Data Validation & Update Cycle
Model outputs were validated through multiple checks, starting with math and unit sanity tests, followed by comparisons against independent signals such as funding direction, import patterns, and reported business line growth statements. When a variance looked unusual, we revisited the underlying driver, and if needed, we re-contacted experts to confirm whether the change was real or a modeling artifact.
Before sign-off, the work goes through a multi-step internal review where assumptions, conversions, and growth drivers are challenged and adjusted with clear notes. Reports are refreshed on an annual cycle, and interim updates are made when material events occur that can shift demand or pricing. Right before delivery, a final review pass is completed so clients receive the most current view available at that time.
Mordor Intelligence's Cell Analysis Instruments Market Size Compared With Other Published Estimates
It is normal to see different market values published for cell analysis instruments because scope and year anchors are not always aligned, and pricing and attach-rate assumptions can be treated differently. The table makes the spread visible, and it helps explain why one figure may look higher or lower even when the topic sounds the same.
The benchmark table shows a 2026 starting value of USD 24.55 B, and in Mordor Intelligence's model the market is counted as instruments plus consumables tied to cell analysis workflows, which avoids inflating the total with broader cell analysis platforms or software-only revenue. Differences also come from whether a publisher anchors on 2025 versus 2026, how they move ASPs over time, and whether their forecast path reflects a base case or a more aggressive adoption curve for single-cell and high-parameter systems.
Benchmark comparison
| Source | Market Size | Gaps in Research Methodology |
|---|---|---|
| Mordor Intelligence | USD 24.55 B (2026) | |
| Global Consultancy A | USD 23.31 B (2025) | Anchors the market one year earlier and applies a longer horizon through 2034, which can shift the perceived run-rate when pricing and adoption are compounded from a 2025 base. |
| Trade Publisher B | USD 22.94 B (2025) | Uses a 2025 base and a shorter 2025 to 2030 window, and the public summary does not clarify how consumables attachment and ASP progression are handled across instrument classes. |
Taken together, the comparison indicates that most of the gap is explained by year selection, horizon length, and how tightly the revenue counted is tied to instrument-led workflows. Our approach stays traceable to a defined demand pool and a small set of checkable inputs, which makes updates and client-side replication much more practical.
Key Questions Answered in the Report
What is the projected size of the cell analysis instruments market by 2031?
The market is forecast to reach USD 34.49 billion by 2031, growing at a 7.02% CAGR over 2026-2031 from its USD 22.94 billion valuation in 2025.
Which product segment grows fastest within the cell analysis instruments industry?
Instrumentation platforms—particularly spectral flow cytometers and high-content imagers—are set to advance at a 11.94% CAGR between 2026 and 2031.
Why is Asia-Pacific the fastest-expanding region?
Local biomanufacturing investments, rare-earth supply advantages, and rising healthcare expenditure lift Asia-Pacific demand, yielding an 11.75% CAGR through 2031.
How do AI tools influence adoption?
AI automates image interpretation and multiparameter gating, which cuts analysis time dramatically and justifies upgrades to advanced platforms.
What challenges limit faster uptake?
High capital expenditure, multi-jurisdiction regulatory complexity, shortages of bio-informatics talent, and rare-earth supply risks temper otherwise strong growth drivers.