
Cardamom Market Size and Share
Cardamom Market Analysis by Mordor Intelligence
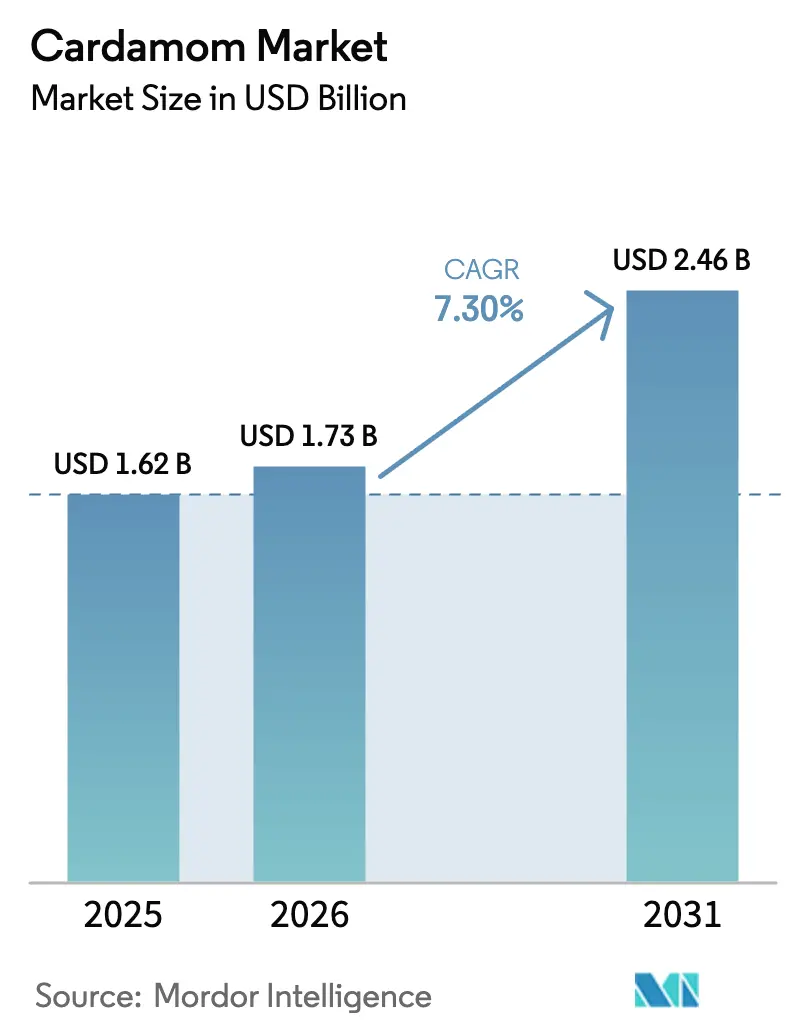
The cardamom market size was valued at USD 1.62 billion in 2025 and estimated to grow from USD 1.73 billion in 2026 to reach USD 2.46 billion by 2031, at a CAGR of 7.30% during the forecast period (2026-2031). Robust demand from functional beverage formulators, premium confectioners, and herbal supplement brands is colliding with erratic harvests in Guatemala and India, a mix that keeps prices volatile and incentivizes traceability-linked premiums. Saudi Arabia’s import prices almost doubled in 2024 as buyers locked in inventory ahead of Ramadan-to-Hajj peaks. Meanwhile, smallholders in Kerala and Karnataka are shifting acreage toward turmeric and ginger, crops that offer higher margins with lower climate exposure. On the opportunity side, blockchain-verified lots are winning price premiums in Europe and North America, signaling that digital provenance is moving from novelty to baseline expectation.
Key Report Takeaways
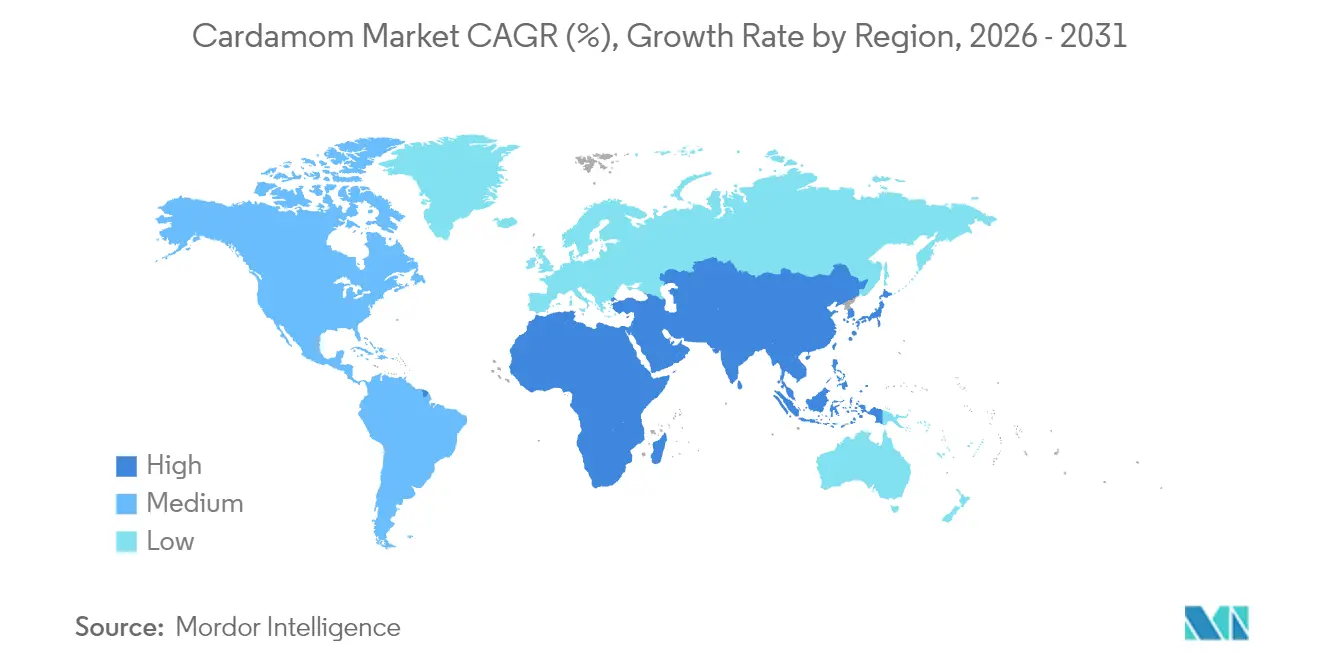
- By geography, the Asia-Pacific region was the largest, capturing 38.3% of the cardamom market share in 2025, while the Middle East is the fastest-growing region, with a 8.3% CAGR forecast through 2031.
Note: Market size and forecast figures in this report are generated using Mordor Intelligence’s proprietary estimation framework, updated with the latest available data and insights as of 2026.
Global Cardamom Market Trends and Insights
Drivers Impact Analysis*
| Driver | (~) % Impact on CAGR Forecast | Geographic Relevance | Impact Timeline |
|---|---|---|---|
| Expanding functional beverage demand | +1.2% | Global, with concentration in North America, Europe, and urban Asia-Pacific | Medium term (2-4 years) |
| Growing Ayurvedic and Traditional Chinese Medicine (TCM) usage | +0.9% | Asia-Pacific core, spill-over to North America and Europe | Long term (≥ 4 years) |
| Premium confectionery and bakery uptake | +0.7% | North America and Europe, and selective urban centers in the Middle East | Medium term (2-4 years) |
| Blockchain-verified single-origin lots | +0.4% | Europe and North America, and early adoption in the Middle East premium segments | Long term (≥ 4 years) |
| European Union Farm to Fork pesticide-cut incentives | +0.5% | Europe, with a supply-side impact in Guatemala and India | Medium term (2-4 years) |
| Carbon-credit income for shade-grown plots | +0.3% | Guatemala, India (Kerala, Karnataka), and Tanzania | Long term (≥ 4 years) |
| Source: Mordor Intelligence | |||
Expanding Functional Beverage Demand
Ready-to-drink chai, energy drinks, and wellness tonics are increasingly specifying natural cardamom oil instead of synthetic terpenes. This shift has tightened the supply of food-grade cardamom pods, driving up farm-gate prices. In 2024, AVEC Drinks, a producer of all-natural sparkling beverages and mixers, partnered with Yes! Apples to launch a limited-edition apple sparkling drink, Fuji Apple and Cardamom. These clean-label claims necessitate batch-level certificates of analysis, benefiting vertically integrated exporters with on-farm drying and grading capabilities. Brand owners are securing supply through long-term agreements to ensure residue-free quality, as flavor consistency remains essential for high-volume beverage production. Additionally, the growing focus on sustainability and traceability in the supply chain continues to strengthen the preference for natural cardamom oil.
Growing Ayurvedic and Traditional Medicine Systems (TCM) Usage
Herbal medicine integrators are scaling imports for capsule fillings and loose-leaf blends anchored in digestive and respiratory benefits. McCormick’s six-state sustainability project in India includes Good Agricultural Practices training to ensure a residue-compliant supply for supplement brands. Rising compliance costs are offset by price premiums tied to organic and fair-trade labels. Hospitals in India and wellness clinics across Southeast Asia are incorporating evidence-based traditional preparations into preventive care packages, creating stable institutional demand channels. A 2024 review published in Biomolecules analyzed the bioactive compounds in cardamom, identifying 1,8-cineole and alpha-terpinyl acetate as exhibiting notable antioxidant, anti-inflammatory, and chemopreventive properties in preclinical studies.
Premium Confectionery and Bakery Uptake
Artisanal chocolate makers and pastry chefs are incorporating single-origin cardamom into limited-edition products, which are priced significantly higher than standard commodity offerings. Specialty bakeries, including those focusing on gluten-free products, leverage cardamom’s natural sweetness to reduce added sugars, thereby expanding its appeal. Consumers are willing to pay premium prices for desserts that emphasize authentic flavor profiles and ethical sourcing practices. Direct sourcing enables manufacturers to bypass commodity brokers, ensuring that smallholder farmers receive a greater share of the value chain. Given the high demand for cardamom as a spice in India, the Spices Board under the Ministry of Commerce and Industry has introduced a new initiative for 2024. This scheme aims to enhance spice exports, promote value-added spice products, improve cardamom productivity, and upgrade the post-harvest quality of spices across India.
Europe Union Farm to Fork Pesticide-Cut Incentives
The European Commission’s goal of a 50% reduction in pesticide use by 2030 is creating a two-tiered import market. Pods with low-residue profiles clear customs smoothly and fetch higher prices, while conventionally grown lots face testing delays and rejections[1]Source: European Commission, “Farm to Fork Strategy,” ec.europa.eu. Guatemalan exporters are investing in integrated pest management training to ensure continued market access. These compliance requirements are driving supply base consolidation, as smallholders lacking the resources for certification are either joining cooperatives or ceasing cardamom cultivation. In India, the Spices Board is promoting the adoption of Good Agricultural Practices and conducting pesticide-residue testing at auction centers to align domestic production with export standards. While these measures are enhancing quality benchmarks, they are also increasing production costs for farmers. This shift is driving the market by incentivizing producers to adopt sustainable practices, thereby creating a competitive advantage for compliant exporters and fostering long-term growth opportunities.
Restraints Impact Analysis*
| Restraint | (~) % Impact on CAGR Forecast | Geographic Relevance | Impact Timeline |
|---|---|---|---|
| Climate-induced yield volatility | -1.8% | Global, acute in India (Kerala, Karnataka) and Guatemala (Alta Verapaz) | Short term (≤ 2 years) |
| Synthetic flavor substitutes | -0.9% | North America and Europe, with spillover to the Asia-Pacific food manufacturing | Medium term (2-4 years) |
| Escalating traceability audit fees | -0.4% | Global, disproportionate impact on smallholders in India, Guatemala, and Tanzania | Medium term (2-4 years) |
| Farmer crop switching to turmeric and ginger | -0.6% | India (Kerala, Karnataka), Indonesia, and, Nepal | Short term (≤ 2 years) |
| Source: Mordor Intelligence | |||
Climate-Induced Yield Volatility
Irregular monsoons in Kerala and hurricanes in Alta Verapaz repeatedly cut yields. Guatemala’s 2025–26 harvest of 16,549 metric tons remains below the long-term average despite a 17% rebound, underscoring structural vulnerability[2]Source: USDA Foreign Agricultural Service, “Spices Annual - Guatemala,” usda.gov. Drying delays lower pod grade and marketable volume, forcing buyers to diversify origin sourcing. Climate volatility is also driving investment in irrigation and climate-tolerant cultivation methods, yet the capital intensity of these adaptations is beyond the reach of most smallholders, who account for 90% of global cardamom production. This underscores the need for targeted financial support and policy interventions to enable smallholders to adopt sustainable practices and mitigate climate risks effectively.
Synthetic Flavor Substitutes
Lab-grown terpenes that mimic cardamom’s aroma now compete on cost, especially in mass-market foods where clean-label claims are secondary. This substitution erodes demand for commodity-grade pods and sharpens the premium for traceable supply. The market is being divided into two segments, a premium segment focused on natural, certified cardamom, and a commodity segment where synthetic alternatives gain market share due to cost advantages and consistency. The market is increasingly segmented into two categories, a premium segment emphasizing natural, certified cardamom, and a commodity segment where synthetic alternatives are gaining market share due to their cost efficiency and consistent quality. This division highlights a shift in consumer preferences and production strategies, with synthetic substitutes appealing to cost-conscious manufacturers while natural cardamom retains its appeal among high-end and health-conscious consumers.
*Our forecasts treat driver/restraint impacts as directional, not additive. The impact forecasts reflect baseline growth, mix effects, and variable interactions.
Geography Analysis
The Asia-Pacific was the largest region, captured 38.3% of the cardamom market share in 2025, driven by region serves as both a major producer and consumer of cardamom. India’s dual role often tightens domestic supply, prompting exports to be redirected to address weather-induced shortages. According to the data released by the Spices Board, during the year 2024-25, the export of small cardamom was 6,727.80 metric tons. Indonesia’s growing middle class is driving demand for cardamom in modern desserts and beverages. Regional free-trade agreements facilitate intra-Asian trade, though inconsistent quality standards remain a challenge to seamless trade. Controlled-environment agriculture initiatives in northern China highlight the potential for production shifts as part of climate adaptation strategies.
Middle East is fastest-growing region, forecasting the 8.3% CAGR through 2031, and the Middle East offers significant growth opportunities for the cardamom market. The Olam Group announced the proposed sale of its remaining 64.57% stake in Olam Agri to SALIC for approximately USD 1.78 billion, in line with Saudi Arabia’s food security objectives[3]Source: Olam Group, “Proposed Sale of Olam Group’s Remaining 64.57% Stake in Olam Agri to SALIC,” olamgroup.com. Gulf Cooperation Council regulations enforce strict quality checks and Halal certification, prompting exporters to enhance post-harvest handling and traceability documentation. This growing demand is likely to boost imports and influence global cardamom prices, creating opportunities for exporters targeting the region.
North America and Europe are characterized by premiumization trends, driving demand for certified organic and fair-trade cardamom pods. Retailers in these regions enforce pesticide-residue limits stricter than global standards, encouraging suppliers to adopt regenerative agricultural practices. Direct-to-consumer platforms provide easier access to specialty products, enabling small estates in India to secure better margins despite low crop yields. While per-capita consumption in these regions is lower than in the Middle East, the emphasis on higher unit prices is driving an increase in overall value share in the cardamom market.


Regulatory Landscape
Cardamom trade is increasingly shaped by food-safety controls and residue compliance in key importing regions. In the European Union, imports must comply with Maximum Residue Levels under Regulation (EC) No 396/2005, and enforcement is reinforced through border controls and the Rapid Alert System for Food and Feed (RASFF). In January 2026, the European Commission adopted Commission Implementing Regulation (EU) 2026/194 amending Regulation 2019/1793 on official controls for certain third-country foods, keeping pressure on exporters to maintain test-ready documentation and consistent lab verification for each lot.
In India, the Spices Board and domestic regulators are tightening formalization and traceability prerequisites for market participation. In December 2025, the Spices Board issued a circular requiring cardamom dealers to maintain a valid FSSAI (Food Safety and Standards Authority of India) License or Registration, linking compliance to legal trading continuity and supply-chain legitimacy. In the EU, ongoing adjustments to pesticide rules also affect cardamom, including a July 2026 Commission Regulation (EU) 2026/1546 that updated MRLs for certain pesticides (including benomyl, carbendazim, and thiophanate-methyl). This raises the operational importance of integrated pest management and routine residue monitoring for exporters targeting premium channels.
Value Chain Analysis
The global cardamom value chain is anchored in smallholder production, followed by aggregation through local traders, primary processing (drying, grading, sorting), and onward movement via exporters to importers, blenders, and downstream food, beverage, and nutraceutical brands. Guatemala and India dominate export supply, while trade flows into the Middle East, Europe, and North America increasingly require auditable chain-of-custody, batch-level testing, and documentation that travels with shipments. Governance and working-capital often sit with traders and exporters that manage logistics, advances to farmers, and the cost of certification and laboratory regimes.
Post-harvest infrastructure and compliance capabilities are the key value capture points. Steam sterilization, pasteurization, and contamination control support access to retail and industrial buyers with strict specifications. Codex Alimentarius standards are increasingly used as trade benchmarks, and in July 2026 the Codex Alimentarius Commission adopted a new international standard for large cardamom, supporting more harmonized grading and quality expectations in cross-border trade. Rising traceability and audit costs are also pushing smaller actors toward cooperatives and integrated exporters, while digital provenance systems and modern auctions (including India-linked e-auction ecosystems) improve price discovery and support contract supply to high-compliance import markets.
Competitive Landscape
The cardamom market comprises various stakeholders, including producers, importers, exporters, and others. Olam International has utilized integrated extension services and digital traceability to enhance its operations. McCormick and Company has invested in Guatemalan agroforestry to secure sustainable supply volumes. In India, domestic bulk purchases, while Royal Spices captured a notable share through its Dubai-based re-export channels. This market structure creates opportunities for vertically integrated entrants that finance on-farm drying and grading processes. These activities help reduce the 12-hour freshness window and allow such entrants to capture margins previously earned by intermediaries.
Technology adoption has emerged as a key differentiator in the cardamom market. Olam’s AtSource platform integrates estate-level data into every shipment, ensuring compliance with the European Union Deforestation Regulation and enabling premium pricing in specialty contracts. The Kerala Cardamom Processing and Marketing Company is transitioning its auctions to a cloud-based, real-time platform to improve price discovery for growers. ITC’s USD 24 million plant in Andhra Pradesh, with an annual capacity of 20,400 metric tons, highlights how export-oriented infrastructure can ensure farm-gate traceability from planting to sterilization. Additionally, Frontier Co-op’s collaboration with FEDECOVERA demonstrates how cooperatives can retain more value at the origin by incorporating on-site steam pasteurization and grinding facilities.
Looking ahead, market consolidation is projected to favor firms capable of managing certification costs, demonstrating origin through blockchain protocols, and maintaining residue-compliant supply chains. Companies unable to document their chain of custody may face exclusion from premium market channels. This trend is likely to gradually reduce the market share held by smaller intermediaries, further tightening the competitive landscape in the cardamom market.
Market Opportunities and Future Outlook
Traceability-driven differentiation is moving from pilot projects to market access requirements, creating room for exporters and processors that can provide lot-level documentation, residue compliance, and identity preservation for single-origin supply. In India, the Spices Board announced an online pooling system for cardamom at auction depots in June 2026, along with mandatory plantation registration for growers in Kerala and Tamil Nadu from June 15 to September 30, 2026, reinforcing the shift toward verified supply linked to formal auction and trading channels. Nepal is also piloting Geo-Environmental Traceability (GIES) for large cardamom using QR-enabled tracking, pointing to demand-side pull for verifiable origin and production attributes.
Compliance capability is a practical lever in premium import markets where residue enforcement is visible. EU MRL compliance remains a key barrier, and residue-related non-compliance for Indian cardamom has been recorded in RASFF over recent years, strengthening incentives for integrated pest management, accredited lab testing, and standardized post-harvest controls. On the demand side, Middle East pull is being met with expanded export activity from India, where whole cardamom exports reached USD 436.8 million and 16,399 tonnes in 2025-26. This supports opportunities for capacity in cleaning, grading, steam treatment, and packaging that align product with GCC quality and Halal documentation needs.
Recent Industry Developments
- July 2026: The Spices Board confirmed a dip in cardamom production in Idukki district, Kerala, citing a rainfall deficit linked to El Nino conditions. The update sharpened near-term supply risk signals for exporters and domestic buyers that rely on auction-linked procurement, reinforcing the role of hedging and multi-origin sourcing strategies.
- July 2025: Multi Commodity Exchange of India (MCX) relaunched cardamom futures contracts starting July 29, 2025, after a multi-year pause, listing near-month contracts to improve price discovery. The restart provided traders and larger growers a more formal tool to manage volatility and strengthened the financial layer of the domestic cardamom trade chain.
- August 2024: The Indian Institute of Spices Research (IISR), Kozhikode, introduced two new small cardamom varieties, IISR Manushree and IISR Kaveri, positioned around improved productivity and disease resistance. The release supported varietal replacement programs and farm-level resilience efforts, which matter for stabilizing quality and volumes that feed export-grade sorting and processing.


Research Methodology Framework and Report Scope
Market Definition and Coverage
For this study, the cardamom market is defined as the traded and consumed value of cardamom as a spice, covering supply moving through domestic and cross-border channels and priced at prevailing wholesale levels in key producing and consuming countries.
Scope exclusions: The sizing excludes retail markups, blends and seasoning mixes where cardamom is not sold as a distinct commodity, and downstream food products where it is only an ingredient.
Segmentation Overview
- By Geography
- North America
- United States
- Production Analysis (Area Harvested, Yield, and Production Volume)
- Consumption Analysis (Consumption Value and Volume)
- Import Market Analysis (Import Value, Volume, and Key Supplying Markets)
- Export Market Analysis (Export Value, Volume, and Key Destination Markets)
- Wholesale Price Trend Analysis and Forecast
- Regulatory Framework
- List of Key Players
- Logistics and Infrastructure
- Seasonality Analysis
- Canada
- Production Analysis (Area Harvested, Yield, and Production Volume)
- Consumption Analysis (Consumption Value and Volume)
- Import Market Analysis (Import Value, Volume, and Key Supplying Markets)
- Export Market Analysis (Export Value, Volume, and Key Destination Markets)
- Wholesale Price Trend Analysis and Forecast
- Regulatory Framework
- List of Key Players
- Logistics and Infrastructure
- Seasonality Analysis
- United States
- Europe
- Germany
- Production Analysis (Area Harvested, Yield, and Production Volume)
- Consumption Analysis (Consumption Value and Volume)
- Import Market Analysis (Import Value, Volume, and Key Supplying Markets)
- Export Market Analysis (Export Value, Volume, and Key Destination Markets)
- Wholesale Price Trend Analysis and Forecast
- Regulatory Framework
- List of Key Players
- Logistics and Infrastructure
- Seasonality Analysis
- United Kingdom
- Production Analysis (Area Harvested, Yield, and Production Volume)
- Consumption Analysis (Consumption Value and Volume)
- Import Market Analysis (Import Value, Volume, and Key Supplying Markets)
- Export Market Analysis (Export Value, Volume, and Key Destination Markets)
- Wholesale Price Trend Analysis and Forecast
- Regulatory Framework
- List of Key Players
- Logistics and Infrastructure
- Seasonality Analysis
- Russia
- Production Analysis (Area Harvested, Yield, and Production Volume)
- Consumption Analysis (Consumption Value and Volume)
- Import Market Analysis (Import Value, Volume, and Key Supplying Markets)
- Export Market Analysis (Export Value, Volume, and Key Destination Markets)
- Wholesale Price Trend Analysis and Forecast
- Regulatory Framework
- List of Key Players
- Logistics and Infrastructure
- Seasonality Analysis
- Germany
- Asia-Pacific
- Indonesia
- Production Analysis (Area Harvested, Yield, and Production Volume)
- Consumption Analysis (Consumption Value and Volume)
- Import Market Analysis (Import Value, Volume, and Key Supplying Markets)
- Export Market Analysis (Export Value, Volume, and Key Destination Markets)
- Wholesale Price Trend Analysis and Forecast
- Regulatory Framework
- List of Key Players
- Logistics and Infrastructure
- Seasonality Analysis
- India
- Production Analysis (Area Harvested, Yield, and Production Volume)
- Consumption Analysis (Consumption Value and Volume)
- Import Market Analysis (Import Value, Volume, and Key Supplying Markets)
- Export Market Analysis (Export Value, Volume, and Key Destination Markets)
- Wholesale Price Trend Analysis and Forecast
- Regulatory Framework
- List of Key Players
- Logistic and Infrastructure
- Seasonality Analysis
- Nepal
- Production Analysis (Area Harvested, Yield, and Production Volume)
- Consumption Analysis (Consumption Value and Volume)
- Import Market Analysis (Import Value, Volume, and Key Supplying Markets)
- Export Market Analysis (Export Value, Volume, and Key Destination Markets)
- Wholesale Price Trend Analysis and Forecast
- Regulatory Framework
- List of Key Players
- Logistics and Infrastructure
- Seasonality Analysis
- Indonesia
- South America
- Brazil
- Production Analysis (Area Harvested, Yield, and Production Volume)
- Consumption Analysis (Consumption Value and Volume)
- Import Market Analysis (Import Value, Volume, and Key Supplying Markets)
- Export Market Analysis (Export Value, Volume, and Key Destination Markets)
- Wholesale Price Trend Analysis and Forecast
- Regulatory Framework
- List of Key Players
- Logistics and Infrastructure
- Seasonality Analysis
- Guatemala
- Production Analysis (Area Harvested, Yield, and Production Volume)
- Consumption Analysis (Consumption Value and Volume)
- Import Market Analysis (Import Value, Volume, and Key Supplying Markets)
- Export Market Analysis (Export Value, Volume, and Key Destination Markets)
- Wholesale Price Trend Analysis and Forecast
- Regulatory Framework
- List of Key Players
- Logistics and Infrastructure
- Seasonality Analysis
- Brazil
- Middle East
- Saudi Arabia
- Production Analysis (Area Harvested, Yield, and Production Volume)
- Consumption Analysis (Consumption Value and Volume)
- Import Market Analysis (Import Value, Volume, and Key Supplying Markets)
- Export Market Analysis (Export Value, Volume, and Key Destination Markets)
- Wholesale Price Trend Analysis and Forecast
- Regulatory Framework
- List of Key Players
- Logistics and Infrastructure
- Seasonality Analysis
- United Arab Emirates
- Production Analysis (Area Harvested, Yield, and Production Volume)
- Consumption Analysis (Consumption Value and Volume)
- Import Market Analysis (Import Value, Volume, and Key Supplying Markets)
- Export Market Analysis (Export Value, Volume, and Key Destination Markets)
- Wholesale Price Trend Analysis and Forecast
- Regulatory Framework
- List of Key Players
- Logistics and Infrastructure
- Seasonality Analysis
- Saudi Arabia
- Africa
- Nigeria
- Production Analysis (Area Harvested, Yield, and Production Volume)
- Consumption Analysis (Consumption Value and Volume)
- Import Market Analysis (Import Value, Volume, and Key Supplying Markets)
- Export Market Analysis (Export Value, Volume, and Key Destination Markets)
- Wholesale Price Trend Analysis and Forecast
- Regulatory Framework
- List of Key Players
- Logistics and Infrastructure
- Seasonality Analysis
- Tanzania
- Production Analysis (Area Harvested, Yield, and Production Volume)
- Consumption Analysis (Consumption Value and Volume)
- Import Market Analysis (Import Value, Volume, and Key Supplying Markets)
- Export Market Analysis (Export Value, Volume, and Key Destination Markets)
- Wholesale Price Trend Analysis and Forecast
- Regulatory Framework
- List of Key Players
- Logistics and Infrastructure
- Seasonality Analysis
- South Africa
- Production Analysis (Area Harvested, Yield, and Production Volume)
- Consumption Analysis (Consumption Value and Volume)
- Import Market Analysis (Import Value, Volume, and Key Supplying Markets)
- Export Market Analysis (Export Value, Volume, and Key Destination Markets)
- Wholesale Price Trend Analysis and Forecast
- Regulatory Framework
- List of Key Players
- Logistics and Infrastructure
- Seasonality Analysis
- Nigeria
- North America
Data Sources, Market Sizing, and Validation
Desk Research
We start by collecting the measurable footprint of the market that can be checked country by country, and then we align it to one consistent definition and currency basis. Public and official sources help anchor the model, such as FAOSTAT for crop output, UN Comtrade and national customs portals for import and export lines, and government agriculture departments for area, yield, and crop calendars.
To keep pricing and flow logic realistic, we also review reference materials such as the International Trade Centre (ITC) trade maps, central bank and IMF series for exchange rates and inflation context, and trade association or auction-bulletin style publications that discuss seasonality and grade-related price spreads. Company annual reports, investor notes, and credible press are used to understand procurement routes and demand drivers. Where needed, paid subscriptions for company financials, shipment-level trade checks, and patent databases are used to validate a few assumptions, not to replace primary validation. The sources named above are illustrative only, and additional public datasets and documents were also consulted for data collection, validation, and clarification.
Primary Interviews and Surveys
Primary work is used to test what desk signals cannot fully explain, especially the split of trade moving through formal versus informal routes, the typical grade mix, and how wholesale prices translate into transacted values across seasons. We spoke with stakeholders across farming-linked supply, traders, processors, exporters, importers, and bulk buyers in food manufacturing and food service, and then we reconciled differences before finalizing the model.
Distribution of primary research fieldwork respondents
| Company type | Respondent position | Region |
|---|---|---|
| Top tier: 27% | CXOs: 14% | APAC: 45% |
| Mid tier: 51% | Functional/Unit leaders: 38% | EMEA: 35% |
| Smaller Players: 22% | Managers: 48% | Americas: 20% |
Market-Sizing & Forecasting
Sizing is built around a top-down reconstruction where production and trade statistics are used to estimate country-level availability and demand, which is then valued using observed wholesale price ranges. Where a single series looks unreliable, the model is stabilized by comparing production trends, net trade position, and consumption signals, so the final totals follow real supply movement.
A few market fingerprints are tracked closely because they move the final value materially, such as harvested area and yield shifts in major origins, exportable surplus after domestic use, grade and size mix (which changes realized prices), seasonal price swings around harvest and stocking, and currency conversion timing for trade values. For cross-checking, we use selective bottom-up approximations, such as sampled price per kilogram multiplied by estimated traded volume through key channels, and channel checks with traders to fill gaps where official data lags or under-reports.
Forecasts are produced using scenario analysis supported by trend smoothing. Drivers like acreage response to price, expected yield normalization, and steady demand pull from beverages and culinary usage are translated into country growth paths. Assumptions are adjusted after expert review when a country faces weather risk, policy changes on exports, or unusual inventory behavior, so the forecast stays practical and explainable.
Data Validation & Update Cycle
Validation is done in layers so one data point does not drive the story. We compare modeled totals with independent signals, including trade balance logic, price movement consistency, and whether growth rates align with known supply cycles. Exceptions are then rechecked back to the source tables or interview notes.
Before sign-off, outputs go through anomaly checks for sudden share changes by region, unrealistic price jumps, and inconsistencies between value and volume trends. When a mismatch is material, follow-up calls are triggered with relevant stakeholders to confirm what changed in the market. Reports are refreshed annually, and interim updates are made when a major event affects harvest, trade policy, or price formation, followed by a final pre-delivery pass so clients receive the latest view.
Mordor Intelligence's Cardamom Market Size Measured Against Other Published Estimates
Published market sizes for cardamom often do not align, even when the topic name looks the same, because the counted value can shift based on pricing level, product boundary, and whether the estimate ties back to measured trade and production flows. Differences also show up when one study uses a different base year or assumes a stronger price path during volatile seasons.
Some estimates include value added beyond the commodity level, such as branded retail packs or blended spice mixes, which lifts the number even if underlying volumes are similar. Other gaps come from using a single average price that does not capture grade mix and origin spreads, or from applying exchange rates inconsistently across importing countries. When cardamom is counted only at wholesale and then cross-checked against production and net trade by country, the totals tend to stay closer to the underlying flow of the commodity, which is how it is treated in Mordor Intelligence.
Benchmark comparison
| Source | Market Size | Gaps in Research Methodology |
|---|---|---|
| Mordor Intelligence | USD 1.73 B (2026) | |
| Industry Association A | USD 1.95 B (2026) | Uses a broader value definition that appears to apply higher post-wholesale pricing and a fuller inclusion of packaged trade, which lifts the value versus a commodity-only view. |
| Trade Journal B | USD 1.48 B (2025) | Anchored to a different base year and a narrower set of reporting countries, with limited adjustment for informal trade and grade-driven price dispersion, which can understate total market value. |
Looking across the table, most of the variance comes from where pricing is taken in the chain and how strictly cardamom is kept as a standalone commodity versus an ingredient in packaged formats. Our checks keep the build consistent across countries so it can be repeated when new harvest, trade, and price signals are released.


Key Questions Answered in the Report
What is the projected value of the global cardamom trade by 2031?
The cardamom market size was valued at USD 1.62 billion in 2025 and estimated to grow from USD 1.73 billion in 2026 to reach USD 2.46 billion by 2031, at a CAGR of 7.30% during the forecast period (2026-2031).
Which geography currently consumes the largest share of cardamom?
Asia-Pacific led global consumption in 2025 with 38.3% of the total value in 2025.
Why are organic certifications gaining traction in cardamom sourcing?
North American and European retailers increasingly demand certified supply, so organic green cardamom attracts price premiums and faster growth.
How is climate risk influencing cardamom supply security?
Erratic monsoons in India and hurricanes in Guatemala reduce yields, raise prices, and push buyers to diversify origins and invest in resilient practices.
Page last updated on:


 Your data is secure and never sold or shared.


