Carbonated Beverages Market Size and Share
Market Overview
| Study Period | 2021 - 2031 |
|---|---|
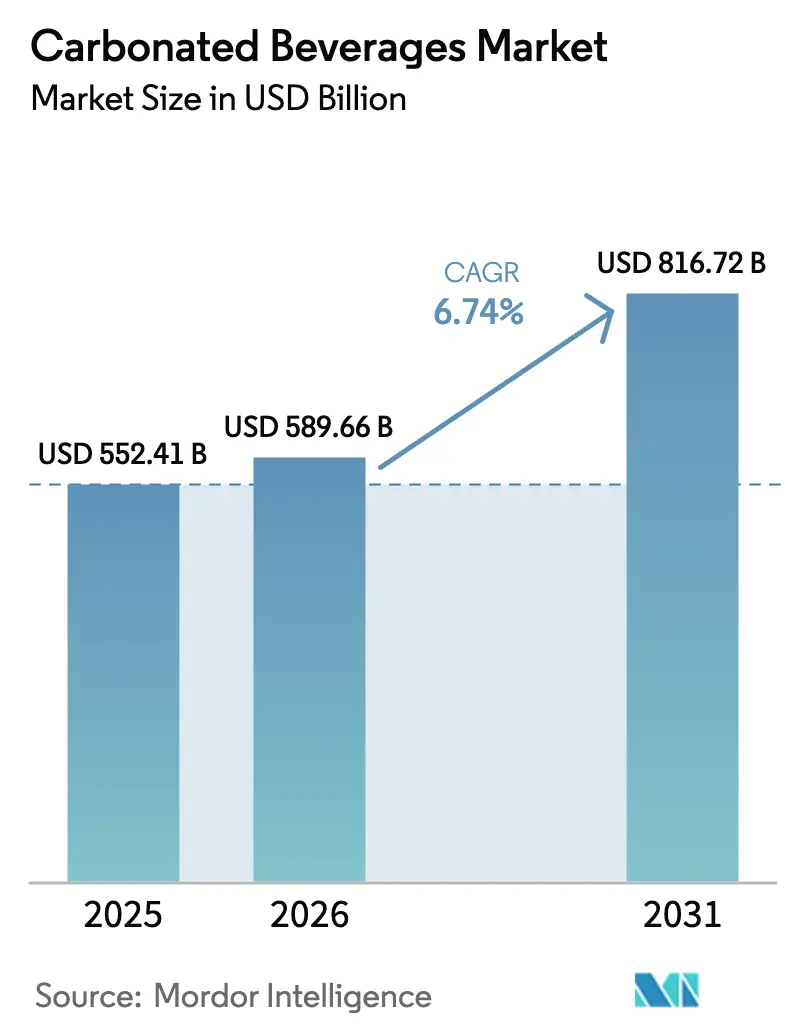
| Market Size (2026) | USD 589.66 Billion |
| Market Size (2031) | USD 816.72 Billion |
| Growth Rate (2026 - 2031) | 6.74% CAGR |
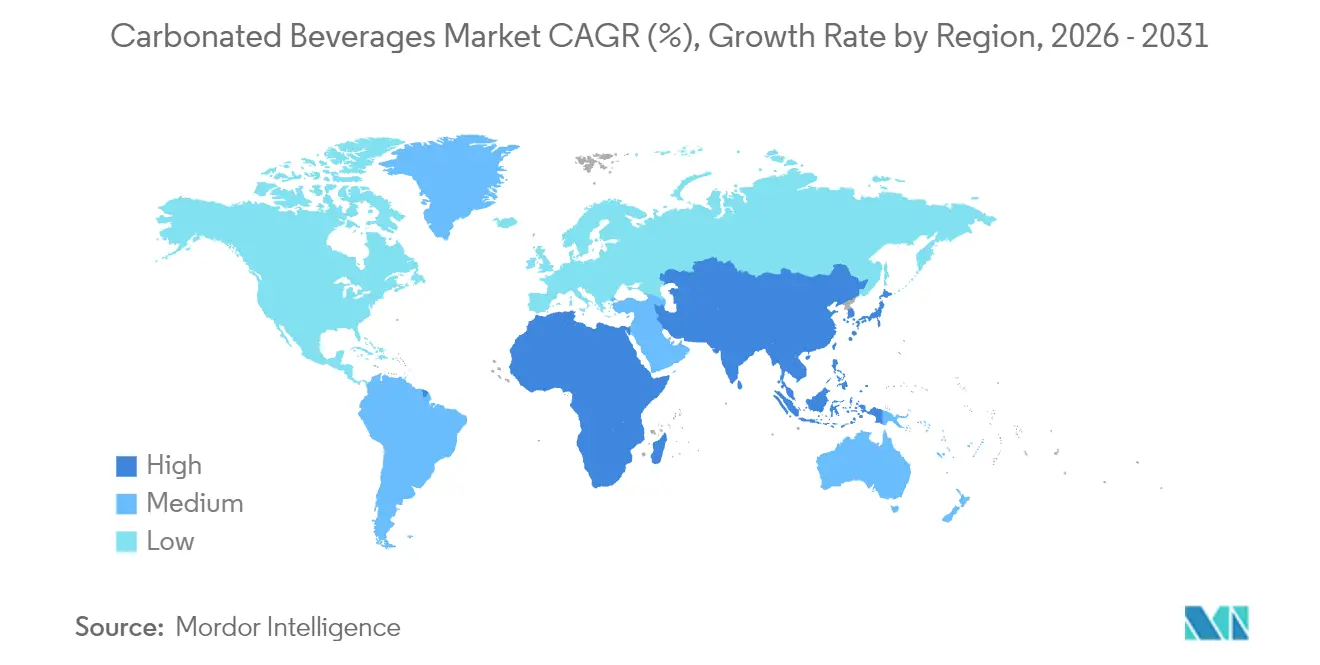
| Fastest Growing Market | Middle East and Africa |
| Largest Market | North America |
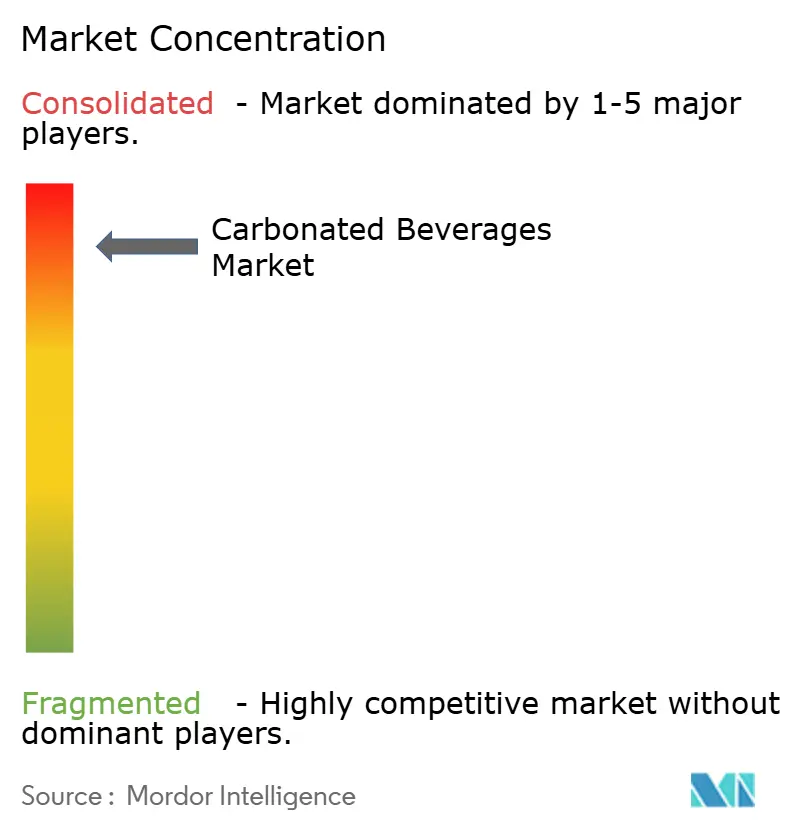
| Market Concentration | High |
Major Players
*Disclaimer: Major Players sorted in no particular order Image © Mordor Intelligence. Reuse requires attribution under CC BY 4.0. |
|
Carbonated Beverages Market Analysis by Mordor Intelligence
The carbonated beverages market size was valued at USD 552.41 billion in 2025 and estimated to grow from USD 589.66 billion in 2026 to reach USD 816.72 billion by 2031, at a CAGR of 6.74% during the forecast period (2026-2031). Despite growing health concerns, the market continues to expand. This growth is driven by premium, functional, and artisanal products that command higher prices, balancing out stagnant sales of traditional colas. Carbonated sports and energy drinks are leading the market due to their caffeine and electrolyte content, which appeals to consumers with active lifestyles. Aseptic packaging is also contributing to growth by reducing carbon footprints and improving access in rural areas. Additionally, direct-to-consumer models are simplifying the supply chain. Major companies are maintaining their market share by introducing sugar-free options and acquiring smaller businesses. At the same time, start-ups are finding success with innovations like plant-based sweeteners and carbonation using real fruit.
Key Report Takeaways
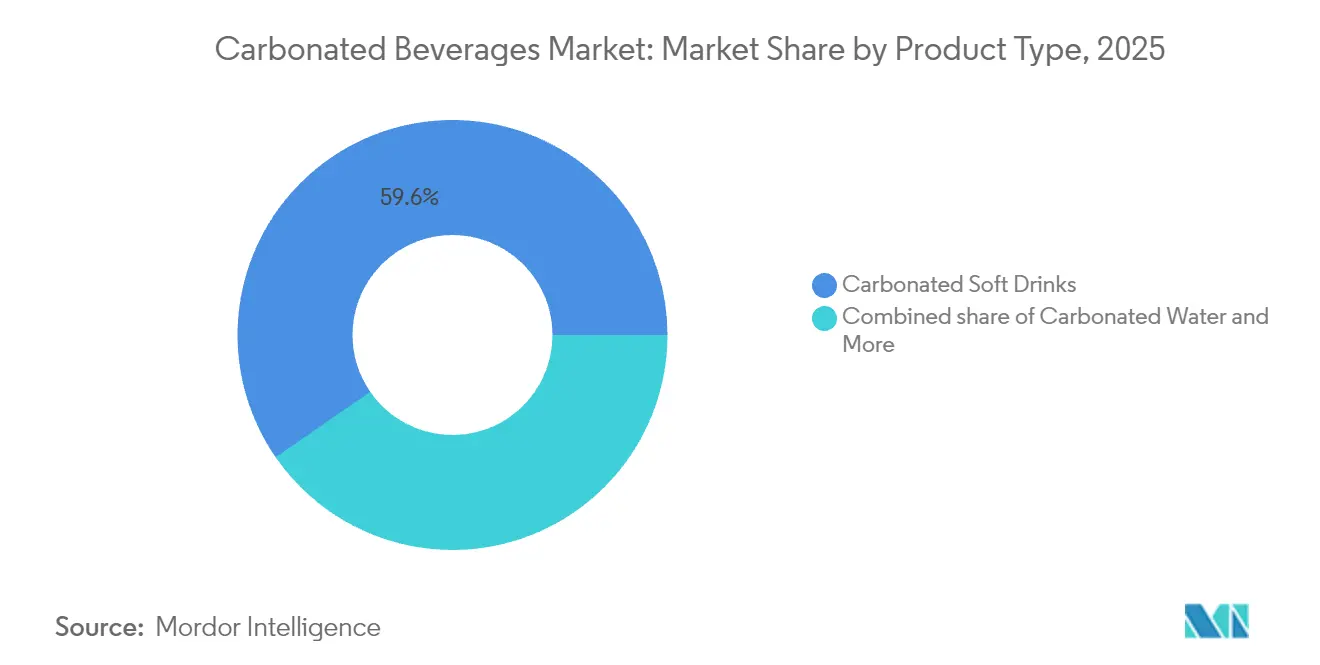
- By product type, carbonated soft drinks held 59.62% of the carbonated beverages market share in 2025, whereas carbonated sports and energy drinks are projected to compound at a 7.62% CAGR through 2031.
- By tier, the mass segment accounted for 74.55% of the carbonated beverages market size in 2025, but premium offerings are accelerating at a 7.18% CAGR to 2031.
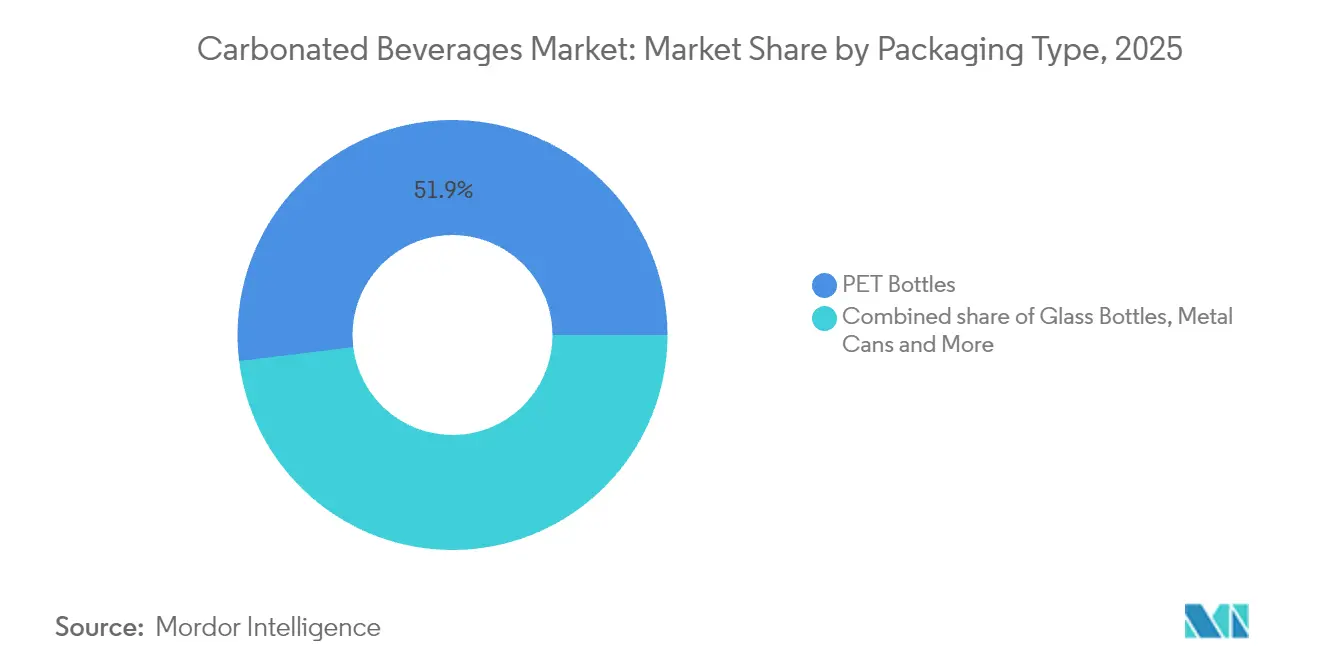
- By packaging, PET bottles captured 51.93% value in 2025; aseptic formats are forecast to post an 8.19% CAGR through 2031.
- By distribution channel, off-trade dominated with 87.60% contribution in 2025, while on-trade is anticipated to advance at an 8.02% CAGR.
- By geography, North America retained 46.90% carbonated beverages market share in 2025 and the Middle East and Africa region is expected to deliver a 8.98% CAGR to 2031.
Note: Market size and forecast figures in this report are generated using Mordor Intelligence’s proprietary estimation framework, updated with the latest available data and insights as of 2026.
Global Carbonated Beverages Market Trends and Insights
Driver Impact Analysis*
| Driver | (~) % Impact on CAGR Forecast | Geographic Relevance | Impact Timeline |
|---|---|---|---|
| Product innovation in flavors and formats | +1.8% | Global, with early adoption in North America and Western Europe | Medium term (2-4 years) |
| Rise of health-oriented formulations | +1.5% | Global, particularly strong in North America, Europe, and urban Asia-Pacific | Long term (≥ 4 years) |
| Faster-paced city living boosts need for convenient, portable beverages | +1.2% | Asia-Pacific core, spill-over to Middle East and Africa urban centers | Medium term (2-4 years) |
| Premiumization and artisanal offerings | +1.0% | North America, Western Europe, affluent Asia-Pacific metros | Long term (≥ 4 years) |
| Proliferation of e-commerce, convenience stores, and organized retail | +0.9% | Global, accelerated in Asia-Pacific and Middle East | Short term (≤ 2 years) |
| Aggressive campaigns, social media engagement, and celebrity endorsements | +0.6% | Global, with heightened impact in North America and Europe | Short term (≤ 2 years) |
| Source: Mordor Intelligence | |||
Product Innovation in Flavors and Formats
Flavor diversification is drawing in consumers who are bored with traditional cola and lemon-lime flavors. In February 2024, The Coca-Cola Company introduced Coca-Cola Spiced, a mix of raspberry and spice, aimed at younger consumers seeking unique options. Similarly, PepsiCo expanded its Bubly Burst line by adding caffeinated versions to compete in the functional refreshment market. Newer brands are focusing on wellness-oriented products: NO CAP! launched a prebiotic soda with 5 grams of fiber per can, Bloom Pop introduced collagen-infused drinks promoting skin health, and Mighty Pop included adaptogens like ashwagandha to help manage stress. These products are priced 30% to 50% higher than regular sodas but appeal to consumers who view them as functional supplements rather than just beverages. Japan's Coca-Cola Plus, fortified with indigestible dextrin fiber, demonstrates how regulatory approval for health claims can help products stand out in crowded markets. The increasing use of at-home carbonation systems, such as SodaStream and Aarke, shows a shift toward customizable flavors and reduced single-use packaging, which appeals to environmentally conscious households.
Rise of Health-Oriented Formulations
Zero-sugar and reduced-calorie options are now essential for brands to stay relevant, as evidence linking added sugars to metabolic disorders continues to grow. The World Health Organization recommends keeping free sugar intake below 10% of total energy consumption, prompting many brands to reformulate their products[1]World Health Organization. "Policy brief on the association between sugar-sweetened beverage consumption and childhood overweight and obesity" who.int. In North America, Zevia, which uses stevia as a sweetener, has experienced strong growth in retail markets. Similarly, Chi Forest in China has gained market share with erythritol-based products that provide sweetness without affecting blood sugar levels. However, natural sweeteners come with challenges. Stevia has a licorice-like aftertaste, and erythritol creates a cooling sensation, often requiring masking agents or blending with other non-nutritive sweeteners. Despite these issues, improved taste profiles are driving greater consumer acceptance. Additionally, brands are adding functional ingredients like electrolytes in sports drinks, probiotics for gut health, and vitamins for immunity. These features help position products as health-focused rather than indulgent, allowing brands to charge premium prices and reduce the impact of sugar taxes.
Faster-Paced City Living Boosts Need for Convenient, Portable Beverages
Urbanization is changing how people eat, increasing the need for grab-and-go options that fit into busy routines like commuting, gym visits, or working at a desk. Single-serve packaging has grown by 230 basis points in recent periods, showing that consumers prefer convenient, portable options over larger bottles that need refrigeration. Tetra Pak's on-the-go cartons, which are slim, resealable, and shelf-stable, are expanding into areas with unreliable cold-chain infrastructure. This allows brands to reach peri-urban and rural consumers who previously relied on returnable glass bottles. In Asian megacities, convenience stores and vending machines are becoming more common. They are located near transit hubs and office buildings, offering easy access to chilled carbonated drinks. This setup shortens the time between purchases and encourages impulse buys, especially for energy drinks and flavored sparkling waters often consumed as quick afternoon refreshments. However, this trend raises sustainability concerns. While smaller packaging reduces waste per use, the increase in single-use containers creates recycling challenges. These issues can be addressed through deposit-return schemes or extended producer responsibility programs.
Premiumization and Artisanal Offerings
Wealthy consumers are increasingly choosing craft sodas and sparkling drinks with botanical flavors, which offer a sense of sophistication and meet clean-label preferences. Brands like Fever-Tree and Fentimans promote their products as mixers for premium spirits, using natural ingredients such as quinine, elderflower, and ginger extracts. This approach allows them to charge prices two to three times higher than standard colas. Artisanal soda producers highlight small-batch production, locally sourced ingredients, and transparent supply chains, which appeal to millennials and Gen Z consumers who often distrust large multinational companies. Premium carbonated waters, including Perrier, San Pellegrino, and Topo Chico, are also gaining popularity. These are marketed as palate cleansers or healthier hydration options compared to still water, featuring light fruit flavors without the high sugar content of traditional sodas. This market segment is less impacted by economic downturns because its customers prioritize quality and brand heritage over price. As a result, it provides a stable revenue stream for companies moving away from volume-driven categories. Retail data shows that premium carbonated beverages are securing more shelf space in specialty grocery stores and upscale restaurants, where consumers are willing to pay extra for high-quality, carefully sourced products.
Restraints Impact Analysis*
| Restraint | (~) % Impact on CAGR Forecast | Geographic Relevance | Impact Timeline |
|---|---|---|---|
| Health consciousness and sugar aversion | -1.2% | Global, most pronounced in North America and Western Europe | Long term (≥ 4 years) |
| Stringent sugar regulations and taxes | -0.9% | Europe, select Asia-Pacific markets (India, Thailand), emerging in Middle East | Medium term (2-4 years) |
| Intense competition from healthier beverages | -0.7% | Global, accelerated in developed markets | Medium term (2-4 years) |
| Supply chain disruptions for ingredients | -0.5% | Global, with acute pressure in regions dependent on imported aluminum and sweeteners | Short term (≤ 2 years) |
| Source: Mordor Intelligence | |||
Health Consciousness and Sugar Aversion
Growing evidence shows that consuming too much sugar is linked to obesity, type 2 diabetes, and heart disease. As a result, more consumers are checking nutrition labels and cutting back on extra calories. Public health campaigns and media coverage have raised awareness about added sugars, leading people to choose unsweetened or lightly sweetened options like flavored sparkling water and kombucha. This trend is most noticeable among health-conscious groups, such as fitness enthusiasts, parents of young children, and individuals managing chronic health issues, who see traditional soft drinks as unsuitable for their wellness goals. To meet this demand, brands are expanding their zero-sugar product lines. However, matching the taste of sugary drinks remains a challenge for some products. Additionally, even though artificial sweeteners like aspartame and sucralose are approved by the U.S. Food and Drug Administration in 2024 and the European Food Safety Authority, many consumers remain skeptical about them[2]U.S. Food and Drug Administration. "Sweeteners and Food Additives Regulatory Framework." fda.gov. Companies also face challenges due to varying consumer preferences. Some people focus on reducing calories, others prefer natural ingredients, and some want both. This forces companies to manage multiple product variations, which adds pressure to their production and inventory systems.
Stringent Sugar Regulations and Taxes
Governments are increasingly introducing taxes on sugar-sweetened beverages to reduce public health costs and generate revenue. The United Kingdom's Soft Drinks Industry Levy, introduced in 2018, uses tiered rates based on sugar content. This policy resulted in a 40% reduction in sugar per 100 milliliters in affected products, showing that price changes can encourage reformulation. Australia is considering a 20% excise tax on beverages with high sugar levels. In India, a 40% goods and services tax on carbonated soft drinks is making these products less affordable, slowing down their sales in a price-sensitive market[3]Parliamentary Budget Office, "20% tax on sugar sweetened beverages", pbo.gov.au. Similarly, Gulf Cooperation Council countries like Saudi Arabia and the UAE have imposed selective taxes on carbonated drinks, increasing retail prices and reducing consumption, especially among middle-income households. These policies create challenges for multinational brands, as they must navigate different tax thresholds and enforcement rules across regions. Reformulating products to avoid taxes adds costs for research, development, and production changes, and there is a risk of losing loyal customers if the taste changes noticeably. Smaller companies may find it harder to handle these costs, which could lead to larger competitors acquiring niche brands to expand their portfolios and reduce regulatory risks.
*Our updated forecasts treat driver/restraint impacts as directional, not additive. The revised impact forecasts reflect baseline growth, mix effects, and variable interactions.
Segment Analysis
By Product Type: Energy Formulations Challenge Cola Dominance
In 2025, carbonated soft drinks accounted for 59.62% of the market share, driven by The Coca-Cola Company and PepsiCo. These well-established brands benefit from extensive distribution networks in over 200 countries and strong consumer loyalty built over generations. However, increasing health awareness in developed markets is reducing per-capita consumption. To address this, brands are focusing on zero-sugar variants, which are becoming a larger part of cola sales. In the United Kingdom, the Soft Drinks Industry Levy led to a 40% reduction in sugar content in carbonated soft drinks, showing how government policies can encourage reformulation and shift consumer preferences toward lower-calorie options. In Japan, Coca-Cola Plus, which contains indigestible dextrin fiber and is approved for health claims by regulators, highlights how functional ingredients can refresh traditional cola products in mature markets where differentiation is essential.
Carbonated sports and energy drinks are expected to grow at a 7.62% CAGR through 2031, making them the fastest-growing product category. Consumers increasingly see these drinks as performance enhancers rather than occasional treats. These beverages are now being consumed in new situations, such as during morning commutes as coffee alternatives, before workouts by fitness enthusiasts, and during late-night study sessions by students. This broader usage helps diversify revenue streams and reduces seasonal sales fluctuations. Brands are also offering different options, such as standard, extra strength, zero-sugar, and performance variants, to meet varying consumer needs and preferences. While some regions have introduced age-verification rules to address concerns about caffeine content for younger consumers, inconsistent enforcement has not significantly affected sales growth in major markets.
Note: Segment shares of all individual segments available upon report purchase
By Tier: Mass Volume Meets Premium Margin Expansion
In 2025, the mass tier accounted for 74.55% of the market, driven by value-conscious consumers in emerging markets where affordability is key. Carbonated beverages, priced under USD 1 per serving, are popular as affordable treats. This segment thrives in convenience stores, supermarkets, and vending machines, supported by promotions like buy-one-get-one-free offers and multi-pack discounts that encourage impulse buying and repeat purchases. Private-label brands are gaining ground, especially in European chains like Aldi and Lidl, offering products 30% to 40% cheaper than national brands. This shift is weakening brand loyalty among price-sensitive shoppers. In developed markets, growth is limited by health trends and sugar taxes, but emerging regions in Asia-Pacific, the Middle East, and Africa continue to drive volume growth due to rising incomes and improved retail access. Brands are defending their position through localized production to reduce costs, aggressive marketing for better shelf placement, and diverse product portfolios to cater to different income groups.
Premium offerings are growing at a 7.18% CAGR through 2031, fueled by affluent urban consumers in North America, Western Europe, and Asia-Pacific. These consumers see carbonated beverages as lifestyle products rather than basic refreshments. Brands like Fever-Tree, priced over USD 2 per bottle, stand out by using natural ingredients sourced from specific regions, such as quinine from the Democratic Republic of Congo and ginger from Nigeria. The premium segment benefits from the recovery of bars and restaurants, where craft sodas and mixers are used in cocktails, often marked up by 200% to 300%. Brands like Fentimans and Q Mixers target consumers who value quality ingredients, such as cane sugar and natural flavors, and are willing to pay for craftsmanship. This segment is less affected by economic downturns, as its consumers are less price-sensitive. Premium products are also gaining shelf space in specialty stores and upscale foodservice outlets, meeting the demand for curated selections.
By Packaging Type: PET Dominance Faces Sustainable Alternatives
In 2025, PET bottles held 51.93% of the market share, driven by their lightweight design, which lowers transportation costs, and shatter resistance, reducing breakage losses. Their compatibility with high-speed filling lines, processing over 1,000 bottles per minute, cuts production costs. PET bottles' transparency allows consumers to check product quality and carbonation, boosting confidence, while resealable caps enable portion control and multi-use consumption. However, rising concerns over single-use plastics have led to stricter regulations. The European Union's Single-Use Plastics Directive requires PET bottles to include 25% recycled content by 2025 and 30% by 2030, pushing brands to invest in recycling systems and secure recycled materials. Extended producer responsibility laws in states like California and New York now make beverage companies fund recycling programs, increasing costs and pressuring margins. Consumer backlash against plastic pollution has also prompted companies like Coca-Cola and PepsiCo to commit to recycling 100% of their packaging, though poor collection infrastructure in many regions remains a challenge.
Aseptic packaging, including Tetra Pak cartons and pouches, is growing at an 8.19% CAGR through 2031, driven by sustainability and logistical benefits. Tetra Pak's Prisma Aseptic 300 Edge format uses over 85% renewable materials, mainly certified paperboard, and reduces carbon emissions by 76% compared to older designs. Its paper-based barrier technology increases paper content to 80%, ensuring product protection while cutting emissions by 33%. Aseptic packaging eliminates the need for refrigeration through ultra-high-temperature processing and hermetic sealing, enabling energy-efficient distribution to areas with limited refrigeration, such as rural India and Southeast Asia. Tetra Pak's paper-based caps improve recyclability and align with circular economy goals. Additionally, rectangular cartons stack more efficiently than bottles or cans, improving pallet use by 10% and reducing transportation costs, which is critical as fuel prices and carbon taxes rise.
Note: Segment shares of all individual segments available upon report purchase
By Distribution Channel: Off-Trade Volume Anchors On-Trade Margin Growth
In 2025, off-trade channels, supermarkets, hypermarkets, convenience stores, specialty stores, and online retail, held 87.60% of the market share. This dominance reflects consumer preference for at-home consumption, which offers 50% to 70% per-unit cost savings compared to on-premise pricing. Bulk purchasing further reduces shopping frequency. Supermarkets and hypermarkets use promotions like end-cap displays, discounts, and multi-buy offers to drive sales of carbonated beverages, often using them to attract shoppers who then buy higher-margin products. Convenience stores are expanding in urban and suburban areas, offering chilled, single-serve formats for immediate consumption. Their locations near transit hubs, offices, and residential areas cater to time-sensitive consumers who value convenience over price. E-commerce is the fastest-growing off-trade channel, enabling direct-to-consumer sales that avoid distributor markups. Platforms like Amazon and Alibaba offer limited-edition flavors, bulk discounts, and same-day delivery, while data analytics help optimize inventory and reduce stock issues.
On-trade venues, restaurants, bars, cafes, hotels, and entertainment spots, are growing at an 8.02% CAGR through 2031, driven by urbanization, experiential dining, and younger consumers seeking social settings. Carbonated mixers and craft sodas command premium prices in these venues. In the United Kingdom, Gen Z is driving soft drink sales in on-premise locations, favoring low- and no-alcohol options that support longer socializing without intoxication. On-trade channels also serve as testing grounds for new products, where brands launch limited-edition flavors to gauge consumer interest before retail distribution. Partnerships with quick-service and fast-casual restaurants create frequent consumption opportunities through meal deals and fountain dispensers, building brand familiarity. However, these partnerships often require discounts and co-marketing efforts, which can reduce per-unit margins compared to retail sales.
Geography Analysis
In 2025, North America held 46.90% of the market share, supported by strong consumption habits, advanced cold-chain systems, and high spending on convenience beverages. However, growth is slowing due to increasing health awareness and sugar-tax discussions in the United States and Canada. The region drives innovation, with brands testing new flavors, functional drinks, and sustainable packaging locally before global launches. In Mexico, despite a soda tax, consumption remains high, showing lower price sensitivity than expected. The tax has increased revenue and shifted some consumers to smaller pack sizes. Regulatory challenges are rising, with California's bottle deposit system and New York's proposed producer responsibility laws complicating compliance. The FDA's scrutiny of artificial sweeteners and caffeine in energy drinks may also require reformulations. The on-trade channel is recovering post-pandemic, with craft sodas and premium mixers gaining popularity in cocktails featuring local and artisanal ingredients.
The Middle East and Africa are expected to grow at a 8.98% CAGR through 2031, the fastest globally, driven by rising incomes, retail modernization, and young populations in GCC countries and urban areas of Nigeria, Kenya, and South Africa. Taxes on carbonated drinks in Saudi Arabia and the UAE have raised prices but increased demand for zero-sugar and functional beverages. Improved infrastructure, supermarket growth, and better e-commerce logistics are helping brands reach rural and peri-urban areas. However, political instability, currency fluctuations, and reliance on imported materials like aluminum cans and sweeteners pose risks, requiring local partnerships and hedging strategies. The region’s hot climate ensures steady demand for chilled drinks, with Ramadan driving seasonal consumption spikes that challenge supply chains but offer revenue opportunities for agile brands.
Asia-Pacific markets are highly diverse. China’s ready-to-drink beverage market is growing due to urbanization, rising incomes, and the expansion of convenience stores and vending machines in major cities. In India, a 40% goods and services tax limits affordability, but premiumization is evident in cities where affluent consumers prefer imported and functional drinks. Japan leads in innovation with products like Coca-Cola Plus, enriched with fiber and approved for health claims, appealing to older consumers focused on wellness. Southeast Asia, including Thailand, Indonesia, and Vietnam, is seeing rapid retail growth and middle-class expansion, creating opportunities for brands investing in local production and distribution. In Europe, Germany, France, and Spain are shifting to premium craft sodas and botanical sparkling waters, while Eastern Europe remains price-sensitive and volume-driven. In South America, economic challenges in Argentina and Brazil slow growth, but urbanization and retail modernization in Colombia and Chile create opportunities for localized strategies.
Competitive Landscape
The carbonated beverages market is dominated by multinational companies that control large-scale production, bottling, and distribution networks. This control allows them to influence pricing, shelf placement, and promotional strategies. Their size gives them the ability to invest heavily in marketing, develop new flavors, and expand their brands, which strengthens customer loyalty and limits opportunities for smaller brands to grow. Major companies in the market include Keurig Dr Pepper, Inc., PepsiCo, Inc., Suntory Holdings Limited, The Coca-Cola Company, and Refresco Group B.V.
There are new opportunities in functional carbonated drinks, such as prebiotic sodas, collagen-infused beverages, and adaptogen blends. Products in this category can stand out and command higher prices if they receive regulatory approval for health claims. However, challenges like proving health benefits and meeting labeling requirements remain. Smaller brands like Zevia and Spindrift are finding success by using plant-based sweeteners and real-fruit carbonation. This is pushing larger companies to either collaborate with or acquire these smaller brands to stay competitive and maintain their shelf presence.
Technology is changing how companies compete in the market. Direct-to-consumer platforms help brands avoid distributor costs and build customer relationships through subscription models that provide steady income. Data analytics also play a key role by offering real-time insights into demand and helping optimize inventory, which reduces waste and improves efficiency. Packaging innovation is another area of competition. For example, Tetra Pak has developed paper-based barrier technology and caps that use over 85% renewable materials and reduce carbon emissions by up to 76%. This kind of innovation is becoming increasingly important as extended producer responsibility regulations expand in the European Union and other regions.
Carbonated Beverages Industry Leaders
-
Keurig Dr Pepper, Inc.
-
PepsiCo, Inc.
-
Suntory Holdings Limited
-
The Coca-Cola Company
-
Refresco Group B.V.
- *Disclaimer: Major Players sorted in no particular order
Recent Industry Developments
- November 2025: Radnor Hills introduced a new carbonated beverage line, Radnor Spring. The new Radnor Spring range features sparkling water with B vitamins in four fruity flavors, Black Cherry and Blackcurrant, Mango and Passionfruit, Pineapple and Grapefruit and Strawberry and Raspberry.
- October 2025: Nakoda Group of Industries Limited has expanded into the beverages segment with the launch of its new brand "NO CTRL (NO CONTROL)". According to the company, the new brand offers a range of energy drinks and flavoured carbonated soft drinks.
- May 2025: Keurig Dr Pepper introduced its new 2025 lineup in the United States, featuring brands such as Dr Pepper, 7UP, A&W and Snapple. According to the company, the new Dr Pepper line is made available in regular and zero sugar varieties across a range of pack sizes, plus fountain and frozen dispensed formats.
- February 2025: Aqua Libra brand has introduced a watermelon and strawberry flavour to its infused sparkling water range. According to the brand, the new line is available in multipacks of four and 24 via the United Kingdom grocery channel. The new flavour features a blend of sweet flavour profiles and is free from sugar and preservatives.
Global Carbonated Beverages Market Report Scope
Diet Cola, Fruit Flavored Carbonates, Standard Cola are covered as segments by Soft Drink Type. Disposable Cups, Glass Bottles, Metal Can, PET Bottles are covered as segments by Packaging Type. Off-trade, On-trade are covered as segments by Distribution Channel. Africa, Asia-Pacific, Europe, Middle East, North America, South America are covered as segments by Region.| Carbonated Soft Drinks |
| Carbonated Water |
| Carbonated Sports and Energy Drinks |
| Others |
| Mass |
| Premium |
| PET Bottles |
| Glass Bottles |
| Metal Can |
| Aseptic packages (tetra pak, cartons, pouches) |
| On-Trade | |
| Off-Trade | Supermarket/Hypermarket |
| Convenience Stores | |
| Specialty Stores | |
| Online Retail | |
| Other Distribution Channels |
| North America | United States |
| Canada | |
| Mexico | |
| Rest of North America | |
| Europe | Germany |
| United Kingdom | |
| Italy | |
| France | |
| Spain | |
| Netherlands | |
| Poland | |
| Belgium | |
| Sweden | |
| Rest of Europe | |
| Asia-Pacific | China |
| India | |
| Japan | |
| Australia | |
| Indonesia | |
| South Korea | |
| Thailand | |
| Singapore | |
| Rest of Asia-Pacific | |
| South America | Brazil |
| Argentina | |
| Colombia | |
| Chile | |
| Peru | |
| Rest of South America | |
| Middle East and Africa | South Africa |
| Saudi Arabia | |
| United Arab Emirates | |
| Nigeria | |
| Egypt | |
| Morocco | |
| Turkey | |
| Rest of Middle East and Africa |
| By Product Type | Carbonated Soft Drinks | |
| Carbonated Water | ||
| Carbonated Sports and Energy Drinks | ||
| Others | ||
| By Tier | Mass | |
| Premium | ||
| By Packaging Type | PET Bottles | |
| Glass Bottles | ||
| Metal Can | ||
| Aseptic packages (tetra pak, cartons, pouches) | ||
| By Distribution Channel | On-Trade | |
| Off-Trade | Supermarket/Hypermarket | |
| Convenience Stores | ||
| Specialty Stores | ||
| Online Retail | ||
| Other Distribution Channels | ||
| By Geography | North America | United States |
| Canada | ||
| Mexico | ||
| Rest of North America | ||
| Europe | Germany | |
| United Kingdom | ||
| Italy | ||
| France | ||
| Spain | ||
| Netherlands | ||
| Poland | ||
| Belgium | ||
| Sweden | ||
| Rest of Europe | ||
| Asia-Pacific | China | |
| India | ||
| Japan | ||
| Australia | ||
| Indonesia | ||
| South Korea | ||
| Thailand | ||
| Singapore | ||
| Rest of Asia-Pacific | ||
| South America | Brazil | |
| Argentina | ||
| Colombia | ||
| Chile | ||
| Peru | ||
| Rest of South America | ||
| Middle East and Africa | South Africa | |
| Saudi Arabia | ||
| United Arab Emirates | ||
| Nigeria | ||
| Egypt | ||
| Morocco | ||
| Turkey | ||
| Rest of Middle East and Africa | ||
Market Definition
- Carbonated Soft Drinks (CSDs) - Carbonated soft drinks (CSDs) refer to non-alcoholic beverages that are carbonated and typically flavored, containing dissolved carbon dioxide to create effervescence. These beverages commonly include cola, lemon-lime, orange, and various fruit-flavored sodas. Marketed in cans, bottles, or fountain dispense.
- Juices - We have considered packaged juices which encompass non-alcoholic beverages derived from fruits, vegetables, or a combination thereof, processed and sealed in various packaging formats such as bottles, cartons, or pouches. Excluding fresh juices, this market segment involves commercially prepared and preserved juices, often with added preservatives and flavors.
- Ready-to-Drink (RTD) Tea and RTD Coffee - Ready-to-Drink (RTD) tea and RTD coffee are pre-packaged, non-alcoholic beverages that are brewed and prepared for consumption without further dilution. RTD tea typically includes various tea varieties, infused with flavors and sweeteners, and comes in bottles, cans, or cartons. Similarly, RTD coffee involves pre-brewed coffee formulations, often mixed with milk, sugar, or flavorings, and is conveniently packaged for on-the-go consumption.
- Energy Drinks - Energy drinks are non-alcoholic beverages formulated to provide a quick boost of energy and alertness. Whereas, sports drinks are beverages designed to hydrate and replenish electrolytes, particularly after physical exertion, exercise, or intense activity
| Keyword | Definition |
|---|---|
| Carbonated Soft Drinks | Carbonated soft drinks (CSDs) are a combination of carbonated water and flavouring, sweetened by sugar or a non-sugar sweeteners. |
| Standard Cola | Standard Cola is defined as the original flavor of cola soda. |
| Diet Cola | A cola-based soft drink containing no or low amounts of sugar |
| Fruit Flavored Carbonates | A carbonated beverage prepared from fruit juice/fruit flavor with carbonated water and containing sugar, dextrose, invert sugar or liquid glucose either singly or in combination. It may contain peel oil and fruit essences. |
| Juice | Juice is a drink made from the extraction or pressing of the natural liquid contained in fruit and vegetables. |
| 100% Juice | Fruit/vegetable juice made from fruit in the form of its juice with no water added to make up the volume. It is not permitted to add sugars, sweeteners, preservatives, flavourings or colourings to fruit juice. |
| Juice Drinks (up to 24% Juice) | Fruit/vegetable juice drinks with up to 24% fruits/vegetable extract. |
| Nectars (25-99% Juice) | Juices that can have between 25 and 99% of fruit, with the minimum legal limits defined depending on the type of fruit |
| Juice concentrates | Juice Concentrates are those form of juices when most of this liquid is removed resulting in a thick, syrupy product known as juice concentrate. |
| RTD Coffee | Packaged coffee beverages that are sold in a prepared form and are ready for consumption at the time of purchase. |
| Iced Coffee | An iced coffee is a cold version of coffee, usually a combination of hot espresso and milk with ice added to it. |
| Cold Brew Coffee | Cold brew also called cold water extraction or cold pressing is made by steeping ground coffee in room-temperature water for several hours. |
| RTD Tea | Ready-to-drink (RTD) tea is a packaged tea product ready for immediate consumption without brewing or preparation |
| Iced Tea | Ice tea or iced tea is a drink made from tea without milk but with sugar and sometimes fruit flavourings, drunk cold. |
| Green Tea | Green tea is a tea beverage which promotes mental alertness, relieving digestive symptoms and promoting weight loss. |
| Herbal Tea | Herbal tea beverages are made from the infusion or decoction of herbs, spices, or other plant material in hot water. |
| Energy Drink | A type of drink containing stimulant compounds, usually caffeine, which is marketed as providing mental and physical stimulation. They may or may not be carbonated and may also contain sugar, other sweeteners, or herbal extracts, among numerous possible ingredients. |
| Sugar-free or Low-calories Energy Drinks | Sugar-free or Low-calories Energy Drinks are sugar-free, artificially sweetened energy drinks with few or no calories. |
| Traditional Energy Drink | Traditional Energy Drinks are functional soft drinks containing ingredients designed to boost the consumer's energy. |
| Natural/Oraganic Energy Drinks | Natural/Organic energy drinks are energy drinks free of artificial sweeteners and synthetic colorings. Instead, they contain naturally derived ingredients such as green tea, yerba mate, and botanical extracts. |
| Energy Shots | A small but highly concentrated energy drink that contains large amounts of caffeine and/or other stimulants. The quantity is comparatively smaller compared to energy drinks. |
| Sports Drink | Sports drinks are beverages designed specifically for the rapid supply of fluid, carbohydrates, and electrolytes before, during or after exercise. |
| Isotonic | Isotonic drinks contain similar concentrations of salt and sugar as in the human body, and are designed to quickly replace fluids lost during exercise but with an increase of carbohydrate. |
| Hypertonic | Hypertonic drinks have a higher concentration of salt and sugar than the human body. They are best drunk after exercise as it is important to replace glycogen levels quickly after exercise. |
| Hypotonic | Hypotonic drinks are designed to quickly replace fluids lost during exercise. They have very low carbohydrate content and a lower concentration of salt and sugar than the human body. |
| Electrolyte-Enhanced Water | Electrolyte water is water infused with electrically-charged minerals, such as sodium, potassium, calcium, and magnesium. |
| Protein-based Sport Drinks | Protein-based sports drinks are those sports drinks which has added protein in it that will improve performance and reduce muscle protein breakdown. |
| On-Trade | The on-trade refers to places that sell beverages for immediate consumption on the premises like bars, restaurants, and pubs |
| Off-Trade | Off-trade usually means places like liquor stores, supermarkets and other places where you don't consume the beverage right away. |
| Convenience Store | A retail business that provides the public with a convenient location to quickly purchase a wide variety of consumable products and services, generally food and gasoline. |
| Specialty store | A specialty store is a shop/store that carries a deep assortment of brands, styles, or models within a relatively narrow category of goods |
| Online Retail | Online retail is a type of eCommerce whereby a business sells goods or services directly to consumers from a website. |
| Aseptic Packaging | Aseptic packaging refers to the filling of a cold, commercially sterile product under sterile conditions into a presterilized container and closure under sterile conditions to form a seal that effectively excludes microorganisms. These includes tetra packs, cartons, pouches etc. |
| PET Bottle | PET bottle means a bottle made of polyethylene terephthalate. |
| Metal Cans | Metal containers made of aluminum or tin- plated or zinc-plated steel, which are commonly used for packaging food, beverages or other products. |
| Disposable Cups | Disposable Cup means a cup or other container designed for single use to serve beverages, such as water, cold drinks, hot drinks and alcoholic beverages. |
| Gen Z | A way of referring to the group of people who were born in the late 1990s and early 2000s. |
| Millenial | Anyone born between 1981 and 1996 (ages 23 to 38 in 2019) is considered a Millennial |
| Taurine | Taurine is an amino acid that supports immune health and nervous system function. |
| Bars & Pubs | It is a drinking establishment licensed to serve alcoholic drinks for consumption on the premises. |
| Café | It is a foodservice establishment serving refreshments (mainly coffee) and light meals. |
| On the go | It means doing / dealing with while busily engaged with something and not diverting plans in order to accommodate. |
| Internet Penetration | The Internet Penetration Rate corresponds to the percentage of the total population of a given country or region that uses the Internet. |
| Vending Machine | A machine that dispenses small articles such as food, drinks, or cigarettes when a coin or token is inserted |
| Discount store | A discount store or discounter offers a retail format in which products are sold at prices that are in principle lower than an actual or supposed "full retail price". Discounters rely on bulk purchasing and efficient distribution to keep down costs. |
| Clean Label | Clean label on the beverage market are drinks that are made from few ingredients of natural origin and are not or only slightly processed. |
| Caffeine | An alkaloid compound which is a stimulant of the central nervous system. It is mainly used recreationally, as a mild cognitive enhancer to increase alertness and attentional performance. |
| Extreme sport | Action sports, adventure sports or extreme sports are activities perceived as involving a high degree of risk. |
| High-intensity interval training | It incorporates several rounds that alternate between several minutes of high intensity movements to significantly increase the heart rate to at least 80% of one's maximum heart rate, followed by short periods of lower intensity movements. |
| Shelf life | The length of time for which an item remains usable, fit for consumption, or saleable. |
| Cream Soda | Cream soda is a sweet soft drink. Generally flavored with vanilla and based on the taste of an ice cream float |
| Root Beer | Root beer is a sweet North American soft drink traditionally made using the root bark of the sassafras tree Sassafras albidum or the vine of Smilax ornata as the primary flavor. Root beer is typically, but not exclusively, non-alcoholic, caffeine-free, sweet, and carbonated. |
| Vanilla Soda | A carbonated soft drink flavoured with vanilla. |
| Dairy-Free | A product that does not contain any milk or milk products from cows, sheep or goats. |
| Caffeine-Free Energy Drinks | Caffeine-free energy drinks rely on other ingredients to boost the energy. Popular choices include amino acids, B vitamins, and electrolytes. |
Research Methodology
Mordor Intelligence follows a four-step methodology in all our reports.
- Step-1: IDENTIFY KEY VARIABLES: In order to build a robust forecasting methodology, the variables and factors identified in Step 1 are tested against available historical market numbers. Through an iterative process, the variables required for market forecast are set, and the model is built on the basis of these variables.
- Step-2: Build a Market Model: Market-size estimations for the forecast years are in nominal terms. Inflation is not a part of the pricing, and the average selling price (ASP) is kept constant throughout the forecast period for each country.
- Step-3: Validate and Finalize: In this important step, all market numbers, variables, and analyst calls are validated through an extensive network of primary research experts from the market studied. The respondents are selected across levels and functions to generate a holistic picture of the market studied.
- Step-4: Research Outputs: Syndicated reports, custom consulting assignments, databases & subscription platforms


