
Carbonated Beverage Processing Equipment Market Size and Share
Market Overview
| Study Period | 2021 - 2031 |
|---|---|
| Market Size (2026) | USD 7.87 Billion |
| Market Size (2031) | USD 9.67 Billion |
| Growth Rate (2026 - 2031) | 4.21 % |
| Fastest Growing Market | Asia Pacific |
| Largest Market | North America |
| Market Concentration | Medium |
Major Players *Disclaimer: Major Players sorted in no particular order Image © Mordor Intelligence. Reuse requires attribution under CC BY 4.0. | |
Carbonated Beverage Processing Equipment Market Analysis by Mordor Intelligence
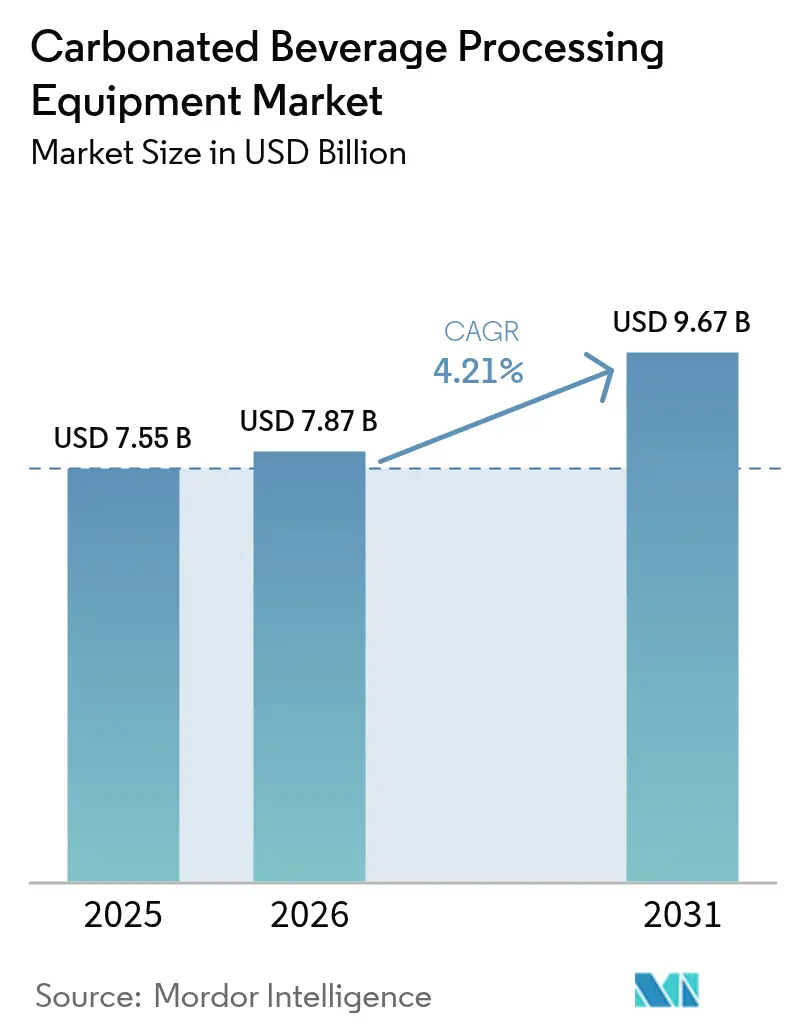
The carbonated beverage processing equipment market size was valued at USD 7.55 billion in 2025 and estimated to grow from USD 7.87 billion in 2026 to reach USD 9.67 billion by 2031, at a CAGR of 4.21% during the forecast period (2026-2031). The market growth is driven by increased investments in the beverage industry, strict food safety regulations, and sustainability requirements. Equipment manufacturers are integrating IoT sensors, predictive maintenance software, and energy recovery systems to reduce operational downtime and energy consumption. These technological integrations enable real-time monitoring of production processes, early detection of potential equipment failures, and optimization of energy usage across the manufacturing line. While North American beverage companies upgrade their existing production lines to improve efficiency and meet modern manufacturing standards, Asia-Pacific manufacturers are establishing new facilities to address growing urban consumption patterns and changing consumer preferences. The increasing demand for premium craft sodas and functional carbonated beverages is driving manufacturers to develop modular, compact equipment that efficiently manages smaller production batches. These flexible systems allow producers to quickly switch between different product formulations and package sizes while maintaining optimal production efficiency and quality standards.
Key Report Takeaways
- By equipment type, carbonation systems led with 34.85% revenue share in 2025, whereas sugar dissolution systems are forecast to expand at a 4.92% CAGR through 2031.
- By beverage type, carbonated soft drinks captured 42.62% of the carbonated beverage processing equipment market share in 2025, carbonated functional beverages are advancing at a 5.41% CAGR to 2031.
- By automation level, fully automatic processing equipment accounted for 54.60% of the carbonated beverage processing equipment market size in 2025 and is set to grow at a 5.55% CAGR through 2031.
- By geography, North America held 34.75% revenue share in 2025, while Asia-Pacific is projected to post the fastest regional CAGR at 5.44% to 2031.
Note: Market size and forecast figures in this report are generated using Mordor Intelligence’s proprietary estimation framework, updated with the latest available data and insights as of 2026.
Global Carbonated Beverage Processing Equipment Market Trends and Insights
Drivers Impact Analysis*
| DRIVER | (~) % IMPACT ON CAGR FORECAST | GEOGRAPHIC RELEVANCE | IMPACT TIMELINE |
|---|---|---|---|
| Rising carbonated soft drink consumption | +1.2% | Global, with strongest impact in Asia-Pacific and emerging markets | Medium term (2-4 years) |
| Growing preference for automated and energy-efficient beverage processing systems | +0.9% | North America and Europe leading, Asia-Pacific following | Long term (≥ 4 years) |
| Advances in carbonation and packaging technologies enhancing efficiency and quality | +0.8% | Global, with technology hubs in Germany, United States, and Japan | Medium term (2-4 years) |
| Increasing use of pet bottles and cans in carbonated beverage packaging | +0.6% | Global, particularly strong in Asia-Pacific and Latin America | Short term (≤ 2 years) |
| Growth of craft soda startups driving demand for modular and scalable equipment | +0.4% | North America and Europe core, expanding to urban centers globally | Long term (≥ 4 years) |
| Integration of IOT and smart sensors for real-time monitoring and predictive maintenance | +0.7% | Advanced markets initially, scaling to developing regions | Long term (≥ 4 years) |
| Source: Mordor Intelligence | |||
Rising carbonated soft drink consumption
Global demand for carbonated beverages continues to grow despite increasing sugar-reduction initiatives worldwide. In the Asia-Pacific region, bottling companies are installing new high-speed production lines to meet the rising demand from urban consumers who prefer portable packaging formats for their daily consumption. These advanced production systems require sophisticated carbonation units that can maintain consistent CO₂ levels across varying temperature ranges, leading equipment manufacturers to enhance their inline-blending systems and develop more efficient sanitary valve technologies. The expanding consumption patterns in both developed and emerging markets are generating increased demand for specialized processing equipment that can handle multiple beverage formulations, including traditional carbonated soft drinks, reduced-sugar options, natural sweetener variants, and functional sparkling beverages with added nutrients and supplements. According to the data from the British Soft Drinks Association, an increase from 2023, approximately 5.9 billion liters of carbonates were consumed in the United Kingdom.[1]
Growing preference for automated and energy-efficient beverage processing systems
Beverage manufacturers are increasing automation and energy efficiency to address labor shortages, reduce operational costs, and meet sustainability goals. Equipment manufacturers are developing integrated systems that combine multiple processing steps, including filling, capping, labeling, and packaging, while reducing energy consumption through advanced heat recovery technologies and minimizing water usage with sophisticated cleaning-in-place systems. Heat-recovery exchangers capture and reuse thermal energy from processing operations, dry-lubrication conveyors eliminate the need for water-based lubricants, and AI-based cleaning-in-place cycles optimize cleaning schedules and chemical usage to reduce water and detergent consumption. With return-on-investment periods now under four years, mid-sized bottlers are transitioning from semi-automatic systems to fully automated operations, enabling 24/7 production with minimal human intervention. These automated systems incorporate sensors and monitoring equipment to track production metrics, maintain quality control, and predict maintenance needs, while advanced robotics handle material movement and packaging tasks traditionally performed by human operators.
Advances in carbonation and packaging technologies enhancing efficiency and quality
Carbonation technology advances have transformed beverage manufacturing through sophisticated CO2 dissolution control systems that precisely regulate gas-to-liquid ratios, advanced inline blending capabilities that ensure homogeneous mixing of ingredients, and state-of-the-art aseptic processing methods that significantly extend product shelf life while preserving taste profiles and nutritional integrity. Equipment manufacturers now integrate comprehensive digital monitoring systems featuring real-time sensors and automated controls that continuously track carbonation levels, temperature profiles, and pressure variations throughout the production process, ensuring batch-to-batch consistency and minimizing material waste through predictive maintenance algorithms. Packaging technology improvements have revolutionized the industry with innovative lightweight materials incorporating nano-engineered barrier properties, smart packaging features for enhanced product protection, and advanced recyclability characteristics that align with circular economy principles while optimizing transportation efficiency and reducing overall logistics costs.
Increasing use of PET bottles and cans in carbonated beverage packaging
The beverage industry's transition to PET bottles and aluminum cans increases equipment demand as producers modify their packaging operations to maintain efficiency and market competitiveness. Equipment manufacturers now offer advanced filling systems that handle both PET and aluminum containers, allowing producers to adjust packaging strategies based on market dynamics, consumer preferences, and production costs. The ongoing aluminum can shortage creates significant opportunities for flexible equipment solutions that enable seamless transitions between container types while maintaining production efficiency. Processing systems must comprehensively address specific requirements for each packaging format, including precise fill rates, reliable sealing methods, and comprehensive quality verification protocols. This diversification in packaging drives the need for sophisticated modular equipment that can rapidly adapt to various container sizes and materials, helping producers effectively manage supply chain disruptions, meet changing consumer demands, and capitalize on emerging market opportunities.
Restraints Impact Analysis*
| Restraint | (~) % Impact on CAGR Forecast | Geographic Relevance | Impact Timeline |
|---|---|---|---|
| High initial capital investment and operating costs | -0.8% | Global, particularly impacting emerging markets and SMEs | Short term (≤ 2 years) |
| Strict food safety and equipment sanitation regulations increasing complexity | -0.5% | Advanced markets with stringent regulatory frameworks | Medium term (2-4 years) |
| Rising consumer shift toward healthier, non-carbonated beverages reducing carbonation demand | -0.6% | North America and Europe leading, spreading globally | Long term (≥ 4 years) |
| Fluctuating raw material costs and supply chain disruptions affecting equipment production | -0.4% | Global, with particular impact on steel and aluminum-dependent regions | Short term (≤ 2 years) |
| Source: Mordor Intelligence | |||
High initial capital investment and operating costs
The high costs of equipment procurement and installation present major barriers for beverage producers, especially small manufacturers and new market entrants looking to establish or expand carbonated beverage production. Equipment manufacturers offer modular systems for phased implementation, enabling beverage producers to begin with basic configurations and expand as production volumes increase. These financing challenges particularly affect craft beverage startups and regional producers who compete with multinational corporations but have limited financial resources. As a result, the market sees increased demand for used equipment and equipment-as-a-service options that lower initial capital requirements while providing access to advanced processing technologies.
Strict food safety and equipment sanitation regulations increasing complexity
The 2022 US FDA Food Code revision strengthened requirements for active managerial control, requiring fillers to incorporate electropolished surfaces, tool-less disassembly, and validation-ready CIP cycles.[2] Equipment manufacturers must comply with strict sanitation standards, including specific food-contact surface requirements, cleaning-in-place systems, and documentation protocols that align with HACCP principles. The increased regulatory requirements drive up equipment costs as manufacturers integrate additional sensors, monitoring systems, and documentation features to meet current standards. Processing equipment requires design elements that enable frequent cleaning while maintaining production efficiency, including appropriate materials, protective coatings, and automated cleaning systems that reduce manual cleaning while ensuring sanitation standards. These requirements create significant challenges for smaller equipment manufacturers and beverage producers who do not have dedicated compliance departments and must depend on equipment vendors for regulatory compliance support.
*Our forecasts treat driver/restraint impacts as directional, not additive. The impact forecasts reflect baseline growth, mix effects, and variable interactions.
Segment Analysis
By Equipment Type: Precision Modules Define Next-Generation Lines
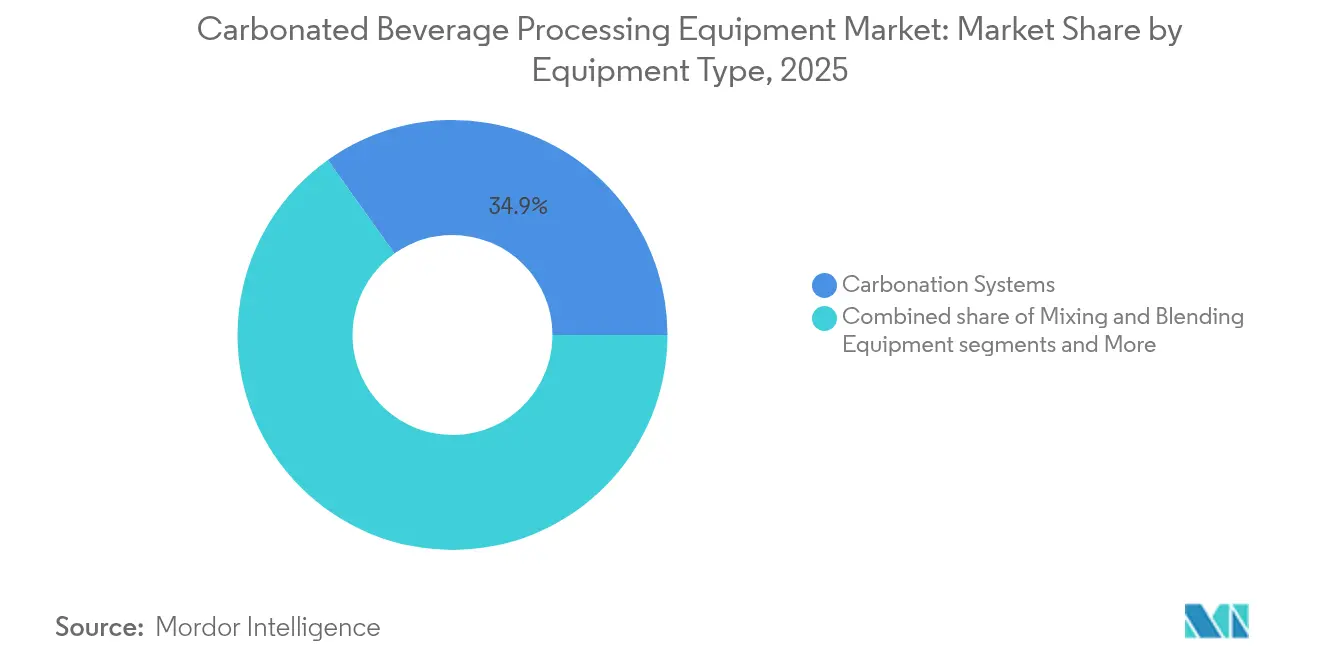
Carbonation systems dominated with a 34.85% share of the carbonated beverage processing equipment market in 2025, maintaining their essential position in ensuring consistent taste profiles across beverage production lines. Sugar dissolution systems recorded a significant 4.92% CAGR, primarily driven by increased production demands for low-Brix colas and zero-sugar sodas that require precise micron-level dosing capabilities. Manufacturers are strategically integrating mixing, deaeration, and carbonation functions into comprehensive unified systems to minimize facility footprint requirements and enhance cleaning efficiency across production cycles. Pentair's advanced CO₂-recovery system demonstrates sustainable manufacturing design by capturing and purifying fermentation gas at 99.998% purity for direct reuse in soft-drink production lines, substantially reducing external CO₂ requirements by up to 60%.
Heat exchangers and membrane filters maintain robust market performance, with technological developments focusing on advanced regenerative plate packs and sophisticated back-pulseable cartridges that significantly extend cleaning intervals in production environments. The market for mixing and blending equipment continues to expand as manufacturers increase production of sparkling functional beverages containing complex botanical ingredients that require specialized high-speed agitation processes. Equipment manufacturers are strategically incorporating advanced low-RPM magnetic mixers and precision in-tank ultrasound emulsifiers to maintain and protect the effectiveness of sensitive bioactive ingredients throughout the production process.

By Level of Automation: Digital Twins and Lights-Out Operations
Fully automatic processing equipment accounted for 54.60% of the carbonated beverage processing equipment market size in 2025 and is likely to grow at a CAGR of 5.55% through 2026-2031. These systems are experiencing rapid growth due to advancements in robotics and artificial intelligence platforms. The integrated control systems now manage complex recipe formulations, monitor Overall Equipment Effectiveness (OEE), and implement predictive maintenance ordering protocols. This comprehensive automation enables real-time data collection, analysis, and optimization across bottling facilities, improving operational efficiency and product consistency.
Semi-automatic modules maintain strong demand among regional bottlers seeking lower capital expenditure while meeting hygiene standards. These systems offer a balance between manual control and automated processes, allowing operators to maintain quality while reducing labor costs. While craft soda manufacturers prefer batch carbonation vessels for precise production control and customization capabilities, many integrate cloud-connected flowmeters for remote diagnostics and quality assurance. This transition enables smaller manufacturers to achieve higher production efficiency while retaining their artisanal production methods.
By Beverage Type: Functional Formulations Accelerate Equipment Upgrades
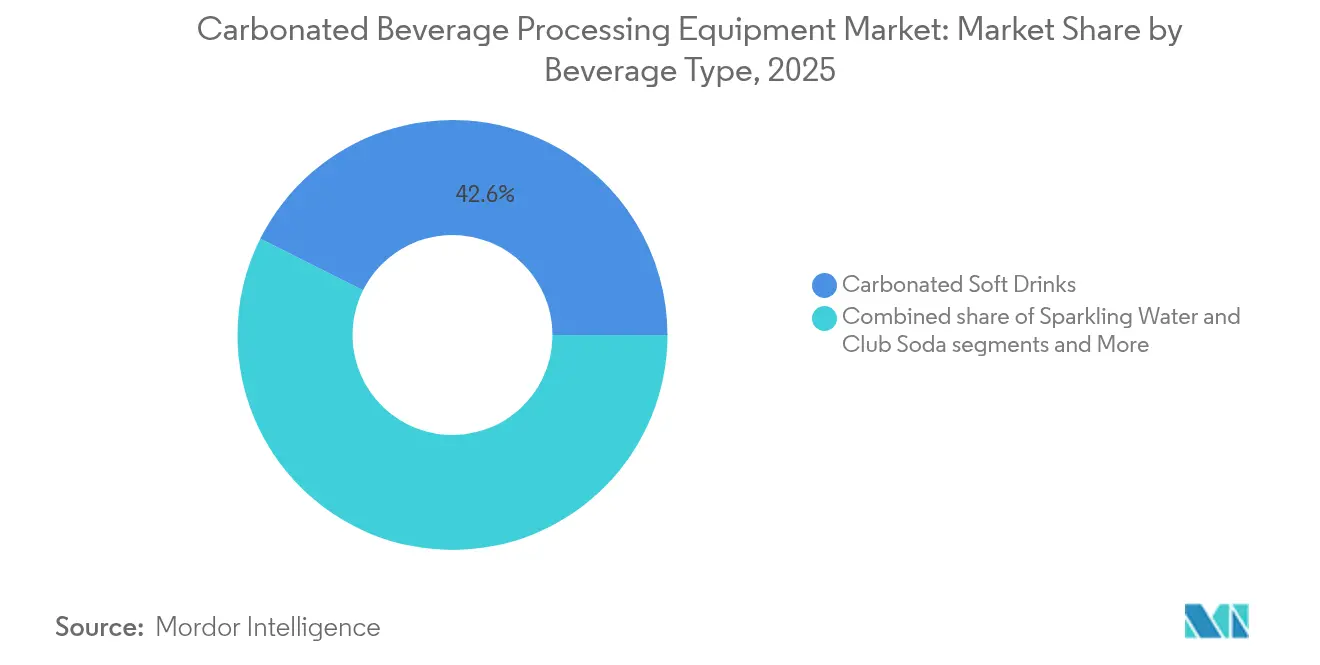
Carbonated soft drinks maintain market dominance with 42.62% market share, while carbonated functional beverages grow at a 5.41% CAGR, influencing equipment specifications. The production of probiotic sodas, vitamin-fortified seltzers, and plant-based energy drinks requires aseptic fillers with specialized carbonation loops to minimize oxygen pick-up. Manufacturers now implement dual-zone tunnel pasteurizers for precise heat treatment to preserve live cultures. Sparkling water production lines increasingly utilize glass packaging for premium products, requiring rinser-filler-capper monoblocks that process 60,000 bottles per hour across various neck finishes.
While carbonated isotonic and energy drink equipment market share remains stable, higher caffeine concentrations necessitate seamers to maintain dissolved-oxygen levels under 0.5 ppm. Equipment manufacturers address this through long-stem vent tubes and in-line deaeration membranes, enabling shelf stability without preservatives. The market demands flexible production lines capable of handling multiple beverage types and packaging formats. Manufacturers incorporate quick-changeover systems and modular equipment to minimize production downtime. Advanced control systems with recipe management ensure product consistency across beverage varieties. IoT sensors and real-time monitoring systems enable predictive maintenance and production optimization.
Geography Analysis
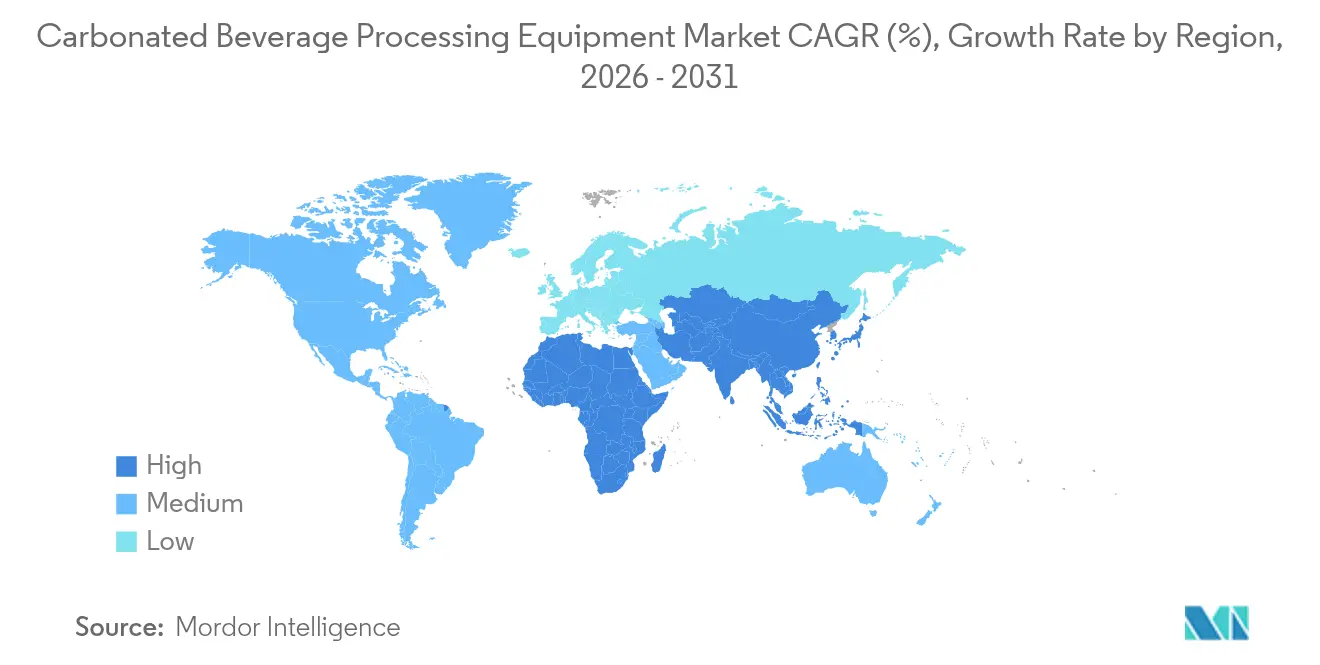
North America held 34.75% of global revenue in 2025, driven by retrofit programs replacing older fillers with servo-driven monoblocks that enable faster changeovers. Manufacturers have adopted energy-recovery systems and low-lubrication conveyors to meet corporate environmental, social, and governance (ESG) targets. The market growth continues through the craft-soda segment, which requires compact, easily configurable production lines, supporting aftermarket parts and service revenue.
Asia-Pacific is projected to achieve a 5.44% CAGR through 2031, leading global growth rates. Increasing disposable income, urbanization, and changing consumer preferences drive local companies to expand production capacity. Chinese and Indian manufacturers are adopting Western hygiene standards, creating opportunities for European equipment manufacturers to license designs for regional production. Government incentives support the adoption of heat-pump pasteurization systems that reduce greenhouse gas emissions.
Europe maintains steady growth as packaging regulations drive the adoption of lightweight bottles and tethered caps. Equipment updates emphasize quick-release filler valves and water recycling systems. Eastern European developments, including Krombacher's EUR 100 million bottling facility upgrade in November 2024, demonstrate regional manufacturers' commitment to expanding capacity while meeting EU carbon regulations. South America and the Middle East and Africa regions are investing in modular PET lines connected to solar-powered systems, indicating a direct transition to modern beverage production methods.
Regulatory Landscape
Food safety and hygiene compliance continues to shape equipment design, documentation, and validation requirements for carbonated beverage processing lines. In the United States, FDA Current Good Manufacturing Practice and hazard analysis requirements under 21 CFR Part 117 require equipment and utensils to be maintained and designed to be cleanable to prevent contamination and allergen cross-contact, which reinforces demand for validation-ready CIP, sanitary finishes, and traceable maintenance procedures.
In Europe, the regulatory environment is tightening on both machinery safety and materials used in food-contact components. The EU Machinery Regulation (EU) 2023/1230 replaces the Machinery Directive and becomes applicable from January 20, 2027, increasing compliance focus for digitally controlled and increasingly automated processing systems. In parallel, updates to EU food contact materials rules in 2026, including Commission Regulation (EU) 2026/245 (plastics FCM substance list updates) and Commission Regulation (EU) 2026/250 (transitional provisions related to Bisphenol A, including a market placement transition window until July 20, 2026 for certain single-use articles), raise material-selection and supplier-declaration requirements for seals, gaskets, linings, and plastic contact parts used across carbonation, blending, and filling equipment.
Value Chain Analysis
The value chain starts with upstream inputs such as stainless steel (notably hygienic grades used for wetted parts), elastomers and plastics for seals and hoses, instrumentation (flowmeters, pressure/temperature sensors), automation hardware (PLC/SCADA, servo drives), and utilities-facing subsystems (CIP skids, heat exchangers, refrigeration and compressed-air packages). Equipment OEMs and system integrators then design and assemble modular processing blocks (mixing, deaeration, carbonation, pasteurization, filtration) and integrate them with packaging line interfaces. Installation, commissioning, and qualification services (including sanitation documentation and recipe/OEE integration) are increasingly bundled.
Ongoing aftermarket services (spares, retrofit kits, calibration, and software updates for predictive maintenance) form a recurring layer for installed bases, particularly in North America where bottlers are upgrading existing lines for energy recovery, faster changeovers, and digital monitoring. Downstream, beverage producers and co-manufacturers deploy these systems in greenfield builds and capacity expansions, with logistics providers and local service partners supporting deployment and uptime. Recent capacity additions in Asia underscore how large bottlers pull the chain: in May 2026, Swire Coca-Cola inaugurated twin factories in Kunshan and Guangzhou with more than 20 production lines and total capacity exceeding 3.1 million tons per year, and in July 2026, Suntory PepsiCo opened a USD 300 million plant in Tay Ninh, Vietnam, with designed capacity up to 1.24 billion liters annually. Industry priorities highlighted in PMMI and FPSA's Processing State of the Industry 2026 report, such as hygienic-by-design equipment, AI-assisted inspection, and modular flexible systems, feed back into OEM design roadmaps, increasing demand for integrated controls, quicker change parts, and validated cleaning architectures.
Competitive Landscape
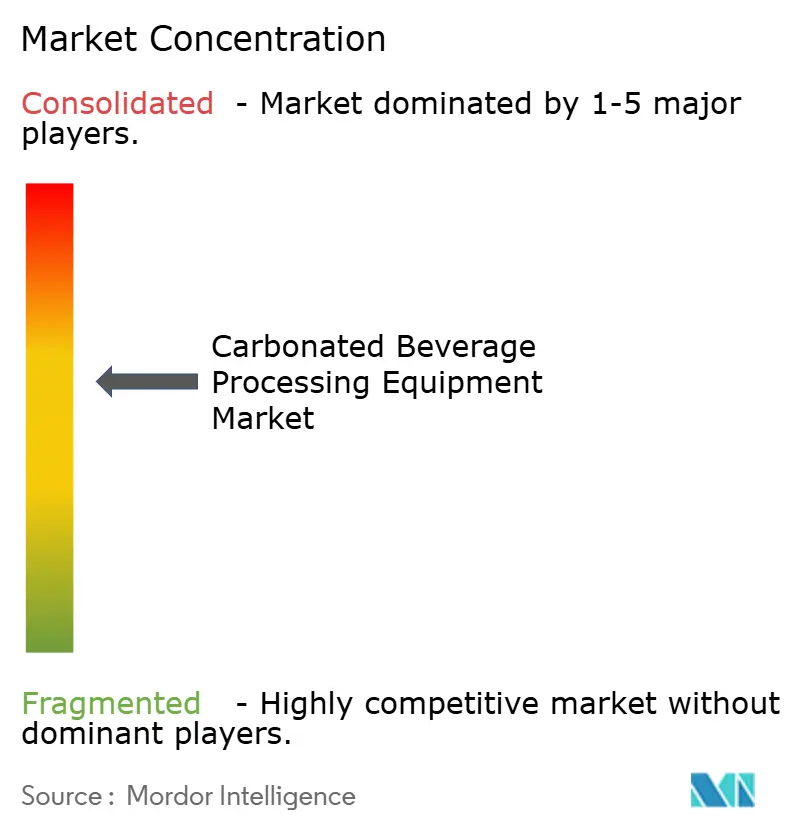
The market maintains moderate concentration, with major players like Krones AG, GEA Group AG, KHS GmbH, and Tetra Laval (Tetra Pak). Competing through comprehensive solutions, including turnkey operations, lifecycle service contracts, and digital platforms. Krones has enhanced its PET preform capabilities through the acquisition of Netstal, an injection molding technology company. GEA Group has specialized in hygienic valves and heat-pump pasteurization, offering carbon-footprint calculators to demonstrate customer cost savings.
Challenger companies focus on specialized technologies. Omnia Technologies has consolidated ACMI and SACMI Beverage into a high-speed bottling division, offering canning capabilities of 90,000 bottles per hour with 30% reduced energy consumption, launched in May 2024. Pentair targets sustainability-focused brewers and soda manufacturers through its gas-recovery technology. The expanding aftermarket for predictive maintenance upgrades has created opportunities for software companies to collaborate with original equipment manufacturers (OEMs), generating revenue from equipment data throughout the product lifecycle.
Competition has evolved from mechanical performance to comprehensive cost-of-ownership solutions that incorporate energy efficiency, operational uptime, and regulatory compliance. Companies establish regional technology centers to reduce service response times and conduct customer recipe testing. The carbonated beverage processing equipment market expansion is likely to drive increased merger activities, particularly in automation software and recyclable packaging technologies.
Carbonated Beverage Processing Equipment Industry Leaders
-
Krones AG
-
GEA Group AG
-
KHS GmbH
-
Tetra Laval (Tetra Pak)
-
Goma Engineering Pvt. Ltd
- *Disclaimer: Major Players sorted in no particular order
Market Opportunities and Future Outlook
Sustainability-led retrofits and greenfield builds are creating demand for equipment that reduces CO2, water, and energy intensity while maintaining carbonation control. Inline carbonation and thermal processing upgrades are increasingly specified with utilization and utilities metrics, as reflected in Alfa Laval's February 2026 CarboSet Mini launch targeting 95% to 99% CO2 utilization and Sidel's March 2026 launch of the SWING Evo tunnel pasteuriser, which uses a counterflow concept and states reductions of 10% in water usage and 35% in electricity. Early adoption is visible at large co-packers: Refresco commissioned the first Italian SWING Evo installation at its Sulmona facility in March 2026, supporting demand for measurable resource-efficiency improvements that can be replicated across multi-site networks.
A second opportunity is emerging at the processing and packaging interface, where producers are requesting flexible, modular lines that accommodate frequent SKU and format changes and support higher automation. PMMI/FPSA's 2026 industry report emphasis on modular, flexible systems and inspection automation aligns with equipment roadmaps that combine recipe-driven controls, faster changeovers, and predictive maintenance. In emerging markets, large-scale capacity additions and localization of supply chains are also increasing demand for turnkey projects and local service coverage, supported by major new beverage manufacturing investments such as Suntory PepsiCo's July 2026 Vietnam facility and multi-line expansions by bottlers. These projects increase the need for standardized line architectures, rapid commissioning capability, and lifecycle support contracts across multiple plants.
Recent Industry Developments
- May 2026: KHS Group expanded its Innopack Kisters Advanced series with the BottleClip Carrier, a cardboard carrying-handle solution for PET bottle multipacks, with the first unit slated for supply to the United States. The move targets packaging-line sustainability and material reduction goals, and it strengthens KHS positioning in end-of-line handling options that complement high-speed beverage operations.
- September 2025: KHS Group launched the InnoPET FreshSafe QuadBlock, integrating stretch blow molding, labeling, and filling with InnoPET Plasmax barrier technology to reduce CO2 loss in PET-packaged carbonated beverages. Integrated blocks shorten interfaces between major modules and can reduce footprint and transfer risks, supporting higher line efficiency for producers running multiple carbonated SKUs.
- March 2024: Krones AG completed the acquisition of Netstal, adding injection molding technology that supports PET preform production and strengthening Krones coverage across the PET bottle lifecycle. The expanded capability supports more vertically integrated offerings for beverage customers, spanning upstream container formation through downstream line integration and lifecycle services.
Research Methodology Framework and Report Scope
Market Definition and Coverage
This market covers equipment used to make carbonated beverages, starting from ingredient handling and mixing through carbonation and key thermal steps, measured as the value of equipment sold for carbonated beverage production lines and upgrades across regions.
Scope exclusions: Excludes packaging materials and finished beverage sales, and it also excludes equipment used only for still beverages unless it is installed as part of a carbonated line.
Segmentation Overview
- By Equipment Type
- Carbonation Systems
- Mixing and Blending Equipment
- Heat Exchangers
- Sugar Dissolution Systems
- Filtration and Clarification Equipment
- Other Equipment
- By Beverage Type
- Carbonated Soft Drinks (CSDs)
- Carbonated Functional Beverages
- Sparkling Water and Club Soda
- Carbonated Energy and Isotonic Drinks
- By Level of Automation
- Fully Automatic Processing Equipment
- Semi-Automatic Processing Equipment
- Manual or Batch-Scale Processing Equipment
- By Geography
- North America
- United States
- Canada
- Mexico
- Rest of North America
- Europe
- United Kingdom
- Germany
- Spain
- France
- Italy
- Russia
- Rest of Europe
- Asia-Pacific
- China
- India
- Japan
- Australia
- Rest of Asia-Pacific
- South America
- Brazil
- Argentina
- Rest of South America
- Middle East and Africa
- Saudi Arabia
- South Africa
- Rest of Middle East and Africa
- North America
Data Sources, Market Sizing, and Validation
Desk Research
Desk work starts with mapping how carbonated beverages are produced and what equipment is typically required at each processing step, and then we cross-check what is being installed in the field. We relied on public sources such as US Census Bureau manufacturing and trade tables, UN Comtrade import and export statistics, Eurostat industrial production series, FAO food and beverage indicators, and safety or process references from bodies such as the International Society of Beverage Technologists and similar association publications.
On the company side, we also reviewed filings, annual reports, investor presentations, product brochures, and credible press coverage to understand equipment replacement cycles, line upgrades, and automation shifts in plant operations. For structure and validation, we used paid subscriptions that support company financials and news screening, patent searches for process changes, and shipment-level trade views where they provide a useful check on equipment flows. These sources are illustrative only, and we also used other public datasets and documents to collect, cross-check, and clarify individual data points.
Primary Interviews and Surveys
Primary work was used to confirm what buyers actually procure when they expand carbonation capacity, and how spending is split across mixing, carbonation, and heat exchange related assets. We spoke with a mix of equipment makers, system integrators, plant engineering teams, and operations leaders across major producing regions, so the assumptions from desk research could be challenged and refined to match buying and replacement behavior seen at the site level.
Distribution of primary research fieldwork respondents
| Company type | Respondent position | Region |
|---|---|---|
| Top tier: 36% | CXOs: 15% | APAC: 41% |
| Mid tier: 42% | Functional/Unit leaders: 33% | EMEA: 34% |
| Smaller Players: 22% | Managers: 52% | Americas: 25% |
Market-Sizing & Forecasting
Market size is constructed using a top-down approach where carbonated beverage production and trade signals are used to rebuild the demand pool for processing lines, and that demand pool is then converted into equipment spending using typical line configurations. To keep the totals realistic, we then corroborate the output with selective bottom-up approximations, such as sampled line budgets, channel checks with integrators, and a volume by average selling price build for a few core equipment groups.
Key inputs that shape the model include carbonated beverage output trends by region, new plant and line expansion activity, replacement and retrofit cycles, automation penetration in processing steps, and energy and water efficiency upgrades that trigger heat exchanger or system redesign purchases. We also track how product mix is shifting toward sparkling water and functional carbonated drinks, since those often change mixing and blending requirements.
For forecasting, scenario analysis is used around capex cycles and beverage demand, and the final trajectory is aligned to what interviewees expect for new line projects and retrofit intensity. Where bottom-up inputs are thin for smaller geographies, assumptions are bridged using regional analogs and equipment intensity ranges, and then re-checked against import patterns and reported installation activity.
Data Validation & Update Cycle
Numbers are validated through repeated checks across independent signals, including trade movements for relevant equipment categories, reported plant investments, and consistency of implied equipment intensity per unit of beverage capacity. Any sharp jumps are reviewed, and the drivers are re-tested through follow-up questions before the final model is signed off through multi-step internal review.
Reports are refreshed annually, and interim updates are triggered when material events occur, such as major capex announcements, regulatory changes affecting process design, or sudden cost swings that can shift equipment budgets. Before delivery, a final review pass is completed so clients receive the latest updated view, with assumptions that are still traceable and easy to explain.
Mordor Intelligence's Carbonated Beverage Processing Equipment Market Sizing Compared With Other Published Estimates
It is normal to see different market size numbers for this space because publishers do not always count the same equipment boundary, and they can anchor the model to different demand signals and base years. Some studies lean more on stated revenue pools, while others rebuild demand from production capacity and then apply spending ratios, which changes the total even when the topic name looks identical.
Installed line announcements, import patterns for core processing equipment, and buyer-validated replacement cycles are the checks that keep Mordor Intelligence tied to a processing-only equipment scope (mixing, carbonation, and thermal steps), instead of folding in adjacent packaging assets or broader beverage machinery totals. Differences also show up when one estimate uses a 2024 base, another uses 2025, and when currency timing and assumed ASP progression are handled differently over the forecast window.
Benchmark comparison
| Source | Market Size | Gaps in Research Methodology |
|---|---|---|
| Mordor Intelligence | USD 7.55 B (2025) | |
| Global Consultancy A | USD 8.38 B (2025) | Uses a wider equipment interpretation that can pull in more processing steps and line items beyond the core carbonation processing train, and applies a higher growth case for capex intensity through 2031. |
| Trade Journal B | USD 5.53 B (2024) | Anchors the series to a 2024 base and emphasizes reported revenue and shipments, which can under-count retrofit activity and installed base upgrades that do not show up evenly in shipment-led views. |
Taken together, the spread is mainly explained by scope boundaries, base year choice, and how spending per line is converted from real-world capacity signals. Our approach stays transparent, since the sizing steps can be traced back to production and investment indicators, and then adjusted using buyer and supplier feedback when assumptions drift.
Key Questions Answered in the Report
What is the current size of the carbonated beverage processing equipment market?
The market is valued at USD 7.87 billion in 2026 and is forecast to reach USD 9.67 billion by 2031.
Which equipment type holds the largest market share?
Carbonation systems command 34.85% revenue share due to their pivotal role in product quality control.
Why are fully automatic lines growing fastest?
They deliver higher uptime, lower labor costs, and energy savings, which translate into a 5.55% CAGR through 2031.
Which region is expanding most rapidly?
Asia-Pacific is projected to post a 5.44% CAGR as urbanization and income growth boost soft-drink demand.