
Carbon Fiber Tape Market Size and Share
Market Overview
| Study Period | 2020 - 2031 |
|---|---|
| Market Size (2026) | USD 2.83 Billion |
| Market Size (2031) | USD 3.81 Billion |
| Growth Rate (2026 - 2031) | 6.08 % |
| Fastest Growing Market | Asia Pacific |
| Largest Market | Asia Pacific |
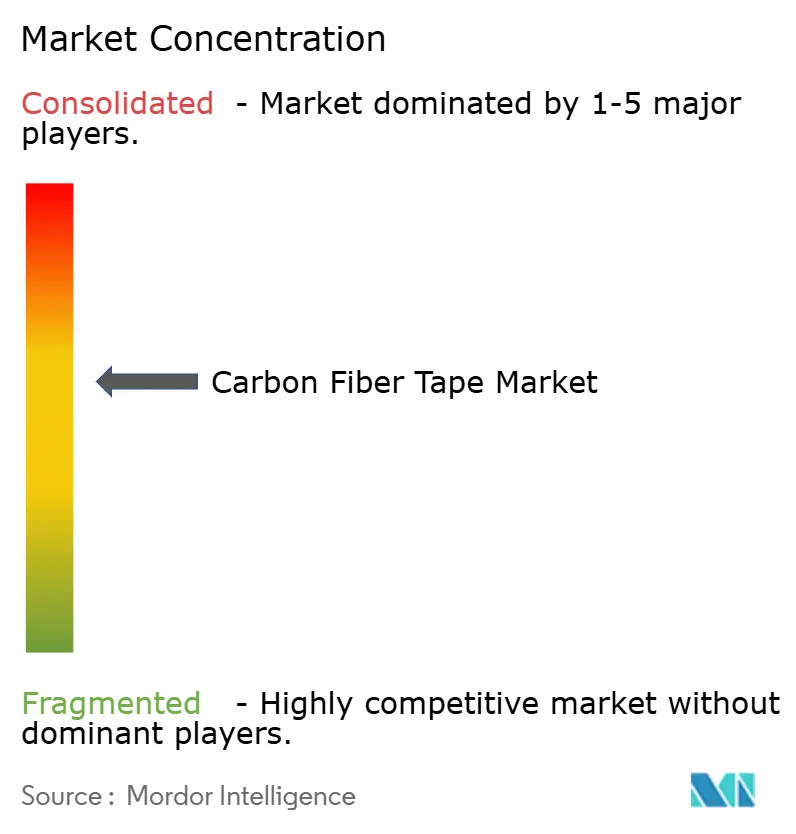
| Market Concentration | Medium |
Major Players *Disclaimer: Major Players sorted in no particular order Image © Mordor Intelligence. Reuse requires attribution under CC BY 4.0. | |
Carbon Fiber Tape Market Analysis by Mordor Intelligence
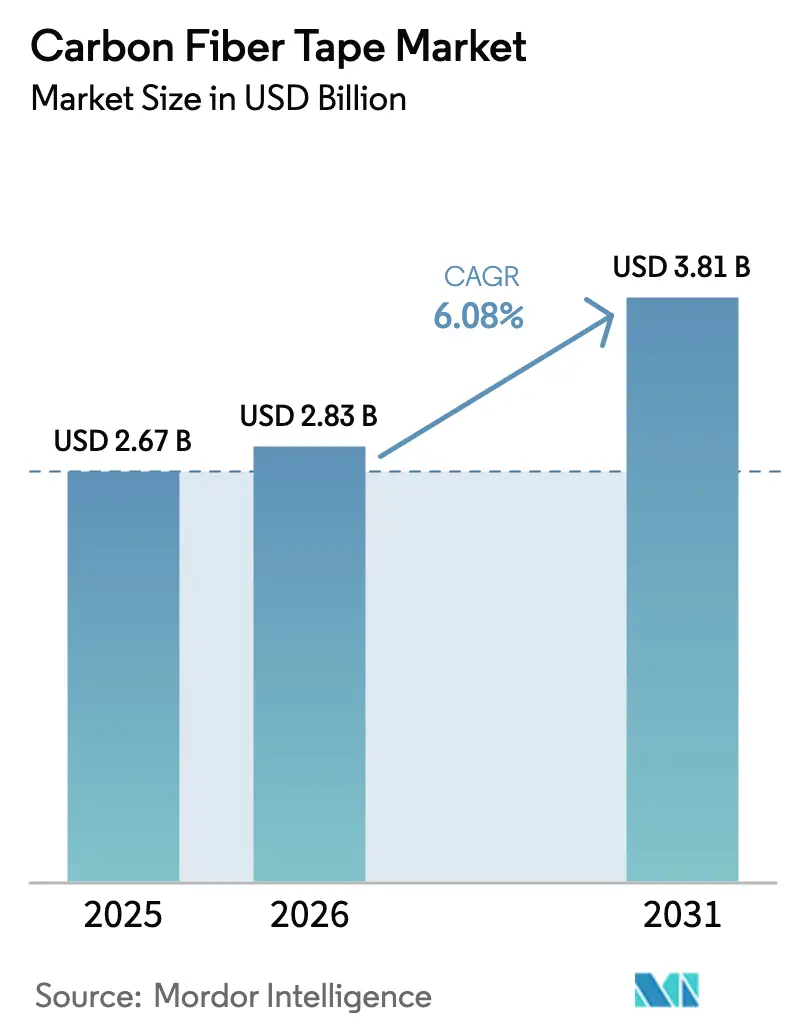
The Carbon Fiber Tape market size is expected to grow from USD 2.67 billion in 2025 to USD 2.83 billion in 2026 and is forecast to reach USD 3.81 billion by 2031 at 6.08% CAGR over 2026-2031. The outlook is anchored in the aerospace sector’s continuing transition from aluminum to composites, the scale-up of next-generation single-aisle programs, and the rapid diffusion of automated fiber placement systems that favor tape formats for speed and lay-up accuracy. Hot-melt prepreg processes are expanding because they combine precise resin control with solvent-free operations, while wind-turbine blade lengthening and cryogenic hydrogen storage provide fresh volume opportunities. Supply-side strategies now hinge on vertical integration to manage precursor volatility and on rapid qualification pathways that shorten time-to-market for thicker laminates.
Key Report Takeaways
- By type, prepreg tape captured 63.45% of the carbon fiber tape market share in 2025, while dry tape posted the fastest 6.72% CAGR through 2031.
- By resin type, epoxy accounted for the largest share of 48.75% in 2025; while other resin types posted the fastest CAGR of 6.85% through 2031.
- By manufacturing process, hot-melt prepreg accounted for 51.25% of the carbon fiber tape market size in 2025 and is projected to grow at 6.68% CAGR to 2031.
- By end-user industry, the aerospace and defense segment held 52.10% revenue share of the carbon fiber tape market in 2025 and is advancing at a 6.89% CAGR through 2031.
- By region, Asia-Pacific led with 36.40% share of the carbon fiber tape market size in 2025, and the region is set to expand at 6.57% CAGR over the forecast period.
Note: Market size and forecast figures in this report are generated using Mordor Intelligence’s proprietary estimation framework, updated with the latest available data and insights as of 2026.
Market Trends and Insights
Drivers Impact Analysis of Carbon Fiber Tape Market*
| Driver | (~) % Impact on CAGR Forecast | Geographic Relevance | Impact Timeline |
|---|---|---|---|
| Surging aerospace demand for lightweight primary structures | +1.8% | Global; North America & Europe | Medium term (2-4 years) |
| Ramp-up of next-gen single-aisle aircraft production | +1.5% | Global; North America & Europe | Short term (≤ 2 years) |
| Automotive shift to carbon fiber reinforced plastics for EV range extension | +1.2% | Global; Asia-Pacific & Europe | Long term (≥ 4 years) |
| Wind-turbine blade lengthening needs high-modulus tapes | +0.9% | Global; Europe & Asia-Pacific | Medium term (2-4 years) |
| Cryogenic hydrogen tank winding for zero-carbon aviation | +0.7% | Global; Europe & North America | Long term (≥ 4 years) |
| Source: Mordor Intelligence | |||
Surging Aerospace Demand for Lightweight Primary Structures
Commercial and defense airframers are replacing metallic wing spars, fuselage skins, and floor beams with carbon fiber tape lay-ups that deliver durability alongside 20% weight savings, a metric validated by the Boeing 787 and Airbus A350 programs[1]. Automated fiber placement cells amplify demand because they require uniform tape widths and consistent tack to achieve high deposition rates without defects. NASA’s HiCAM initiative, which pairs Toray’s carbon fiber with rapid-cure prepregs, exemplifies how public-private research is compressing cycle times for wide-body and single-aisle structures. As qualification datasets mature, more primary structures migrate to tape-based designs, securing long-run growth for certified suppliers.
Ramp-up of Next-Gen Single-Aisle Aircraft Production
Airbus and Boeing have committed to double-digit monthly build-rates for the A320neo and 737 MAX families. These narrow-body programs consume large volumes of secondary and interior composite parts that are increasingly manufactured from tape because of its predictable fiber orientation and minimal material wastage. Equipment provider MTorres has introduced dry-fiber tape formats that enable producers to infuse resin in-house, cutting raw material costs by up to 50% while safeguarding mechanical performance. With total carbon fiber consumption in commercial aerospace projected to climb from 16,500 t in 2021 to 29,100 t by 2026, tape is positioned as the dominant intermediate form feeding the supply chains of tier-1 and tier-2 suppliers.
Automotive Shift to Carbon Fiber Reinforced Plastics for EV Range Extension
Battery packs add substantial mass to electric vehicles, prompting automakers to adopt carbon fiber tape in body-in-white, roof, and door architectures to reclaim driving range. Tesla’s Model S Plaid and BMW’s high-end EV lines already integrate composite panels that slash component mass by 40–50% relative to aluminum. Regulatory support in Europe following the withdrawal of proposed carbon fiber restrictions safeguards the material’s availability for mass-market adoption. Thermoplastic tape variants that allow over-molding and recycling appeal to high-volume plants, while large-tow grades keep cost curves within automotive targets.
Wind-Turbine Blade Lengthening Needs High-Modulus Tapes
Onshore and offshore turbines above the 10 MW class deploy blades exceeding 100 m length; spar caps reinforced with high-modulus carbon fiber tape supply the stiffness needed to avoid tower strikes under gust loading. LM Wind Power’s 88.4 m prototype showed that hybrid carbon-glass caps trimmed mass while meeting fatigue criteria. The U.S. Department of Energy later confirmed that heavy-tow carbon fiber can lower overall blade weight by 25%, easing transport and installation[2]. Volume requirements in wind create attractive scale for mid-grade tape producers, nudging the supply base to expand pultrusion and unidirectional tape output.
Restraints Impact Analysis of Carbon Fiber Tape Market*
| Restraint | (~) % Impact on CAGR Forecast | Geographic Relevance | Impact Timeline |
|---|---|---|---|
| High precursor and processing costs | -1.4% | Global; cost-sensitive markets | Short term (≤ 2 years) |
| Feedstock price and energy-cost volatility | -0.8% | Global; Asia-Pacific manufacturing hubs | Medium term (2-4 years) |
| Regulatory qualification bottlenecks for thick laminates | -0.6% | Global; aerospace applications | Long term (≥ 4 years) |
| Source: Mordor Intelligence | |||
High Precursor and Processing Costs
Polyacrylonitrile accounts for half to three-quarters of finished fiber price, and the multi-stage oxidation/carbonization route is power intensive, leaving producers exposed to energy spikes. Market prices average USD 15 kg for industrial grades and exceed USD 85,000 t for aerospace classes, levels that restrain penetration into cost-sensitive sectors such as standard-range passenger cars. Research at the University of Limerick demonstrated microwave carbonization that could cut energy use by 70%, but commercialization remains distant. Until lignin-based or other low-cost precursors reach scale, tape producers must pursue incremental process yields and vertical integration to manage margin compression.
Feedstock Price and Energy-Cost Volatility
Spot carbon fiber prices in China dropped from USD 33 kg in 2022 to USD 18 kg in 2024 as surplus capacity met soft demand, underscoring the material’s vulnerability to cyclical swings. Because furnaces run at 1,000 °C +, electricity price increases immediately erode margins, especially in Asia-Pacific clusters where power tariffs can vary widely. Producers are relocating or adding furnaces in regions with low-carbon, low-cost grids to stabilise operating economics and hedge geopolitical risks highlighted by recent supply chain disruptions.
*Our forecasts treat driver/restraint impacts as directional, not additive. The impact forecasts reflect baseline growth, mix effects, and variable interactions.
Carbon Fiber Tape Market Segment Analysis
By Type:
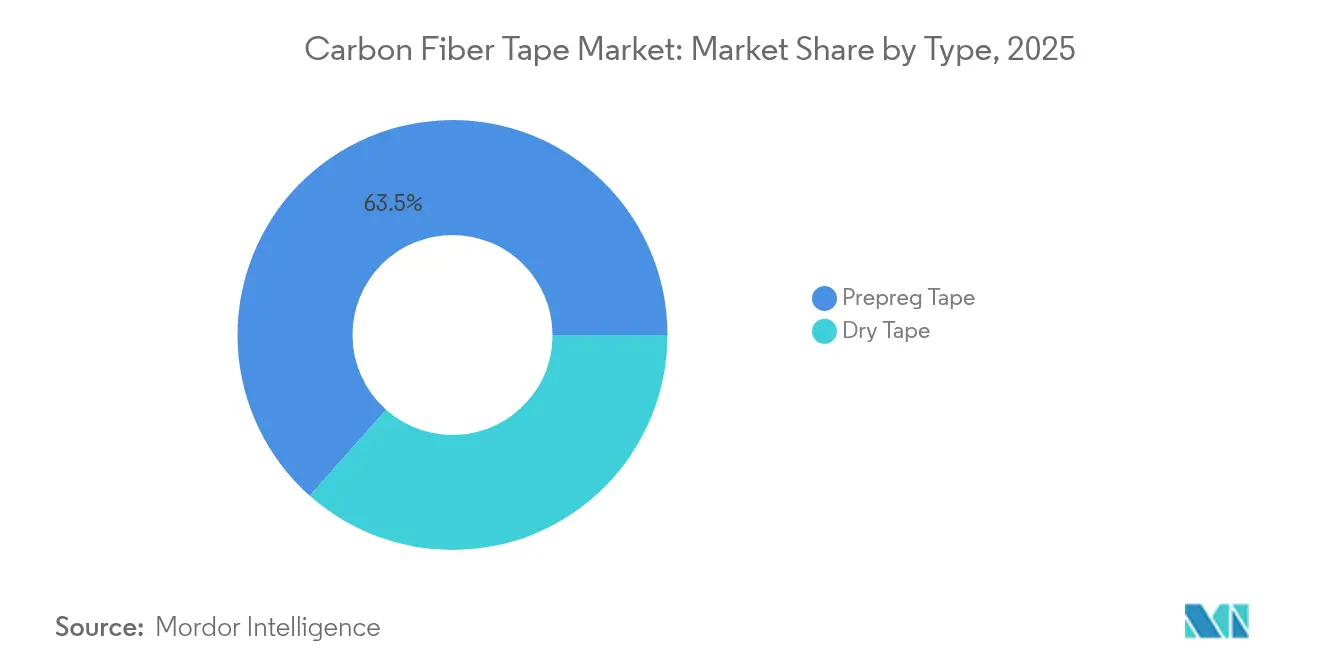
Prepreg Dominance Drives Quality StandardsPrepreg variants held 63.45% carbon fiber tape market share in 2025 because they deliver uniform resin content, stable tack, and predictable cure profiles that aerospace primes specify for primary structures. Dry tape, in contrast, posted a leading 6.72% CAGR and is gaining acceptance as automated fiber placement systems mature and as tier-1 suppliers appreciate the logistics benefits of ambient storage. The cost differential widens as high-volume programs exploit in-line resin infusion, positioning dry tape as the economical alternative for secondary parts.
Prepreg’s foothold is defended by refinements such as extended out-time and tougher resin chemistries that raise damage tolerance in thicker laminates. However, dry tape vendors answer with proprietary sizing agents that enhance resin wet-out and with slit-tape formats down to 3 mm that allow precise steering around tight radii. Tape lines that can switch between prepreg and dry, depending on order mix, provide supply flexibility coveted by vertically integrated producers serving both aerospace and wind customers.

By Resin Type:
Epoxy Leadership Faces Thermoplastic ChallengeEpoxy systems constituted 48.75% of global volume in 2025, reflecting decades of certification data and proven performance at service temperatures up to 120 °C. Their dominance also mirrors well-developed supply networks that support just-in-time deliveries to both tier-1 and tier-2 aerospace fabricators. The “other resins” basket, which includes thermoplastic families such as PEEK and PPS, is expanding at 6.85% CAGR as automotive and hydrogen tank applications require fast processing and recyclability.
Epoxy suppliers continue to engineer fracture-toughened grades and snap-cure formulations that can be out-of-autoclave processed. Thermoplastic innovators respond with lower-melt-viscosity matrices that facilitate consolidation at sub-400 °C and with carbon-fiber-reinforced unidirectional tapes suitable for over-molding into hybrid structures. Polyamide and vinyl ester occupy niche marine and chemical containment roles, while bio-based options remain pre-commercial but are attracting automotive OEM pilots that seek end-of-life circularity.
By Manufacturing Process:
Hot-Melt Prepreg Balances Performance and EfficiencyHot-melt lines delivered 51.25% revenue share in 2025 and are expected to advance 6.68% CAGR through 2031. Because resin is applied as a molten film, volatile emissions are eliminated, and resin/fiber ratio accuracy reaches ±1%, an advantage for design allowables. The process also aligns with fully enclosed, digitalised production cells that capture process parameters needed for aerospace traceability.
Solvent dip routes continue where legacy chemistries require, for instance high-temperature polyimide matrices. Resin transfer infusion grows fastest in large wind or marine structures, where lengthy flow paths can be accommodated in modular molds. Breakthroughs such as lignin-precursor carbon and multifunctional tapes that double as current collectors or structural batteries signal future disruption as they mature beyond laboratory scale.
By End-User Industry:
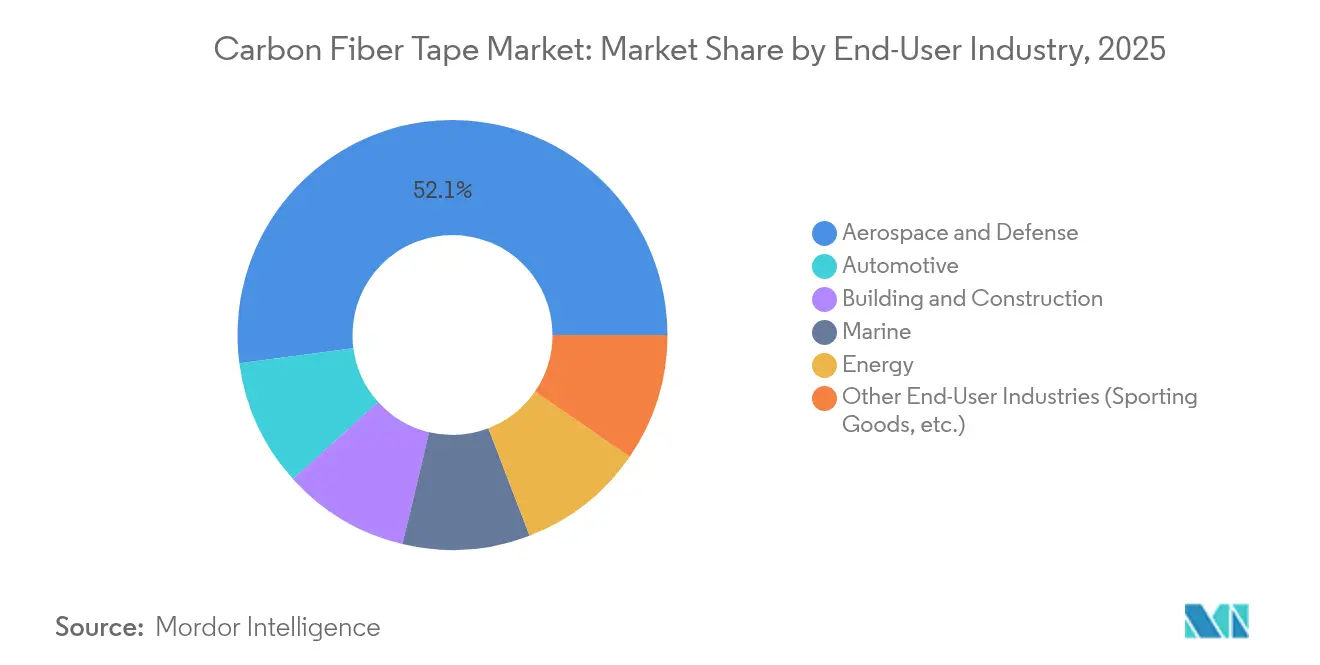
Aerospace Dominance Extends Across Growth MetricsThe aerospace and defense community consumed 52.10% of global tonnage in 2025 and is accelerating at 6.89% CAGR, sustained by single-aisle production ramps and stealth platform refresh programs. Price premiums remain acceptable because every kilogram removed can yield fuel savings over an aircraft’s 20-year life. Automotive ranks a distant second but is moving quickly as EV platforms demand lighter bodies to offset battery packs. Wind energy is the volume wildcard: each incremental meter of blade length requires significantly more spar cap material, and carbon tape’s high modulus prevents deflection-induced tower strikes. Construction interest is nascent yet tangible, especially for seismic-retrofit wraps and prefabricated façade elements where weight savings simplify installation. Marine adoption continues in performance yachts and crew transfer vessels, while sporting goods remain a profitable but relatively small slice.
Geography Analysis
APAC Carbon Fiber Tape Market
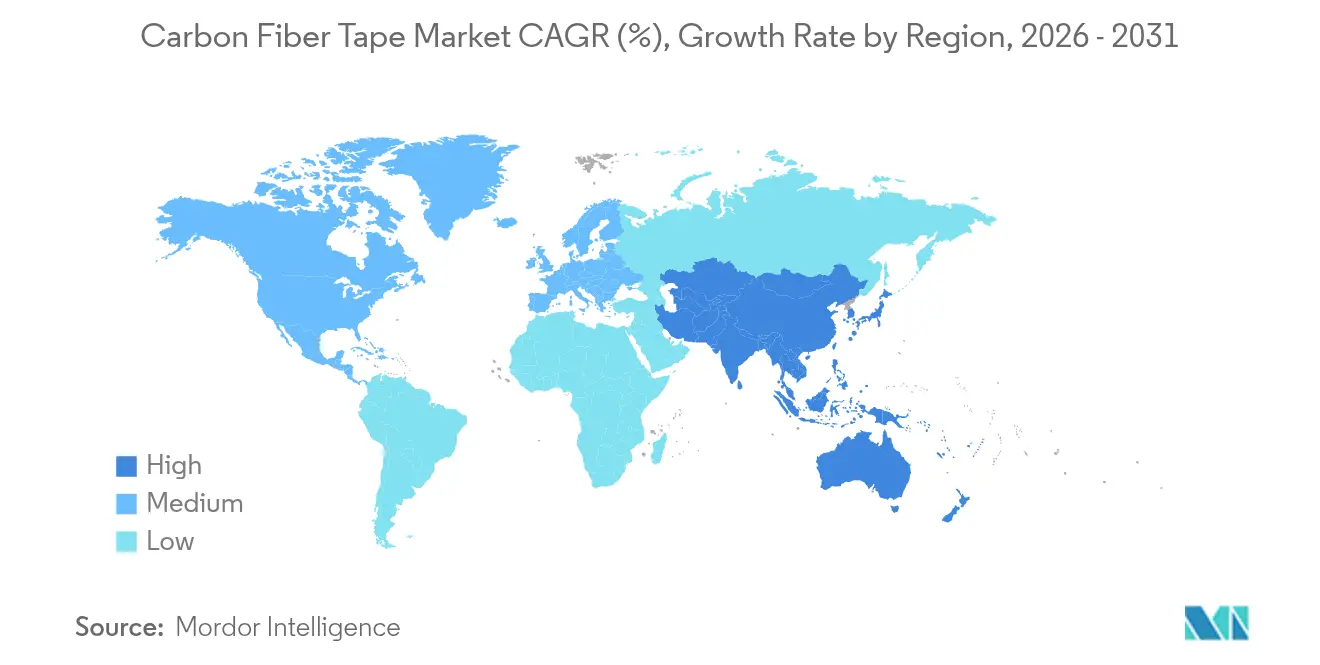
Asia-Pacific held 36.40% carbon fiber tape market size in 2025 thanks to the intersection of large-scale fiber production in China, robust wind-turbine build-out, and growing domestic aerospace programs. The region’s 6.57% CAGR reflects government incentives for renewable capacity and state-sponsored aircraft such as COMAC’s C919, which adopt significant composite content. Japanese players Toray and Mitsubishi anchor high-performance fiber output, while South Korean and Indian firms scale mid-grade capacities to service regional mobility and energy demand.
North America and Europe Carbon Fiber Tape Market
North America follows closely, underpinned by Boeing’s assembly lines, a resilient defense budget, and federal funding into hydrogen-powered flight demonstrators. The United States also hosts many automated fiber placement technology suppliers, giving regional converters first access to next-generation deposition heads. Canada leverages a cluster of tier-2 aerospace fabricators, and Mexico emerges as a cost-competitive site for automotive composite parts shipped into U.S. OEMs. Europe commands balanced demand across aerospace, premium automotive, and wind energy. The EU’s supportive stance on carbon composites, reaffirmed after the shelved restriction proposal, sustains adoption in both road and aviation segments. Germany’s OEMs lead vehicle integration projects; the United Kingdom and France anchor wide-body airframe expertise; and Spain’s coastal corridor benefits from large offshore wind deployments. Nordic nations inject momentum through aggressive renewable targets that mandate ever-larger blades, while Eastern Europe offers competitive labor for composite component assembly.
Regulatory Landscape
Carbon fiber tape sold into certified aerospace structures is governed more by qualification and quality-system requirements than by product-specific legislation, which makes standards bodies and OEM allowables central to market access. SAE International continues to update aerospace materials specifications used for procurement and conformance, including carbon-fiber-tape and prepreg-related purchasing specifications (for example, updates published through 2026). The aerospace supply chain commonly requires AS9100 quality management certification for manufacturers and converters supplying flight-critical composite intermediates.
Trade and sustainability policy also shape sourcing and end-market acceptance. In May 2024, the United States confirmed Section 301 tariff increases on selected China-origin products with phased schedules, reinforcing the need for procurement teams to manage classifications and cross-border sourcing risk for composite supply chains. In Europe, policy attention to end-of-life handling of composite materials continues through bodies such as the European Composites Industry Association (EuCIA) and the Japan Carbon Fiber Manufacturers Association (JCMA). These groups have engaged on the EU End-of-Life Vehicles (ELV) Directive to help avoid carbon fiber being treated as a restricted substance in automotive applications, while manufacturers increasingly align environmental management with ISO 14001 to manage energy intensity and emissions controls in fiber and tape production.
Value Chain Analysis
The value chain starts with upstream feedstocks and fiber production, then moves through conversion into tape formats and downstream component manufacturing. Polyacrylonitrile (PAN) precursor and energy-intensive carbonization influence the economics of virgin carbon fiber supply. A relatively small number of global fiber producers sell to tape makers and prepreggers that slit, spread, and impregnate fibers with thermoset (notably epoxy) or thermoplastic matrices using hot-melt, solvent dip, or other impregnation routes. Tape is then consumed by converters and OEM supply chains using Automated Tape Laying (ATL) and Automated Fiber Placement (AFP) to produce aerospace structures, wind spar caps, automotive parts, and emerging pressure-vessel and hydrogen storage laminates.
Integration and qualification are structural features of the chain. Vertically integrated models, led by major carbon fiber and composites groups, reduce exposure to precursor volatility and streamline traceability demanded by aerospace programs. Downstream adoption is also constrained by qualification datasets and process capability, including tack control, resin content consistency, and defect detection. A separate sustainability pathway is forming around recycled carbon fiber (rCF) tapes, where mechanical recycling, carding, and thermo-fixation steps are being developed to produce lower-cost intermediates for non-flight-critical uses. This creates a secondary feedstock loop that can sit alongside virgin-fiber tape for automotive and industrial applications.
Competitive Landscape
The carbon fiber tape market is moderately consolidated around a handful of vertically integrated groups. Toray Industries, Hexcel Corporation, and SGL Carbon maintain closed-loop control from precursor through finished tape, enabling tight quality governance and cost visibility. Second-tier specialists such as Gurit and NTPT focus on ultra-thin tape slitting, serving luxury goods and sporting equipment where aesthetics and lay-up precision command premiums.
Leading suppliers differentiate via process automation, with multiple firms investing in high-speed slitters, laser steering, and in-line ultrasonic inspection that detects gaps or overlaps below 0.3 mm. Hexcel’s continuous-tow placement portfolio exemplifies how equipment and material portfolios combine into turnkey offerings attractive to airframe primes. Toray has introduced porous carbon fiber variants that open hybrid markets in filtration and energy storage, illustrating how core technology can spin out adjacencies.
Cost discipline is equally strategic. SGL Carbon and Chinese challengers are experimenting with lignin and pitch precursors to cut variable cost, while resin formulators push snap-cure systems that lower autoclave time by 30%. Certification datasets collected over decades remain potent entry barriers; newcomers must finance extensive allowables programs before becoming Airbus or Boeing qualified. Consequently, partnership models—material supplier plus design-build specialist plus OEM—are gaining favor, allowing risk-sharing while accelerating qualification.
Carbon Fiber Tape Industry Leaders
-
Solvay
-
Hexcel Corporation
-
TORAY INDUSTRIES, INC,
-
SABIC
-
Teijin Limited
- *Disclaimer: Major Players sorted in no particular order
Carbon Fiber Tape Market Companies Covered in this Report
- Axiom Materials
- Cevotec
- Chomarat
- Evonik Industries AG
- Gurit Services AG, Zurich
- Hexcel Corporation
- ITECMA
- McLAREN
- MITSUBISHI GAS CHEMICAL COMPANY, INC.
- NTPT (North Thin Ply Technology)
- Owens Corning
- Porsche
- SABIC
- SGL Carbon
- Solvay
- TCR Composites, Inc.
- Teijin Limited
- TORAY INDUSTRIES, INC.
- Victrex plc
Market Opportunities and Future Outlook
Thermoplastic unidirectional (UD) tape systems represent a clear whitespace where suppliers are building capability to meet high-rate manufacturing needs across aerospace, automotive, and hydrogen storage. A relevant indicator of this shift is Toray Advanced Composites expanding its continuous fiber thermoplastic composite tape footprint in the United States (Morgan Hill, California, announced in November 2024) and scaling capacity in Japan (Mishima expansion adding 500 tonnes per year in February 2025). Teijin Carbon has also emphasized automated layup compatibility and lower-footprint offerings, highlighted by the Tenax Next HTS45 E23 24K tape presented at JEC World 2025, which aligns tape formats with ATL/AFP productivity targets.
Opportunity also centers on shortening qualification lead times and broadening the qualified material set for automated manufacturing, particularly for high-performance thermoplastic matrices used in aerospace-grade components. As more material systems obtain recognized qualification packages, procurement and design teams can move faster from development to production across tier-1 and tier-2 supply chains, supporting tape demand beyond traditional epoxy prepregs. In parallel, hydrogen pressure vessels and cryogenic tank architectures are pulling tape suppliers toward tougher, high-fiber-volume UD products and processing routes that fit industrial cycle times, strengthening the case for regional production hubs in North America, Europe, and Asia-Pacific to support more localized sourcing and reduce supply chain risk.
Recent Industry Developments in Carbon Fiber Tape Market
- May 2026: Toray Advanced Composites expanded NCAMP qualifications for its Cetex TC1225 LMPAEK thermoplastic composite system to include TC1225/TORAYCA T700 unidirectional tape prepreg. The added qualification coverage strengthens the material set available for aerospace automated layup and reduces adoption friction for programs that depend on recognized allowables and traceability.
- February 2026: Toray Composite Materials America achieved NCAMP qualification for its 3960 prepreg system featuring TORAYCA T1100 intermediate modulus carbon fiber. The qualification supports faster insertion of a next-generation prepreg system into aerospace and defense supply chains where material acceptance hinges on standardized qualification data.
- November 2024: Toray Advanced Composites expanded its continuous fiber-reinforced thermoplastic composite tape capacity and capabilities by acquiring Gordon Plastics assets, technology, and intellectual property in Englewood, Colorado. This move added manufacturing and know-how to support regional supply resilience and scaled output for thermoplastic tape applications using automated processing routes.
Carbon Fiber Tape Market Report Scope and Research Methodology
Market Definition and Coverage
This market covers the revenues generated from carbon fiber tapes sold as intermediate composite materials, including both prepreg and dry tape forms, which are supplied into manufacturing flows across major end uses worldwide.
Scope exclusions: We exclude finished composite parts and assemblies where tape is only an input, as well as maintenance services and tooling revenue.
Segments Covered in This Report
- By Type
- Prepreg Tape
- Dry Tape
- By Resin Type
- Epoxy
- Polyamide
- Vinyl Ester
- Polyurethane
- Other Resin Types (Thermoplastic (PEEK, PPS), etc.)
- By Manufacturing Process
- Hot-Melt Prepreg
- Solvent Dip
- Automated Fiber Placement (AFP)
- Resin Transfer Infusion
- By End-user Industry
- Aerospace and Defense
- Automotive
- Building and Construction
- Marine
- Energy
- Other End-User Industries (Sporting Goods, etc.)
- By Geography
- Asia-Pacific
- China
- Japan
- India
- South Korea
- ASEAN Countries
- Rest of Asia-Pacific
- North America
- United States
- Canada
- Mexico
- Europe
- Germany
- United Kingdom
- France
- Italy
- Spain
- Russia
- NORDIC Countries
- Rest of Europe
- South America
- Brazil
- Argentina
- Rest of South America
- Middle East and Africa
- Saudi Arabia
- South Africa
- Rest of Middle East and Africa
- Asia-Pacific
Data Sources, Market Sizing, and Validation
Desk Research
For the first cut of the model, we built a clear picture of demand pools and supply constraints using public sources that can be checked line by line. Useful reference points came from aerospace delivery and fleet statistics from official aviation bodies, wind installation statistics from energy agencies, and manufacturing and trade time series from government statistical offices.
To keep assumptions grounded, we also reviewed customs and trade data releases, patent databases to track tape processing and resin-system activity, and peer-reviewed materials journals that describe adoption and performance tradeoffs. Company annual reports, investor presentations, and press releases were used to understand capacity moves, product positioning, and exposure by end market. We also used paid subscriptions focused on company financials and intelligence, plus shipment-level import and export data where it was available for cross-checking. These desk research inputs are illustrative rather than exhaustive, and additional public sources were reviewed during data collection, validation, and clarification.
Primary Interviews and Surveys
Primary work focused on validating what really shipped and what was actually consumed, because tape demand can shift with build rates and qualification timelines. We spoke with raw material participants, tape converters, and downstream manufacturing stakeholders, then stress-tested key assumptions with buyers and technical decision-makers across APAC, EMEA, and the Americas.
Distribution of primary research fieldwork respondents
| Company type | Respondent position | Region |
|---|---|---|
| Top tier: 25% | CXOs: 19% | APAC: 42% |
| Mid tier: 55% | Functional/Unit leaders: 40% | EMEA: 33% |
| Smaller Players: 20% | Managers: 41% | Americas: 25% |
Market-Sizing & Forecasting
Sizing was started using a top-down approach where end-market activity and material intensity were used to reconstruct tape demand, and then value was formed using realistic average selling price ranges by tape type and resin family. For example, aerospace build rates, wind blade production trends, and lightweighting programs were translated into expected tape consumption, then scrap factors and qualification lead times were applied where relevant.
After that demand pool was formed, we corroborated totals with selective bottom-up checks, including rolling up a sampled set of supplier revenues, channel checks on lead times, and volume times ASP sanity tests for high-visibility applications. Inputs that mattered most included aircraft and engine production rates, wind capacity additions and blade length trends, automotive composite penetration in selected platforms, resin price movements that affect tape ASPs, and announced capacity expansions with utilization ramp assumptions. When bottom-up signals were incomplete, gaps were handled using conservative penetration bands and then narrowed based on interview feedback.
For forecasting, scenario analysis was used to reflect different adoption speeds in aerospace and energy, while keeping the logic traceable. Growth paths for the main inputs were aligned to expert consensus ranges, and the resulting market trajectory was checked to stay consistent with capacity, qualification cadence, and price normalization expectations.
Data Validation & Update Cycle
Outputs were checked through multiple passes so that unusual changes in volume, ASP, or regional mix were flagged early and explained before sign-off. We compared results against independent signals such as end-market production trends, trade flow direction, and capacity announcements, then revisited assumptions if the model drifted away from those markers.
A second analyst review was completed to confirm formulas, unit conversions, and currency timing. Where variances stayed unresolved, we completed targeted re-contact with sources. The report is refreshed annually, and interim updates are made when a material event changes supply, demand, or pricing. Before delivery, the latest public releases and trade-relevant news are rechecked so clients receive an up-to-date view.
Mordor Intelligence's Carbon Fiber Tape Market Estimate Compared With Other Published Estimates
Published market sizes for carbon fiber tape often do not match, even when they use the same currency, because the scope boundary and pricing logic can vary in small but important ways. Differences typically come from whether the estimate counts only tape sales or also includes part-level composite revenues, how prepreg versus dry tapes are treated, and which end uses are assumed to be qualified and in volume production.
By tracking qualification-linked consumption signals and refreshing currency timing assumptions, Mordor Intelligence keeps the 2026 value tied to tape revenues only, rather than blending in finished composite part sales or large ASP step-ups that may not hold consistently across regions.
Benchmark comparison
| Source | Market Size | Gaps in Research Methodology |
|---|---|---|
| Mordor Intelligence | USD 2.83 B (2026) | |
| Global Research Publisher A | USD 3.60 B (2025) | Uses a 2024 base with a fast growth path that can overstate near-term adoption, and the scope language leans toward broader tape usage assumptions in automotive and aerospace without clearly separating qualification timing. |
| Industry Publisher B | USD 4.08 B (2026) | The estimate is built as a forward-looking 2026 value with high expected expansion, and it appears to rely on broader end-use inclusion and higher implied price progression, which can lift totals versus tape-only revenue modeling. |
The spread across sources is mainly explained by what gets counted as market revenue and how quickly adoption and pricing are assumed to move. When scope stays focused on tape sales and the inputs are tied back to end-market build rates and realistic ASP bands, the final number becomes easier to trace, repeat, and explain on a practical decision timeline.
Key Questions Answered in the Report
What is the current Carbon Fiber Tape Market size?
The carbon fiber tape market size reached USD 2.83 billion in 2026 and is forecast to grow to USD 3.81 billion by 2031 at a 6.08% CAGR.
Which segment holds the largest share of the carbon fiber tape market?
Prepreg tape led with 63.45% market share in 2025 because aerospace manufacturers prefer its consistent resin content and mechanical reliability.
Which region is growing fastest in the carbon fiber tape market?
Asia-Pacific is expanding at 6.57% CAGR through 2031, propelled by wind-energy build-outs and emerging aircraft programs across China, India, and Southeast Asia.
Why are automotive OEMs adopting carbon fiber tape?
Electric vehicles benefit from 40–50% weight reductions versus aluminum parts, which helps extend driving range without redesigning battery packs.