
Carbon Fiber Reinforced Thermoplastic (CFRTP) Composite Market Size and Share
Market Overview
| Study Period | 2020 - 2031 |
|---|---|
| Market Volume (2026) | 250.56 kilotons |
| Market Volume (2031) | 374.96 kilotons |
| Growth Rate (2026 - 2031) | 8.40 % |
| Fastest Growing Market | Asia Pacific |
| Largest Market | North America |
| Market Concentration | Medium |
Major Players *Disclaimer: Major Players sorted in no particular order Image © Mordor Intelligence. Reuse requires attribution under CC BY 4.0. | |
Carbon Fiber Reinforced Thermoplastic (CFRTP) Composite Market Analysis by Mordor Intelligence
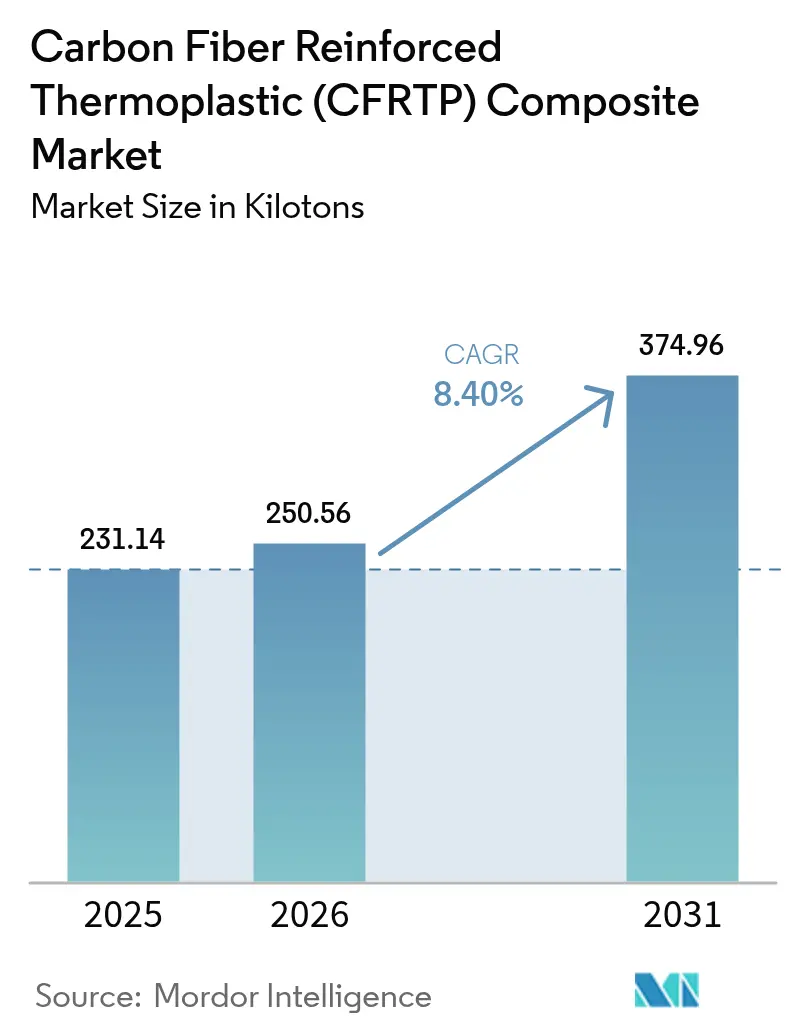
Carbon Fiber Reinforced Thermoplastic Composite market size in 2026 is estimated at 250.56 kilotons, growing from 2025 value of 231.14 kilotons with 2031 projections showing 374.96 kilotons, growing at 8.40% CAGR over 2026-2031. Robust growth reflects the material’s ability to pair aerospace-grade strength-to-weight ratios with full recyclability, aligning with decarbonization targets across transportation, energy, and construction. Rising electric‐vehicle production, a rebound in commercial aircraft build rates, and fast-moving hydrogen storage programs form the core demand pillars. At the same time, breakthroughs in energy-efficient fiber production and additive manufacturing lower entry barriers, while regional recycling mandates open fresh revenue pools for suppliers. Competitive intensity is building as integrated incumbents defend share against regional capacity buildouts and specialist recyclers.
Key Report Takeaways
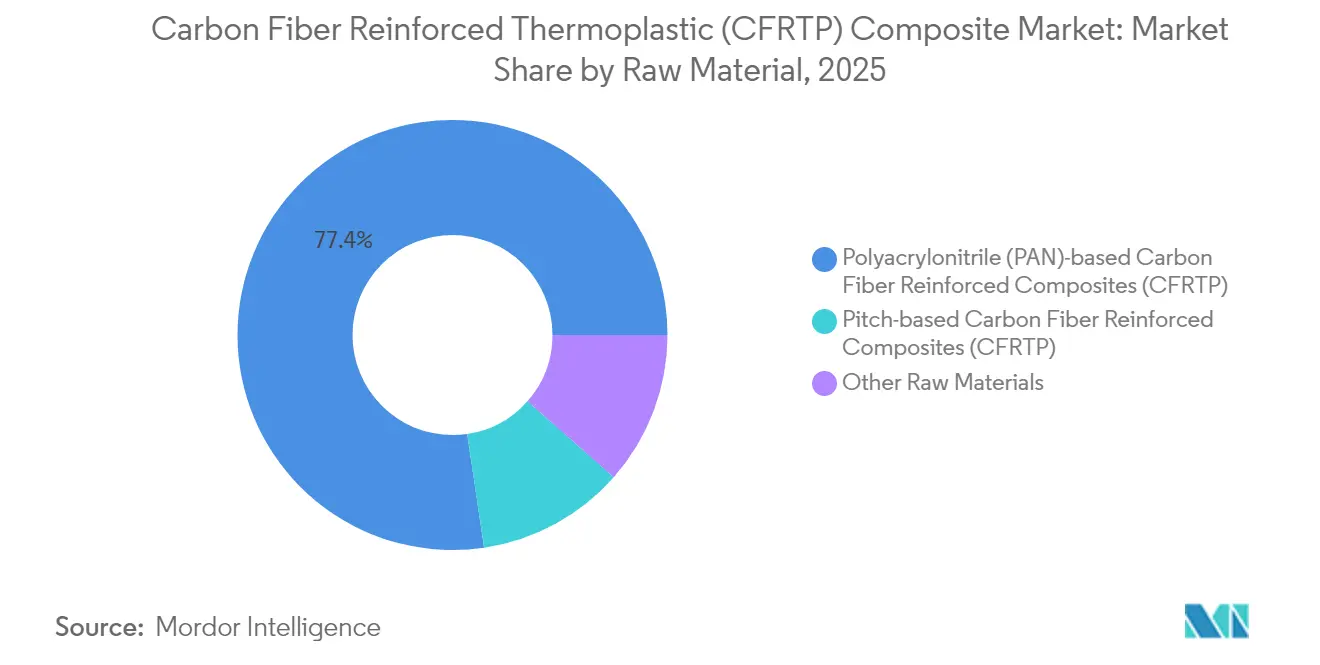
- By raw material, PAN-based grades led with 77.35% revenue share in 2025, while the Other Raw Materials segment is advancing at a 9.42% CAGR through 2031.
- By resin, PEEK captured 34.25% of the carbon fiber reinforced thermoplastic composite market share in 2025 and is also the fastest-growing resin at 9.61% CAGR through 2031.
- By manufacturing process, compression and stamp molding held 39.05% of the 2025 volume, whereas additive manufacturing records the highest projected CAGR of 9.46% to 2031.
- By end-user industry, aerospace and defense accounted for 41.68% share of the carbon fiber reinforced thermoplastic composite market size in 2025 and is progressing at a 9.23% CAGR through 2031.
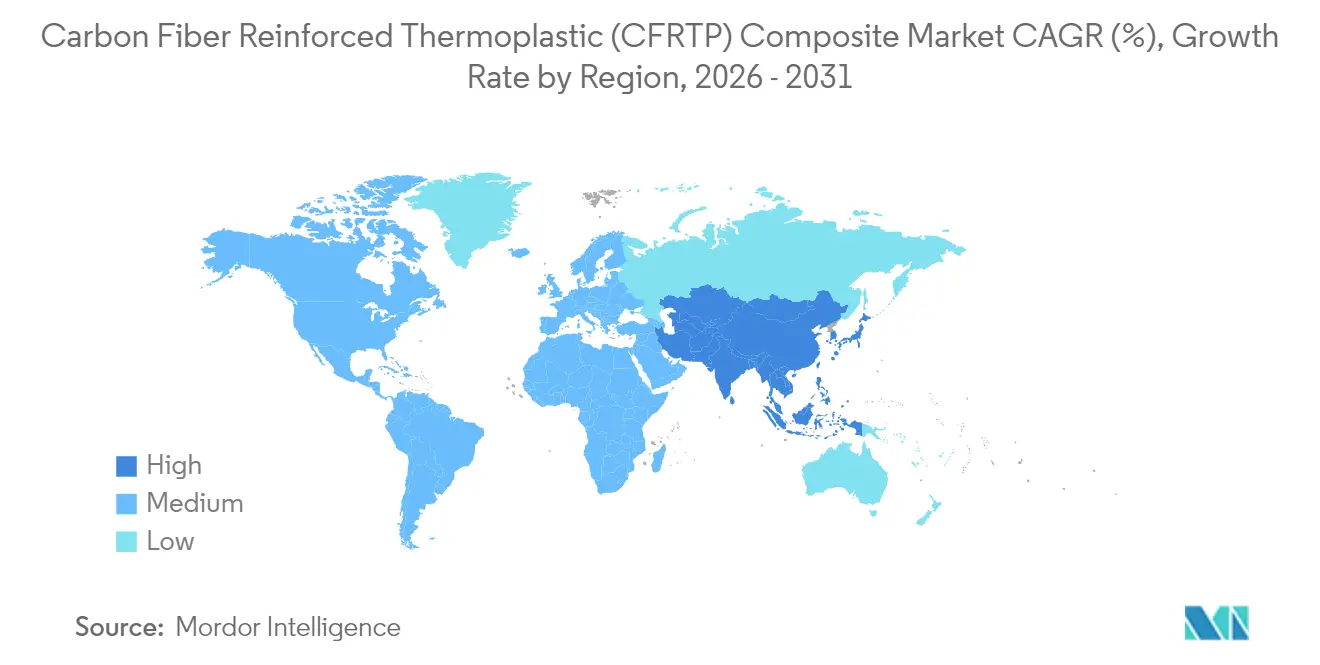
- By geography, North America dominated with 35.78% share in 2025, and Asia-Pacific is the fastest-expanding region at 8.98% CAGR to 2031.
Note: Market size and forecast figures in this report are generated using Mordor Intelligence’s proprietary estimation framework, updated with the latest available data and insights as of 2026.
Market Trends and Insights
Drivers Impact Analysis of Carbon Fiber Reinforced Thermoplastic (CFRTP) Composite Market*
| Driver | (~) % Impact on CAGR Forecast | Geographic Relevance | Impact Timeline |
|---|---|---|---|
| Surging demand for lightweight EV structures | +2.1% | Global, with concentration in China, Europe, North America | Medium term (2-4 years) |
| Accelerating commercial aircraft production ramp-ups | +1.8% | Global, led by North America and Europe | Medium term (2-4 years) |
| Stringent global emission and recyclability mandates | +1.5% | Global, with EU leading regulatory framework | Long term (≥ 4 years) |
| Increasing usage in the construction sector | +1.2% | APAC core, spill-over to North America and Europe | Long term (≥ 4 years) |
| Rapid scale-up of hydrogen pressure-vessel programs | +1.9% | Global, with early gains in Japan, Germany, California | Medium term (2-4 years) |
| Source: Mordor Intelligence | |||
Surging Demand for Lightweight EV Structures
Automakers increase carbon fiber thermoplastic use in battery enclosures, body panels, and chassis members to extend driving range and cut charging time. The material’s reversible melt behavior supports end-of-life recycling, satisfying circular-economy rules now unfolding in China and the European Union. Fleet operators benefit from easier repair because damaged parts can be reheated and reshaped instead of replaced. Tesla’s application of carbon fiber composites in its humanoid robot underscores versatility beyond vehicles, suggesting spillover into multiple mobility platforms. China consumed 69,000 metric tons of carbon fiber in 2024, evidence of a deepening Asian demand base.
Accelerating Commercial Aircraft Production Ramp-ups
Airframe OEMs are rebuilding supply chains to meet higher 737 MAX and 787 Dreamliner output targets, sustaining composite demand for secondary structures that cut fuel burn. Hexcel reaffirmed investment in lightweight thermoplastic solutions in its Q1 2025 earnings report, despite lower top-line sales. The shift to more-electric aircraft fosters thermoplastic adoption because the matrix insulates wiring and integrates anti-icing heaters. European initiatives under the ThermoPlastic Composites Research Center (TPRC) accelerate certification of large-volume parts, shortening design-to-flight timelines. Superior fatigue resistance over metals lengthens service intervals, an advantage keenly valued by airlines after COVID-19 disruptions.
Stringent Global Emission and Recyclability Mandates
Regulators link life-cycle emissions to material choice, pushing OEMs toward recyclable thermoplastics. The EU is debating a ban on non-recyclable carbon composites in vehicles from 2029, steering R&D into mechanically recoverable fiber streams. Process innovators recover fibers retaining 93.6% tensile strength, opening secondary markets in sporting goods and electronics. The U.S. Department of Energy lists carbon fiber reinforced thermoplastic composites as critical for energy-efficiency goals, unlocking federal funding for pilot plants[1]. Fairmat and similar start-ups export recycled chips that substitute virgin material in non-safety-critical uses, lowering cost and carbon footprint.
Rapid Scale-up of Hydrogen Pressure-Vessel Programs
Type 3, 4, and 5 tanks require burst strength beyond 700 bar, an area where thermoplastic composites excel because of superior fatigue performance. Toray forecasts 42% annual growth in hydrogen tank demand as mobility and stationary projects leave the lab and enter scale-up. Infinite Composites collaborates with Oak Ridge National Laboratory to design field-repairable thermoplastic liners that lengthen vessel life. German and Japanese policymakers subsidize refueling corridors, catalyzing early offtake for certified tank suppliers. Re-formability lets operators cut downtime by requalifying vessels on site instead of full replacement.
Restraints Impact Analysis of Carbon Fiber Reinforced Thermoplastic (CFRTP) Composite Market*
| Restraint | (~) % Impact on CAGR Forecast | Geographic Relevance | Impact Timeline |
|---|---|---|---|
| High initial investment and manufacturing cost | -1.4% | Global, with higher impact in emerging markets | Short term (≤ 2 years) |
| Limited large-scale thermoforming press capacity | -0.8% | Global, concentrated in established manufacturing hubs | Medium term (2-4 years) |
| Supply-chain weaponization risk in aerospace | -0.6% | Global, with focus on US-China trade tensions | Long term (≥ 4 years) |
| Source: Mordor Intelligence | |||
High Initial Investment and Manufacturing Cost
Autoclaves, compression presses, and automated fiber placement cells can top USD 30 million per line, curbing entry and slowing adoption in price-sensitive segments. SGL Carbon reported a 35.2% sales drop in its Carbon Fibers unit in 2024, citing demand swings that leave high fixed-cost assets under-utilized. Plasma + microwave heating demonstrated at the University of Limerick cuts energy up to 70%, yet commercial readiness remains several years out. Raw fiber remains costlier than aluminum or steel, keeping composites out of economy-class vehicles. Economics improve only when volumes amortize tooling, thus OEMs hesitate until downstream demand is locked.
Limited Large-scale Thermoforming Press Capacity
Presses working above 300 °C and 100 bar are scarce, creating lead-time bottlenecks for large auto body-in-white and aircraft skin panels. Hexcel’s automated preform lines shorten cycle time but cannot alone satisfy rising volume. Albany International bought CirComp to gain specialty thermoplastic molding expertise, signaling industry need to secure press infrastructure. New installs can take 18 months from order to start-up, complicating OEM ramp schedules. Without wider deployment, thermoplastic uptake in high-volume programs may lag projections.
*Our forecasts treat driver/restraint impacts as directional, not additive. The impact forecasts reflect baseline growth, mix effects, and variable interactions.
Carbon Fiber Reinforced Thermoplastic (CFRTP) Composite Market Segment Analysis
By Raw Material:
PAN-based Dominance Faces Recycling DisruptionPAN-based grades delivered 77.35% of 2025 volume, underlining their entrenched production lines and aerospace heritage. High tensile modulus lets designers trim structural weight while meeting safety margins. The carbon fiber reinforced thermoplastic composite market size for PAN-based grades is projected to expand at a stable 7.76% CAGR as incumbents retrofit continuous lines for higher throughput. Cost-effective reheat cycles improve scrap rates, enhancing plant economics.
Other Raw Materials, including recycled fiber, register a 9.42% CAGR—the highest within raw materials—as end-users adopt circular procurement goals. Recycled fiber now retains 93.6% of virgin tensile strength, widening suitability for secondary load paths. Bio-sourced acrylonitrile under study by Syensqo and Trillium signals a longer-term pivot to greener feedstocks. Niche pitch-based grades serve thermal management in battery packs because of metal-like conductivity. Though volume small, premium pricing balances supply constraint, keeping margins attractive.

By Resin:
PEEK’s Dual Leadership Reflects Performance PremiumPEEK secured 34.25% 2025 share and leads growth at 9.61% CAGR thanks to 250 °C continuous-use temperature and chemical inertness. The carbon fiber reinforced thermoplastic composite market share advantage strengthens where flammability and smoke toxicity rules are strict, notably in jet engines and offshore platforms. Medical device usage diversifies revenue, spreading risk across sectors.
Cost-focused segments rely on PU, PES, or PEI which trade peak temperature for price. These resins feed interior panels and consumer electronics where operating loads are moderate. Bio-based PEI under exploration could add a sustainability differentiator without forfeiting mechanical properties. Resin formulators also blend nano-fillers to enhance conductivity, fostering integrated de-icing layers in aerospace systems.
By Manufacturing Process:
Compression Molding Leads as Additive Manufacturing AcceleratesCompression and stamp molding delivered 39.05% 2025 volume on the strength of automotive investments that favor short takt times and 60% fiber volume fractions. Automation trims labor and increases repeatability, supporting six-sigma quality. The carbon fiber reinforced thermoplastic composite market size associated with compression molding grows steadily as OEMs scale fuel-cell vehicle floor pans.
Additive manufacturing, at a 9.46% CAGR, disrupts low-volume, high-complexity parts. Continuous-fiber filament printers from Markforged and 9T Labs enable lattice-filled brackets with 60% lighter weight than machined aluminum. University of Limerick’s plasma heating may cut energy during sintering, bringing per-part cost closer to injection molding. Automated tape laying reaches 1,000 in/min lay-up speeds, meeting fuselage rate demands.
By End-user Industry:
Aerospace Drives Both Volume and GrowthAerospace and defense absorbed 41.68% of 2025 tonnage and expands at 9.23% CAGR as Boeing and Airbus restore single-aisle build cadences. The carbon fiber reinforced thermoplastic composite market size inside aerospace benefits from regulatory familiarity with composites, lowering certification hurdles. Defence primes layer radar-absorbing additives, giving weight savings plus stealth.
Automotive remains second in volume but faces EU scrutiny over respirable fiber dust, pushing firms to prove recycling pathways. Construction uptake in carbon fiber reinforced concrete grows as architects target net-zero structures. The CUBE building in Germany showcases 50% material savings versus steel reinforcement. Wind turbine blades lengthen beyond 100 m as fatigue-proof carbon spars enable larger swept area.

Geography Analysis
North America Carbon Fiber Reinforced Thermoplastic (CFRTP) Composite Market
North America held 35.78% share in 2025, anchored by the United States’ aerospace and defence complex and supported by Canada’s MRO hubs. Local presence of Toray, Hexcel, and Solvay shortens lead times, safeguarding programs against geopolitical risk. Government grants under the Inflation Reduction Act encourage domestic hydrogen tank production, widening downstream pull.
APAC Carbon Fiber Reinforced Thermoplastic (CFRTP) Composite Market
Asia-Pacific posts the fastest 8.98% CAGR to 2031. China scales electric-vehicle output and now hosts multiple kiloton-scale carbon fiber lines, reducing earlier import dependence. Japanese pioneers Toray and Teijin double capacity to serve regional wind and marine projects. South Korea leverages electronics know-how to integrate EMI-shielding composites into 5G infrastructure.
Europe Carbon Fiber Reinforced Thermoplastic (CFRTP) Composite Market
Europe mixes strong demand with new regulatory headwinds. Germany’s auto base remains the largest segment consumer, but looming recyclability rules fast-track thermoplastic substitution. The ThermoPlastic Composites Research Center in the Netherlands anchors R&D alliances across OEMs and suppliers. Nordic wind investments and French aerospace clusters offset softness in general industrial demand.
Value Chain Analysis
The CFRTP value chain begins with upstream feedstocks and energy-intensive intermediates, including PAN precursor and carbon fiber conversion, followed by thermoplastic resin supply (including PEEK, PEI and PES) and compounding into pellets, tapes and prepregs. A 2026 material-flow and energy-mapping study on fiber-reinforced polymer composites also pointed to feedstock and resin production as together accounting for 85% of total primary energy demand in 2024, which highlights the role of upstream decarbonization, stable resin sourcing and recycled feedstock integration for both cost and footprint control.
Midstream processing includes conversion into continuous-fiber tapes/prepregs, semi-finished laminates and organosheets, then part manufacturing via compression/stamp molding, automated fiber placement/tape laying, welding and additive manufacturing, followed by final assembly into aircraft structures, EV components and pressure vessels. Bottlenecks are concentrated around high-temperature and high-pressure forming infrastructure, and high-rate joining and automation, driving collaborative development programs such as HAICoPAS (Hexcel and Arkema) and the HESTIA project (Fraunhofer group) for integrated, automated thermoplastic composite structures and processes. Downstream channels include OEM-direct supply and tier networks, aftermarket/MRO, and recycling loops, where mechanically recovered fiber and reclaimed chips increasingly return to compounding streams for non-safety-critical applications.
Competitive Landscape
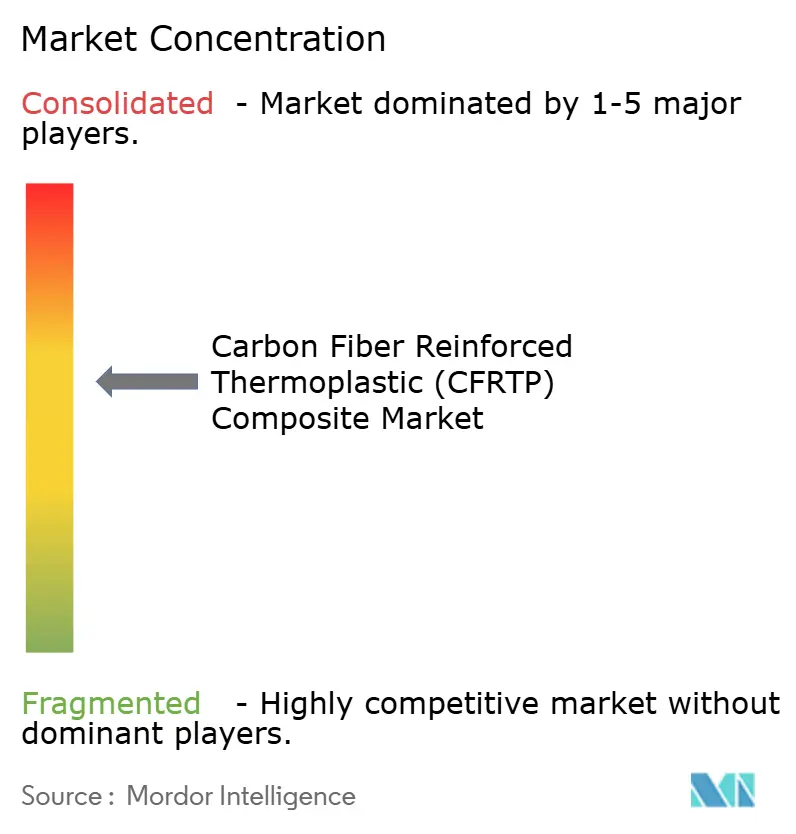
The market shows moderate concentration with the top five suppliers controlling just under 60% of global tonnage, led by Toray, Hexcel, Solvay, Teijin, and SGL Carbon. Integrated chains from precursor to prepreg shield incumbents from raw-material volatility. Toray’s 2024 acquisition of Gordon Plastics’ Colorado facility widens continuous carbon fiber thermoplastic capacity[2].
Hexcel invests in automated preforming to compress cycle times and retain engine nacelle contracts, while Solvay re-branded its composites unit as Syensqo to sharpen focus on circular products. Mid-tier firms pursue vertical mergers; Albany International’s purchase of CirComp delivers filament-winding capability in high-temperature thermoplastic grades.
Recycling specialists such as Fairmat enter long-term supply agreements with consumer-electronics makers, shifting competitive metrics toward carbon footprint and reclaim percentage. Regional Chinese producers add 25 kt of PAN-based capacity by 2026, pressuring price but easing downstream shortages. Digital manufacturing startups court aerospace primes with topology-optimized lattice parts that cut assembly count.
Carbon Fiber Reinforced Thermoplastic (CFRTP) Composite Industry Leaders
-
Toray Industries Inc.
-
Solvay SA
-
Teijin Ltd.
-
Hexcel Corporation
-
SGL Carbon SE
- *Disclaimer: Major Players sorted in no particular order
Carbon Fiber Reinforced Thermoplastic (CFRTP) Composite Market Companies Covered in this Report
- Arkema
- ARRIS Composites, Inc.
- Avient Corporation
- BASF
- Celanese Corporation
- DuPont
- Gurit Services AG, Zurich
- Hexcel Corporation
- Markforged
- Mitsubishi Chemical Corporation
- Quickstep
- SABIC
- SGL Carbon
- Syensqo
- Teijin Limited
- Toray Industries Inc.
- Victrex plc
Read Analysis of Carbon Fiber Reinforced Thermoplastic (CFRTP) Composite Companies
Market Opportunities and Future Outlook
A concrete opportunity is the shift from autoclave-centric composite fabrication toward welded, automated CFRTP assembly in aerospace. This approach reduces touch labor and can shorten cycle times while preserving structural performance, with industrial demonstrations supporting the pathway: the TAVieDA project (Fraunhofer IWU/LBF, Trelleborg, Airbus Helicopters) demonstrated an automated aircraft door process that reduced manufacturing time from 110 hours to 4 hours using CFRTP welding. Daher also validated a welded CFRTP wing rib demonstrator reporting 22% weight reduction and 15% lower assembly costs versus an aluminum assembly. For suppliers, this opens room for qualified tapes/prepregs, welding-ready surface treatments and automated joining equipment, particularly for secondary structures and modular subassemblies where fastener count and assembly time drive cost.
Another opportunity is improving cost and lead-time normalization for higher-volume CFRTP programs through expanded large-tow carbon fiber capacity and more localized supply in Asia, which supports automotive lightweighting, wind-energy components and industrial applications where price sensitivity has limited adoption. Capacity additions tied to China include Sinopec Shanghai Petrochemical commencing Phase I commercial operation of a 30,000-ton-per-year large-tow carbon fiber project (48K single-line capability) and Zhongfu Shenying putting three high-performance carbon fiber lines into operation, broadening availability across general-purpose to high-modulus categories. Alongside these supply moves, circular-material offerings and recycled feedstock incorporation provide a route to recyclability mandates and OEM procurement requirements, supporting scope for recyclers and incumbents to expand closed-loop supply agreements and secondary-grade product portfolios.
Recent Industry Developments in Carbon Fiber Reinforced Thermoplastic (CFRTP) Composite Market
- April 2026: Syensqo and Toray Composite Materials America announced a five-year global strategic supply agreement covering high-strength and intermediate-modulus PAN-based carbon fibers for aerospace and defense applications. The agreement supports supply continuity for qualification-sensitive programs and strengthens the link between fiber producers and thermoplastic composite solution providers. It also reinforces long-term contracting as a competitive lever amid capacity additions and procurement shifting toward lower-footprint materials.
- December 2025: Toray Advanced Composites completed NCAMP qualification for Cetex high-performance thermoplastic composite materials. The qualification supports faster adoption by aerospace manufacturers that rely on standardized material databases for design allowables and production readiness. It also expands Toray's position in qualified thermoplastic systems used in welded and automated assembly concepts.
- November 2024: Toray Advanced Composites acquired Gordon Plastics assets, technology and IP in Englewood, Colorado, to expand continuous fiber reinforced thermoplastic composite production capacity. The acquisition adds capability and scale closer to North American aerospace and industrial customers, improving lead times for tapes, laminates and related semi-finished products. It also increases competitive pressure on regional suppliers by pairing production assets with Toray's existing thermoplastic portfolio.
Carbon Fiber Reinforced Thermoplastic (CFRTP) Composite Market Report Scope and Research Methodology
Market Definition and Coverage
This market covers carbon-fiber reinforced thermoplastic composites that are produced and used as lightweight, high-strength materials across manufacturing value chains. Sizing is based on physical consumption and shipments rather than revenue.
Scope exclusions: thermoset carbon composites, glass fiber thermoplastic composites, and purely R and D lab materials that are not sold into commercial end uses.
Segments Covered in This Report
- By Raw Material
- Polyacrylonitrile (PAN)-based Carbon Fiber Reinforced Composites (CFRTP)
- Pitch-based Carbon Fiber Reinforced Composites (CFRTP)
- Other Raw Materials (Recycled Carbon Fibers, etc.)
- By Resin
- Polyether Ether Ketone (PEEK)
- Polyurethane (PU)
- PolyetherSulfone (PES)
- Polyetherimide (PEI)
- Others (Polyamide, Polycarbonate, etc.)
- By Manufacturing Process
- Compression and Stamp Moulding
- Automated Fibre Placement / Tape Laying
- Injection and Over-Moulding
- Additive Manufacturing (Carbon Fiber-filled filaments)
- By End-user Industry
- Aerospace and Defence
- Automotive
- Construction
- Electrical and Electronics
- Wind Turbines
- Marine
- Sporting Equipments
- Other End-user Industries (Healthcare, etc.)
- By Geography
- Asia-Pacific
- China
- Japan
- India
- South Korea
- ASEAN Countries
- Rest of Asia-Pacific
- North America
- United States
- Canada
- Mexico
- Europe
- Germany
- United Kingdom
- France
- Italy
- Spain
- Russia
- NORDIC Countries
- Rest of Europe
- South America
- Brazil
- Argentina
- Rest of South America
- Middle-East and Africa
- Saudi Arabia
- South Africa
- Rest of Middle-East and Africa
- Asia-Pacific
Data Sources, Market Sizing, and Validation
Desk Research
Desk work starts by mapping what drives CFRTP demand and supply in unit terms, since production and use patterns tend to explain volumes better than broad revenue statements. Baseline signals are pulled from public sources such as USGS materials publications, UN Comtrade trade statistics, the US Census Bureau manufacturing datasets, and International Energy Agency transport and industry indicators when an end use link is relevant. For aerospace and auto exposure, we also use public FAA aircraft fleet and deliveries summaries and global vehicle production series published by official statistical bodies.
To anchor the model in current market activity, we review company annual reports, investor presentations, and plant announcements, then cross check those points with reputable press coverage and association websites focused on composites and thermoplastics. Select paid subscriptions are used only where they help verify company financials, track patent activity around thermoplastic matrices, and sanity check shipment and trade movements at a higher level. The desk research sources named here are illustrative, and we also used other public references for data collection, validation, and clarification.
Primary Interviews and Surveys
Primary calls and surveys are used to confirm how CFRTP is being bought and specified, and to validate the practical split between continuous fiber and other formats across major end uses, including automotive, aerospace, industrial, and sports applications. We speak with material suppliers, compounders, molders, distributors, and procurement or engineering leaders at end users across APAC, EMEA, and the Americas, and we then reconcile their feedback with what we observed in public capacity and trade signals.
Distribution of primary research fieldwork respondents
| Company type | Respondent position | Region |
|---|---|---|
| Top tier: 36% | CXOs: 12% | APAC: 41% |
| Mid tier: 47% | Functional/Unit leaders: 36% | EMEA: 37% |
| Smaller Players: 17% | Managers: 52% | Americas: 22% |
Market-Sizing & Forecasting
The core model is built using a top-down approach, where production, conversion, and end use demand indicators are reconstructed into a demand pool for CFRTP in kilotons, then allocated across regions based on manufacturing intensity and adoption. We corroborate the totals using selective bottom-up approximations, such as sampling typical part-level weights, applying resin and fiber loading ranges, and performing channel checks on converter volumes, before final numbers are adjusted.
Key inputs include carbon fiber availability and conversion trends, thermoplastic resin mix shifts (for example PA, PP, PEEK, and PPS usage where applicable), the share of continuous fiber formats in structural applications, lightweighting adoption in vehicle programs, and aircraft build and retrofit activity that drives advanced composite pull-through. When data is patchy for smaller end uses, we use conservative penetration assumptions that are confirmed in interviews and then tested against trade and capacity signals.
For forecasting, scenario analysis is used with a base case tied to expected adoption curves and realistic supply expansion. We sense check the slope using expert views on qualification cycles and price-to-volume tradeoffs. Short-term trend smoothing is applied to avoid overreacting to one-off project wins, and the outlook is then reconciled back to the main drivers so the forecast remains explainable on a client call.
Data Validation & Update Cycle
Outputs are checked in several steps, starting with basic variance checks by region and end use so that no single assumption drives the full total. Modeled volumes are compared against independent signals such as announced capacity, trade movement direction, and end market production trends. Anomalies are flagged for analyst review before sign off.
If a major plant startup slips, a large downstream program is delayed, or price-to-volume behavior changes sharply, we re-contact selected experts and refresh the most sensitive assumptions. Reports are refreshed annually, with interim updates for material events, followed by a final pre-delivery review so clients receive the latest updated view.
Mordor Intelligence's Carbon Fiber Reinforced Thermoplastic Cfrtp Composite Market Sizing Compared With Other Published Estimates
Published market sizes for CFRTP often do not match because some sources size the market in revenue while others size it in volume, and they also differ on what they treat as in-scope CFRTP products. Differences also show up when a publisher uses a shorter study period or applies a single global growth rate without checking how adoption varies across aerospace, automotive, and industrial uses.
Plant capacity announcements, converter utilization feedback, and import-export movement checks are the evidence points that connect Mordor Intelligence's estimate to physical market throughput. For that reason, the benchmark below is expressed in kilotons rather than USD values. Some external estimates also blend adjacent categories, such as broader thermoplastic composites, or assume aggressive pricing growth even when higher-cost CFRTP grades are limited to qualified programs. These choices can shift the value number away from the underlying volume trend.
Benchmark comparison
| Source | Market Size | Gaps in Research Methodology |
|---|---|---|
| Mordor Intelligence | USD 250.56 M (2026) | |
| Global Consultancy A | USD 7.65 B (2025) | Reported in USD and shaped by assumed price progression, and it likely counts a wider set of carbon thermoplastic composite sales beyond the shipped CFRTP volume boundary. |
| Industry Publisher B | USD 0.98 B (2024) | Uses a smaller starting-year revenue base and a high growth path, and the scope appears sensitive to how resin types and carbon fiber formats are grouped into the final total. |
The table indicates that the spread is mainly driven by value versus volume sizing, plus scope choices around which products are counted as CFRTP. By keeping the steps traceable to capacity signals, trade direction, and end-use production indicators, the sizing stays easier to replicate and to pressure test when market conditions change.
Key Questions Answered in the Report
How fast will the carbon fiber reinforced thermoplastic composite market grow through 2031?
Industry volume is projected to rise from 250.56 kilotons in 2026 to 374.96 kilotons by 2031, reflecting an 8.40% CAGR.
Which raw material leads the carbon fiber reinforced thermoplastic composite industry?
PAN-based grades dominate with 77.35% 2025 share, thanks to mature supply chains and proven performance.
Why is PEEK seeing the highest growth among resins?
PEEK pairs exceptional 250 °C heat resistance with chemical stability, giving it 34.25% share and a 9.61% CAGR in aerospace, energy, and medical parts.
What region offers the fastest demand upside?
Asia-Pacific is forecast to expand at 8.98% CAGR to 2031, propelled by electric-vehicle scaling in China and hydrogen programs in Japan and South Korea.
How is recycling shaping competitive dynamics?
Mechanical recovery processes now retain 93.6% fiber strength, letting recyclers feed secondary markets and compelling incumbents to integrate closed-loop offerings.