
CAR T-Cell Therapy Market Size and Share
Market Overview
| Study Period | 2020 - 2031 |
|---|---|
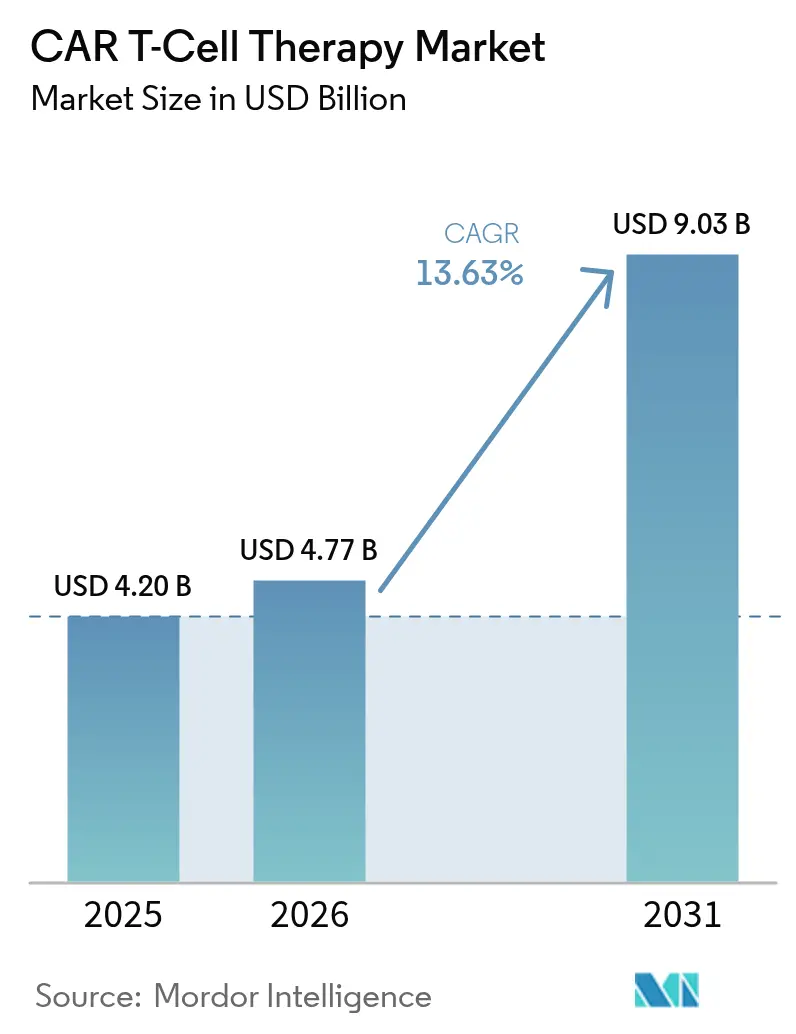
| Market Size (2026) | USD 4.77 Billion |
| Market Size (2031) | USD 9.03 Billion |
| Growth Rate (2026 - 2031) | 13.63 % |
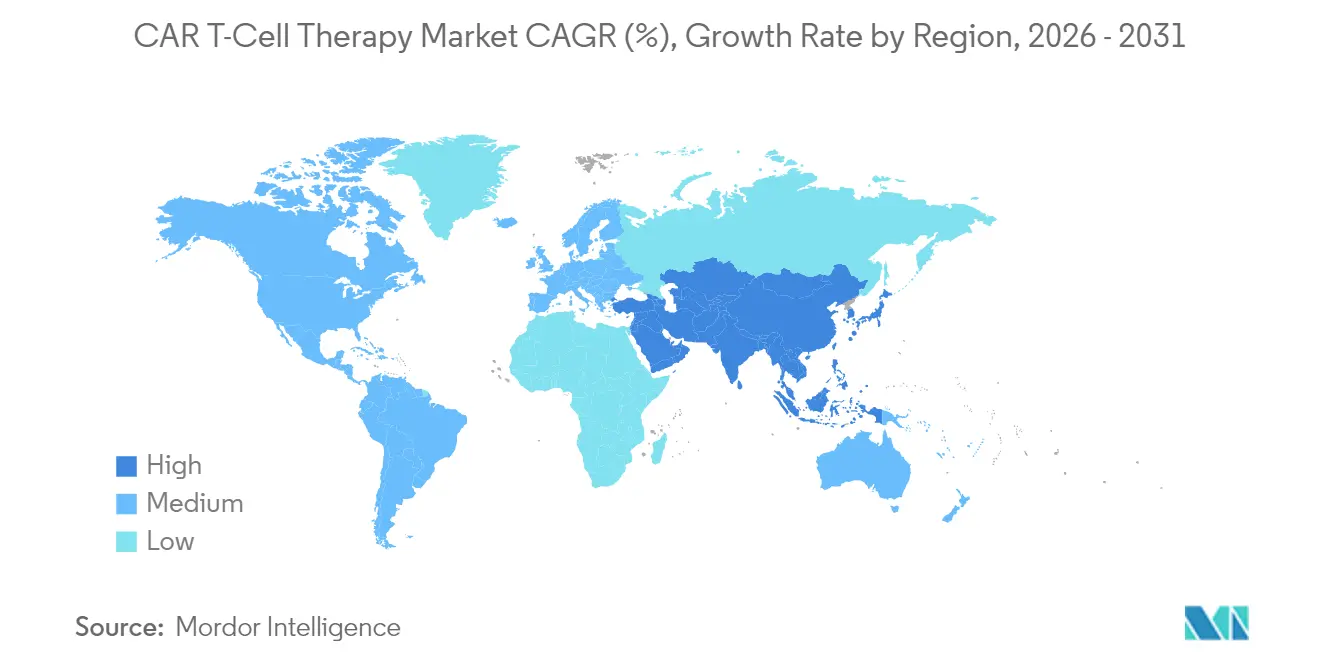
| Fastest Growing Market | Asia-Pacific |
| Largest Market | North America |
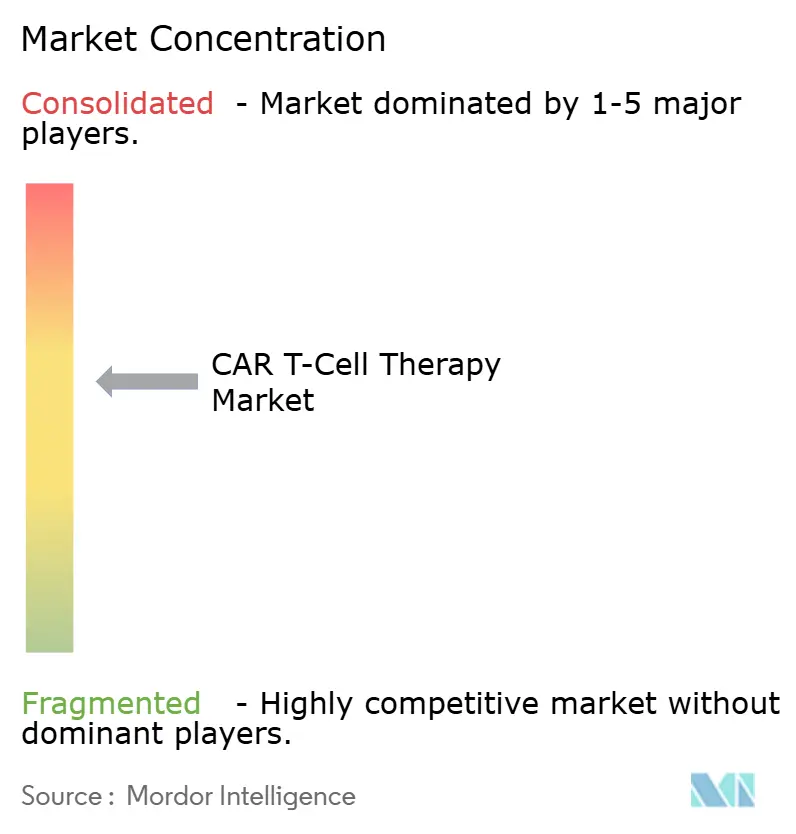
| Market Concentration | Medium |
Major Players *Disclaimer: Major Players sorted in no particular order Image © Mordor Intelligence. Reuse requires attribution under CC BY 4.0. | |
CAR T-Cell Therapy Market Analysis by Mordor Intelligence
The Global CAR T-Cell Therapy Market size was valued at USD 4.20 billion in 2025 and estimated to grow from USD 4.77 billion in 2026 to reach USD 9.03 billion by 2031, at a CAGR of 13.63% during the forecast period (2026-2031).
Uptake is accelerating as regulators permit use in earlier treatment lines, highlighted by the FDA’s April 2024 clearance of Abecma after just two prior regimens, which broadens the eligible patient pool. North America remains the revenue leader on the back of established reimbursement, while Asia-Pacific is emerging as the fastest-expanding region thanks to dense clinical-trial activity and rising domestic manufacturing capacity. CD19-directed products continue to anchor sales, yet BCMA-targeted options are rapidly gaining momentum as earlier-line multiple-myeloma indications come online. Across Europe, point-of-care manufacturing hubs are cutting vein-to-vein time to roughly a week, giving early adopters a clear logistical advantage Blood. Persistent shortages of viral-vector capacity and high production costs, however, are constraining throughput and keeping pricing pressure in focus.
Key Report Takeaways
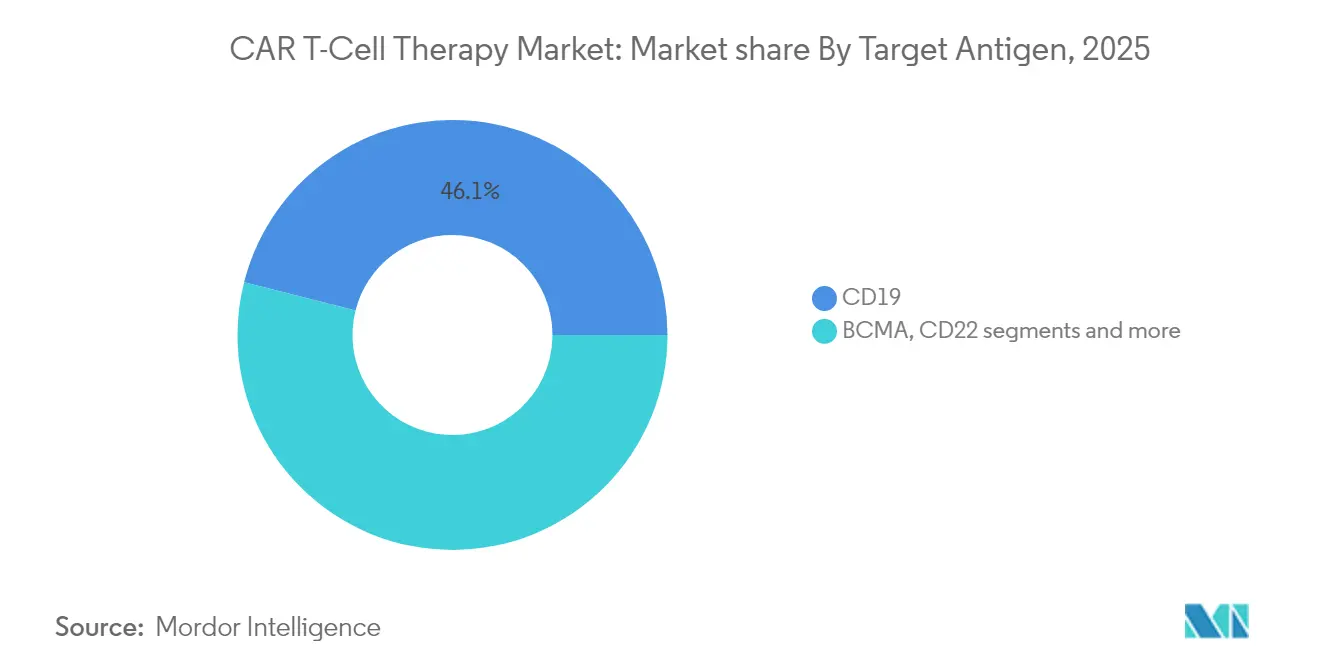
- By target antigen: CD19 therapies led with 46.05% of car t-cell therapy market share in 2025; BCMA is projected to expand at a 14.02% CAGR through 2031.
- By cell source: Autologous products held 91.25% revenue share in 2025, whereas allogeneic lines are forecast to log the fastest 15.22% CAGR between 2026 and 2031.
- By product: Yescarta accounted for 37.35% of sales in 2025; Abecma is the fastest climber with a 14.68% CAGR to 2031.
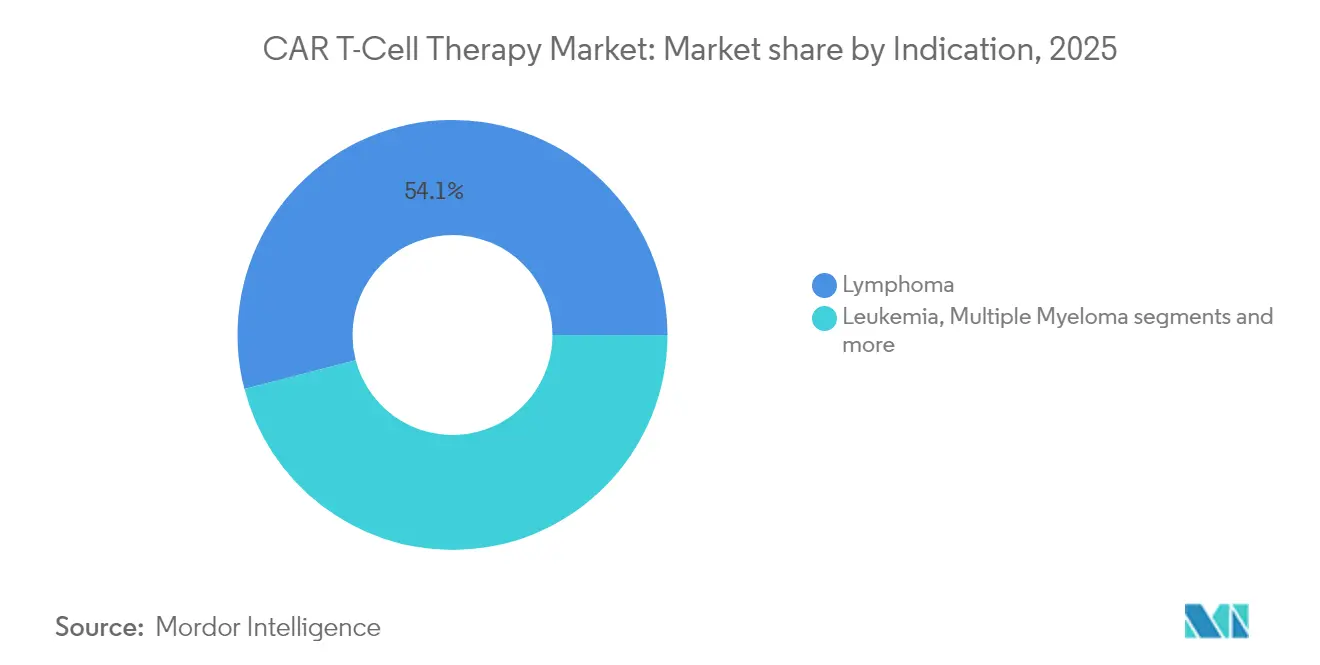
- By indication: Lymphoma captured 54.05% of the car t-cell therapy market size in 2025; multiple myeloma is poised for a 14.18% CAGR to 2031.
- By end-user: Hospitals owned 66.10% of revenue in 2025 while academic institutes are on track for a 15.20% CAGR.
- By geography: North America led with 52.10% share in 2025; Asia-Pacific advances at 15.55% CAGR to 2031.
Note: Market size and forecast figures in this report are generated using Mordor Intelligence’s proprietary estimation framework, updated with the latest available data and insights as of 2026.
Market Trends and Insights
Drivers Impact Analysis of CAR T-Cell Therapy Market*
| Driver | (~) % Impact on CAGR Forecast | Geographic Relevance | Impact Timeline |
|---|---|---|---|
| Second-line LBCL FDA Approvals Accelerating Early-Line Uptake | +2.1% | North America & Europe | Medium term (2-4 years) |
| Decentralised EU Point-of-Care Manufacturing Slashes Vein-to-Vein Time | +1.8% | Europe, spillover to APAC | Short term (≤ 2 years) |
| Growing Burden of Cancer Worldwide | +1.5% | Global | Long term (≥ 4 years) |
| Allogeneic "Off-the-Shelf" Pipelines Lowering Cost-of-Goods | +2.3% | Global, early gains in North America | Medium term (2-4 years) |
| Increasing Investment and R&D to Develop CAR T-Cell Therapy | +1.2% | North America & Europe, APAC emerging | Long term (≥ 4 years) |
| Medicare NTAP Expansion to Community Oncology Centres Broadens Access | +1.7% | United States | Short term (≤ 2 years) |
| Source: Mordor Intelligence | |||
Second-line LBCL FDA Approvals Accelerating Early-Line Uptake
Phase 3 TRANSFORM data show Breyanzi delivering a 45.8% three-year event-free survival versus 19.1% for chemo in second-line LBCL, prompting oncologists to move CAR T earlier in the care cascade [1]Bristol-Myers Squibb, “Breyanzi Demonstrates Clinically Meaningful Outcomes Across B-Cell Malignancies in New Data Presented at 2024 ASCO Annual Meeting,” . Earlier-line positioning expands the pool of fitter patients, raising response durability and reducing salvage-therapy use. Competitors are therefore re-designing trials to target second-line settings, intensifying label-expansion races. Payers are beginning to weigh long-term cost offsets from reduced relapse, which may ease reimbursement hurdles. Collectively, these elements reinforce double-digit growth in the car t-cell therapy market.
Decentralised EU Point-of-Care Manufacturing Slashes Vein-to-Vein Time
The Euplagia-1 trial showed 92% overall and 75% complete response rates using a seven-day, on-site process in relapsed CLL/SLL Blood. Rapid manufacture cuts attrition in fast-progressing cancers and lifts centre capacity without large capital layouts. Developers such as Galapagos and academic consortia are scaling modular clean-rooms that can be grafted onto existing hospitals, a model already shaving costs for payers CGT Live. As regulators craft guidance on point-of-care quality control, firms with robust digital tracking are securing early site partnerships, speeding market penetration.
Growing Burden of Cancer Worldwide
More than 1,200 cell-and-gene candidates are currently in human studies, mirroring surging incidence and earlier diagnosis, particularly across rapidly urbanising Asian economies Technology Networks. Ageing populations and lifestyle shifts are pushing haematologic malignancy caseloads higher, fuelling demand for innovative immunotherapies. Governments in China, South Korea and Singapore are subsidising domestic manufacturing to curb expensive imports, a move that widens payer acceptance. This macro force underpins the long-run expansion trajectory of the car t-cell therapy market.
Allogeneic “Off-the-Shelf” Pipelines Lowering Cost-of-Goods
Allogeneic production slices dose costs to roughly USD 4,460, versus USD 95,780 for autologous lots, a 95% saving that attracts value-driven payers Sartorius. Immediate availability is critical in aggressive diseases and in rural areas lacking apheresis capacity. Allogene Therapeutics is using CRISPR knock-outs to minimise graft-versus-host disease risk while site-specific integration boosts persistence Allogene. Although immunogenicity questions remain, the economic and logistical upside is considered pivotal for scaling the car t-cell therapy market.
Restraints Impact Analysis of CAR T-Cell Therapy Market*
| Restraint | (~) % Impact on CAGR Forecast | Geographic Relevance | Impact Timeline |
|---|---|---|---|
| High Cost of Developing CAR T-Cell Therapy | -1.8% | Global, acute in emerging markets | Long term (≥ 4 years) |
| Vector GMP Capacity Bottlenecks Raise Lead-Times | -2.2% | Global, severe in APAC | Short term (≤ 2 years) |
| Limited Patient Eligibility | -1.4% | Global, pronounced in elderly populations | Medium term (2-4 years) |
| Potential for Severe Side Effects | -1.6% | Global, regulatory focus in EU & US | Short term (≤ 2 years) |
| Source: Mordor Intelligence | |||
High Cost of Developing CAR T-Cell Therapy
Autologous batches require more than 200 labor hours and command list prices exceeding USD 500,000, thereby limiting uptake to high-income systems Oncoscience. Fragmented reimbursement in Latin America, the Middle East and parts of Eastern Europe leaves many eligible patients untreated. The economic burden has opened space for competing modalities such as bispecific antibodies, pressuring manufacturers to adopt automated closed systems or risk marginalisation. Programmes demonstrating outpatient feasibility and short adverse-event windows are best placed to convince payers of cost-effectiveness, but the constraint remains material for the car t-cell therapy market.
Vector GMP Capacity Bottlenecks Raise Lead-Times
A shortage of lentiviral production slots is delaying both commercial batches and pivotal trials, stretching lead-times and capping volume growth Endpoints. Scale-up is capital-intensive and takes up to two years, so sponsors with captive vector suites enjoy a decisive edge. The scarcity is propelling interest in non-viral transposon systems and high-titre transient plasmid approaches. In parallel, firms are integrating vector plants to derisk supply, a trend evident in Kite’s planned fourfold capacity jump by 2026. Until new capacity comes online, the constraint will temper the otherwise robust trajectory of the car t-cell therapy market.
*Our forecasts treat driver/restraint impacts as directional, not additive. The impact forecasts reflect baseline growth, mix effects, and variable interactions.
CAR T-Cell Therapy Market Segment Analysis
By Target Antigen:
CD19 Retains Scale as BCMA RisesCD19 platforms generated 46.05% of revenue in 2025, reflecting first-mover approvals across diffuse large B-cell lymphoma and paediatric ALL. Within this slice of the car t-cell therapy market, long-term datasets now exceed five years, underpinning physician confidence. BCMA constructs, boosted by Abecma’s earlier-line label, are compounding at 14.02% through 2031, the quickest among current antigen classes. Dual-target programs that combine CD19 with CD20 or CD22 are entering mid-stage trials to combat antigen escape. Developers see potential to tap relapsed settings in chronic lymphocytic leukaemia and mantle-cell lymphoma, broadening the car t-cell therapy market.
Next-wave antigen strategies aim to move beyond haematology. GD2 programs are gaining ground in neuroblastoma, while HER2 constructs progress in gastric cancer cohorts. Chinese centres have opened over 20 trials on CLDN18.2, reflecting local gastric cancer prevalence. Should multi-specific designs show persistence advantages, CD19’s share could erode, yet its entrenched installed base and manufacturing know-how support near-term dominance.


By Cell Source:
Autologous Dominates but Allogeneic AcceleratesAutologous inventories delivered 91.25% of 2025 sales, cementing their role as the backbone of the car t-cell therapy market size at present. The personalised workflow fits existing regulatory frameworks and boasts five commercially approved brands. Nevertheless, vein-to-vein times of 2–4 weeks and variable product quality present obstacles in high-grade lymphomas. Allogeneic projects, projected to log a 15.22% CAGR, offer batch production, lower cost-of-goods and immediate dosing, attributes welcomed by cash-strapped payers.
Allogene, Precision BioSciences and Caribou are employing gene-editing tools to cloak donor cells from host immunity, aiming to match autologous durability. Early data suggest shorter cytopenia periods, improving outpatient viability. If large Phase 2 outcomes replicate this profile, the car t-cell therapy market could tilt toward off-the-shelf models later in the decade. Autologous incumbents are hedging by licensing allogeneic platforms, signalling market convergence rather than sudden displacement.
By Product:
Yescarta Leads While Abecma Picks Up PaceGilead’s Yescarta booked 37.35% global revenue in 2025 on the strength of adult LBCL and follicular lymphoma labels plus robust real-world evidence showing a 66.7% complete response in CNS lymphoma. Abecma, newly cleared for two-line-prior multiple myeloma, is set for the highest 14.68% CAGR to 2031. Cilta-cel has demonstrated an 89% overall response in real-world cohorts, sustaining demand across Europe and Asia.
Rivalry is shifting toward manufacturing prowess. Kite’s plan to quadruple cell-processing output by 2026 will ease slot scarcity. Bristol-Myers Squibb is piloting automated closed systems to cut labour hours. Novartis is reinvesting cash from Kymriah into next-generation constructs targeting solid tumours. Collectively, these initiatives shape the competitive intensity of the car t-cell therapy market.
By Indication:
Lymphoma Dominates, Multiple Myeloma SurgesLymphoma indications represented 54.05% of 2025 revenue, driven by mature reimbursement and broad label coverage. The car t-cell therapy market share should ease only gradually as multiple-myeloma programmes sprint forward. Abecma and cilta-cel together are underpinning a 14.18% CAGR in myeloma, aided by robust survival readouts. Leukaemia applications gained momentum after the FDA cleared obe-cel with a 55.3% complete-remission rate for adult ALL in November 2024.
Indication diversification is expanding into autoimmune diseases. Allogene’s ALLO-329, a CD19/CD70 dual-CAR, is being studied in systemic lupus erythematosus, signalling a future addressable pool beyond oncology Allogene. Solid-tumour penetration remains challenging because of micro-environment barriers, yet early synovial sarcoma data with MAGE-A4 targeting show promise FDA.
By End-User:
Hospitals Still Core as Academic Sites InnovateHospitals comprised 66.10% of global sales in 2025 as they house intensive-care and apheresis units vital for cytokine-release management. Academic institutes, however, are forecast to rise at a 15.20% CAGR, reflecting grant-funded pilot projects and next-gen platform trials. Expansion to community centres is gaining steam following Medicare’s NTAP extension and new CPT codes effective January 2025..
The Froedtert & MCW network saved 432 bed-days through outpatient administration models, underscoring operational efficiency. Companies engineering lower-toxicity constructs and remote monitoring solutions stand to capture demand in ambulatory settings, a trend that will reshape service-mix within the car t-cell therapy market.
Geography Analysis
North America CAR T-Cell Therapy Market
North America generated 52.10% of 2025 global revenue, reflecting early FDA approvals, 311 accredited treatment sites and robust private insurance coverage. New CPT procedure codes, effective in 2025, should streamline billing and accelerate adoption outside academic hubs Oncology News Central. Nevertheless, access remains uneven; only 1 in 5 clinically eligible US patients currently receives therapy, creating white-space for mobile apheresis units and tele-monitoring services. Manufacturers with domestic vector plants and rapid-release testing enjoy smoother supply in light of persistent viral-vector bottlenecks.
APAC CAR T-Cell Therapy Market
Asia-Pacific is forecast to be the fastest-growing segment, advancing at 15.55% CAGR through 2031 as China surpasses the United States in registered CAR-T trials, tallying more than 300 by January 2024. Japan and South Korea are issuing expedited review pathways, aiming to domesticate manufacturing as a strategic healthcare asset. These developments place the region at the core of future expansion within the car t-cell therapy market.
Europe CAR T-Cell Therapy Market
Europe holds meaningful share with a distinct innovation edge in decentralised manufacturing. Seven-day point-of-care pilots in Belgium and Spain have proven technical feasibility and economic efficiency, positioning the bloc as a living lab for rapid delivery models Blood. Unified HTA rules slated for 2025 may harmonise reimbursement, yet country-level price negotiations still fragment uptake. Producers that couple modular clean-rooms with outcome-based pricing are most likely to penetrate price-sensitive systems. Collectively, geographic diversification cushions revenue streams and tempers region-specific policy risk across the car t-cell therapy market.

Regulatory Landscape
Regulation of CAR T-cell therapies is anchored in biologics and advanced therapy frameworks, with increasing focus on CMC control, comparability, and the need for robust clinical evidence. In the United States, FDA guidance for CAR T-cell product development (updated in 2024) reinforces expectations around cell sourcing, manufacturing controls, and long-term follow-up. FDA communications in 2025 also pointed to randomized clinical trials as the preferred evidentiary standard for new oncologic CAR T approvals when feasible.
In January 2026, FDA communicated a more flexible, risk-based approach for certain CMC expectations for cell and gene therapies, including changes to process validation expectations, which can shorten time-to-approval for manufacturing changes when supported by strong process understanding. Operational requirements at the treatment-site level are also shifting. In June 2025, FDA approved label updates across approved CD19- and BCMA-directed CAR T therapies that removed REMS program requirements, reducing administrative burden for centers delivering Abecma, Breyanzi, Carvykti, Kymriah, Tecartus, and Yescarta. In Europe, CAR T products are assessed as ATMPs via the EMA Committee for Advanced Therapies (CAT), with subsequent CHMP and European Commission steps, and CAT meeting activity across 2025-2026 continues to reflect active oversight of quality, safety, and post-authorization commitments. In China, the State Council issued Regulations on the Management of Clinical Research and Clinical Translation of New Biomedical Technologies in September 2025, effective May 1, 2026, formalizing requirements for clinical research and translation involving ex vivo cell manipulation and raising standardization expectations for institutional and commercial development pathways.
Competitive Landscape
The car t-cell therapy industry features a moderate concentration: the top five players commanded significant global sales in 2024. Novartis set the original benchmark with Kymriah but is now reinvesting cash flow into next-wave assets for solid tumours. Gilead’s Kite arm is quadrupling worldwide capacity by 2026 to secure leadership in LBCL and mantle-cell lymphoma . Bristol-Myers Squibb capitalises on Abecma’s earlier-line multiple-myeloma approval and is automating production to improve margin.
Strategic partnerships remain the dominant route to innovation. AbbVie pledged up to USD 1.44 billion to Umoja Biopharma for in-situ CAR-T vectors capable of generating modified T-cells inside the patient [2]“AbbVie and Umoja Biopharma Announce Strategic Collaboration to Develop Novel In-Situ CAR-T Cell Therapies,” . BioNTech invested USD 200 million in Autolus to co-commercialise AUTO1/22, diversifying beyond mRNA vaccines. These alliances blend biotech agility with big-pharma scale, accelerating multi-target constructs and solid-tumour applications.
Manufacturing remains the key battleground. Allogene is building a Newark facility capable of commercial-scale allogeneic production with TALEN-edited cells to cut cost and rejection risk. Meanwhile, CARGO Therapeutics is layering an allogeneic platform onto its autologous firi-cel to future-proof cost structure . Firms that lock in vector supply, automate QC and demonstrate outpatient-ready safety are poised to capture outsized growth as the car t-cell therapy market matures.
CAR T-Cell Therapy Industry Leaders
Novartis AG
Bristol-Myers Squibb Company
Johnson & Johnson
Sorrento Therapeutics, Inc.
Gilead Sciences, Inc. (Kite Pharma)
- *Disclaimer: Major Players sorted in no particular order
CAR T-Cell Therapy Market Companies Covered in this Report
- Novartis
- Gilead Sciences
- Bristol-Myers Squibb
- Johnson & Johnson / Legend Biotech
- 2seventy bio Inc.
- Allogene Therapeutics
- Autolus Therapeutics plc
- Caribou Biosciences Inc.
- TCR² Therapeutics Inc.
- Precision BioSciences Inc.
- Sorrento Therapeutics
- Sangamo Therapeutics
- Celyad Oncology SA
- Servier Laboratories
- Miltenyi Biotec B.V. & Co.
- Acro Biosystems
- JW Therapeutics
- Fosun Kite Biotechnology Co.
- Beigene Ltd.
- Gracell Biotechnologies Ltd.

Market Opportunities and Future Outlook
Simplified label and monitoring requirements create near-term whitespace for expanding care settings beyond large academic hospitals. FDA removal of REMS requirements for approved CD19- and BCMA-directed CAR T therapies in June 2025 lowers administrative and workflow barriers that had constrained throughput, supporting broader participation by cancer care treatment centers and hospitals that already account for much of end-user revenue. Parallel label evolution that reduces mandated monitoring windows, including Breyanzi monograph updates in Canada (June 2026) that shortened post-treatment monitoring, supports outpatient and community-site operating models, aligning with the earlier-line use trend reflected in prior FDA actions such as Abecma moving into earlier treatment lines (April 2024).
Manufacturing scale-up and regionalization remain a key opportunity area as vector capacity and high cost-of-goods constrain throughput. Large investments, including Johnson and Johnsons announced more than USD 1 billion commitment to a next-generation cell therapy manufacturing facility in Pennsylvania (2026) and CARsgen Therapeutics agreements to build out a commercial manufacturing base in Jinshan, Shanghai with planned investment up to RMB 370 million (February 2026), point to ongoing efforts to expand supply and reduce lead-times. Technical whitespace is also forming in approaches that bypass ex vivo manufacturing, including in vivo CAR-T concepts using lipid nanoparticle delivery reported in 2026 literature, alongside indication expansion beyond oncology, with CAR-T research activity extending into autoimmune diseases such as systemic lupus erythematosus. At the same time, FDA commentary in 2025 on preferring randomized trials for new approvals increases development cost and trial complexity for new entrants, which elevates the relative value of differentiated manufacturing platforms, site networks, and partners that can execute larger comparative studies.
Recent Industry Developments in CAR T-Cell Therapy Market
- June 2026: Bristol Myers Squibb announced Health Canada approval of an updated BREYANZI product monograph that reduces the post-infusion monitoring period from 28 days to 14 days and shortens driving restrictions from eight weeks to four weeks. The change supports more outpatient-oriented care pathways and improves practical access by lowering time and logistics burdens for patients and treatment centers.
- June 2025: Bristol Myers Squibb reported that the U.S. FDA approved label updates for Breyanzi and Abecma that removed Risk Evaluation and Mitigation Strategy (REMS) requirements. Removing REMS reduces site-level administrative overhead and can expand the number of centers willing and able to deliver CAR T therapy within existing oncology infrastructure.
- July 2024: Johnson and Johnson shared positive overall survival results from the Phase 3 CARTITUDE-4 study evaluating CARVYKTI (ciltacabtagene autoleucel) in relapsed or lenalidomide-refractory multiple myeloma. The readout strengthens the clinical evidence base for earlier-line use in myeloma and supports competitive positioning as payers and providers compare durability across BCMA-targeted options.


CAR T-Cell Therapy Market Report Scope and Research Methodology
Market Definition and Coverage
For this study, the CAR T-cell therapy market means revenues generated from commercially approved CAR-T products used to treat cancer patients, counted at the therapy selling price level and tracked across major treatment geographies.
Scope exclusions: We exclude companion diagnostics, non-CAR adoptive cell therapies, hospital procedure and inpatient service charges, and investigational modalities (such as CAR-NK) that are not marketed therapies.
Segments Covered in This Report
- By Target Antigen
- CD19
- BCMA
- CD22
- GD2
- HER2
- PSMA
- Multi-Target / Tandem
- Others
- By Cell Source
- Autologous
- Allogeneic
- By Product (Approved)
- Abecma
- Breyanzi
- Kymriah
- Tecartus
- Yescarta
- Others
- By Indication
- Leukemia (ALL, CLL)
- Lymphoma (DLBCL & Other B-Cell)
- Multiple Myeloma
- Auto-Immune Disorders
- Others
- By End-User
- Hospitals
- Cancer Care Treatment Centres
- Academic & Research Institutes
- By Geography
- North America
- United States
- Canada
- Mexico
- Europe
- Germany
- United Kingdom
- France
- Italy
- Spain
- Rest of Europe
- Asia-Pacific
- China
- Japan
- India
- South Korea
- Australia
- Rest of Asia- Pacific
- Middle East and Africa
- GCC
- South Africa
- Rest of Middle East and Africa
- South America
- Brazil
- Argentina
- Rest of South America
- North America
Data Sources, Market Sizing, and Validation
Desk Research
Desk work started with mapping the treated patient pool and approval status by country, since CAR-T access is tightly linked to regulatory clearance and certified centers. We referred to public sources such as the US FDA databases, EMA public assessment reports, clinical trial registries (such as ClinicalTrials.gov), cancer incidence statistics from agencies such as the National Cancer Institute and WHO, and payer and health system releases that describe reimbursement and label changes.
To convert the demand signals into value, we also reviewed company annual reports, investor decks, and reputable press coverage for therapy pricing, commercial rollout pacing, and manufacturing capacity expansion. In a few places, we used paid company financials and news databases, and patent databases, mainly to confirm timelines and avoid missing label expansions or supply constraints that can move volumes quickly. These are illustrative examples of desk sources, and many other public references were also used for data collection, validation, and clarification.
Primary Interviews and Surveys
Primary inputs were taken through expert interviews and structured surveys with stakeholders across the care pathway, including clinicians at authorized centers, hospital pharmacy and procurement teams, payers, and therapy commercialization and distribution experts. Since access and pricing differ by region, we ensured the conversations covered Americas, EMEA, and APAC so assumptions around treated patients, time to infusion, and price corridors could be checked and adjusted.
Distribution of primary research fieldwork respondents
| Company type | Respondent position | Region |
|---|---|---|
| Top tier: 25% | CXOs: 16% | APAC: 48% |
| Mid tier: 55% | Functional/Unit leaders: 28% | EMEA: 32% |
| Smaller Players: 20% | Managers: 56% | Americas: 20% |
Market-Sizing & Forecasting
Sizing was built using a top-down demand reconstruction, where incidence and prevalence for eligible indications were narrowed into an addressable cohort using diagnosis rates, line-of-therapy eligibility, referral patterns, and center capacity constraints. To keep the value layer realistic, average selling prices were modeled with list price ranges, typical discounting and rebate behavior, and country-level currency conversion timing, and then tied to expected infusion volumes.
We then used selective bottom-up checks to corroborate totals, mainly by rolling up therapy revenues visible in public filings, sampling per-product volumes in key markets, and sense-checking ASP x treated patients against what centers report as feasible throughput. When country data was thin, proxy ratios were applied from comparable markets, followed by an adjustment once interviews clarified access barriers or reimbursement lag. Forecasting relied on scenario analysis supported by expert consensus on label expansions, additional approved products, manufacturing scale-up, and expected center additions, which together shape both volume growth and ASP progression.
Data Validation & Update Cycle
Outputs were cross-checked against independent signals, such as new approvals, reimbursement updates, manufacturing capacity announcements, and changes in certified center counts, and then reviewed for outliers that did not match the underlying patient pool logic. Where large variances appeared by country, assumptions were re-tested and, if needed, respondents were re-contacted to confirm what changed on access, pricing, or operational throughput.
Each report is refreshed annually, and interim updates are done when material events occur, such as a major label expansion or a meaningful pricing change. Before delivery, a final analyst pass is run so that the figures reflect the latest public updates and validated interview learnings.
Mordor Intelligence's Car T Cell Therapy Market Sizing Compared With Other Published Estimates
Published market values for CAR-T can vary because the market is still shaped by fast approval cycles, changing treatment eligibility, and pricing that differs widely by country and payer. The year used for currency conversion, the point in the value chain where revenue is counted, and how many therapies are treated as commercial versus investigational can each shift the final number.
The biggest gaps usually come from refresh cadence and what gets counted in the price, since some estimates blend hospital administration charges with therapy revenue, or apply a single global price without checking country-level discounting. In this study, the model is refreshed around new approvals, label expansions, and pricing updates, and currency timing is kept consistent with reported commercial periods, which is a key reason the 2026 value lands where it does in Mordor Intelligence.
Benchmark comparison
| Source | Market Size | Gaps in Research Methodology |
|---|---|---|
| Mordor Intelligence | USD 4.77 B (2026) | |
| Trade Journal A | USD 4.56 B (2024) | Uses an earlier base year and can undercount the step-up in treated patients from recent approvals and center additions, and it may apply broad ASP assumptions without consistent currency timing by country. |
| Global Consultancy B | USD 5.50 B (2024) | Likely includes a wider value boundary, where therapy value is mixed with parts of hospital administration and supportive care, and the forecast stance can lean aggressive on near-term adoption and pricing persistence. |
Overall, the spread in published numbers is mostly explained by when prices are translated into USD, whether the revenue is limited to the therapy product, and how quickly models are updated for label and access changes. Our approach keeps the market value tied to a clear treated-patient build and repeatable ASP logic, and then checks it through interviews so the totals stay grounded by region and by real adoption constraints.


Key Questions Answered in the Report
What is the current size of the car t-cell therapy market?
The car t-cell therapy market stands at USD 4.77 billion in 2026 and is projected to reach USD 9.03 billion by 2031.
Which region will grow the fastest through 2031?
Asia-Pacific is expected to post the quickest 15.55% CAGR thanks to expanding clinical trial activity and domestic manufacturing build-outs.
Why are allogeneic CAR-T products attracting attention?
Novartis AG, Bristol-Myers Squibb Company, Johnson & Johnson, Sorrento Therapeutics, Inc. and Gilead Sciences, Inc. (Kite Pharma) are the major companies operating in the Global CAR T-Cell Therapy Market.
Which is the fastest growing region in Global CAR T-Cell Therapy Market?
Asia-Pacific is estimated to grow at the highest CAGR over the forecast period (2026-2031).
Which region has the biggest share in Global CAR T-Cell Therapy Market?
Allogeneic “off-the-shelf” lines cut dose costs by up to 95% and enable immediate treatment, features that can ease payer pressure and improve access.
How are new CPT codes likely to change US adoption?
Effective January 2025, dedicated CPT codes simplify billing for community oncology centres, broadening patient access beyond large academic hospitals.
Page last updated on:


 Your data is secure and never sold or shared.


