
Captive Power Plant Market Size and Share
Market Overview
| Study Period | 2021 - 2031 |
|---|---|
| Market Size (2026) | USD 241.6 Billion |
| Market Size (2031) | USD 323.74 Billion |
| Growth Rate (2026 - 2031) | 6.03 % |
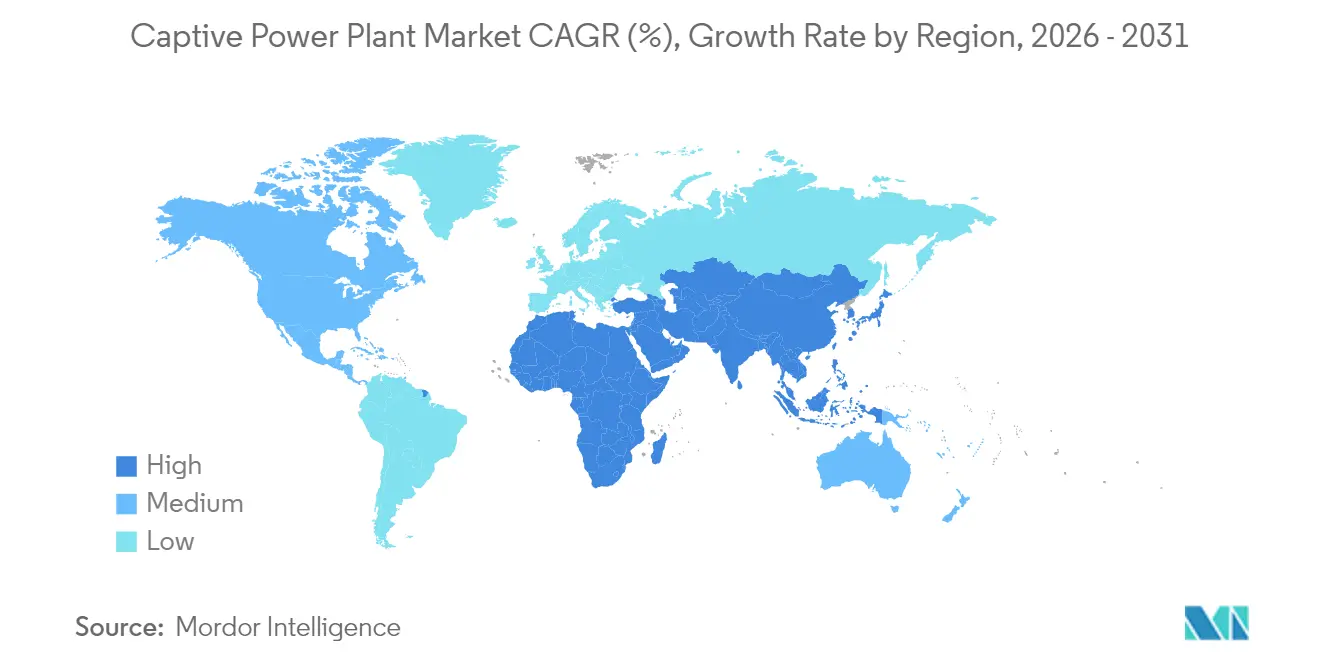
| Fastest Growing Market | Middle East and Africa |
| Largest Market | North America |
| Market Concentration | Medium |
Major Players *Disclaimer: Major Players sorted in no particular order Image © Mordor Intelligence. Reuse requires attribution under CC BY 4.0. | |
Captive Power Plant Market Analysis by Mordor Intelligence
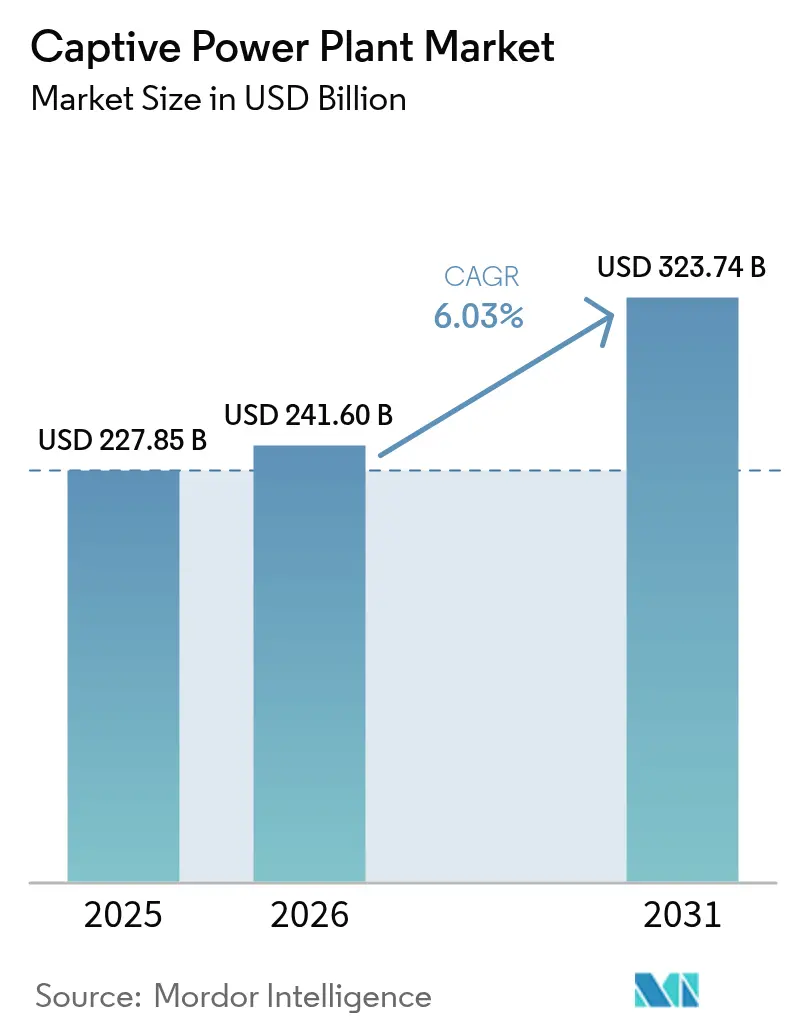
Captive Power Plant market size in 2026 is estimated at USD 241.6 billion, growing from 2025 value of USD 227.85 billion with 2031 projections showing USD 323.74 billion, growing at 6.03% CAGR over 2026-2031.
Rising electricity tariffs, frequent grid disruptions, and data center expansion are prompting industrial firms to internalize generation, thereby shielding operations from price volatility and outages. Companies also view on-site power as a bridge to decarbonization, as hydrogen-ready gas turbines and renewable microgrids can be deployed more quickly than grid-scale upgrades. Supply-chain tightness in turbines and battery systems is lengthening lead times, yet long-term demand remains firm as industrial reshoring, artificial intelligence workloads, and process electrification outpace transmission buildouts. Captive assets thus serve both a risk-mitigation and a regulatory-compliance role, underpinning a broad-based growth trajectory for the captive power plant market.
Key Report Takeaways
- By fuel source, diesel and heavy fuel oil led the captive power plant market with a 37.15% share in 2025, while renewable systems are projected to grow at a 12.05% CAGR through 2031.
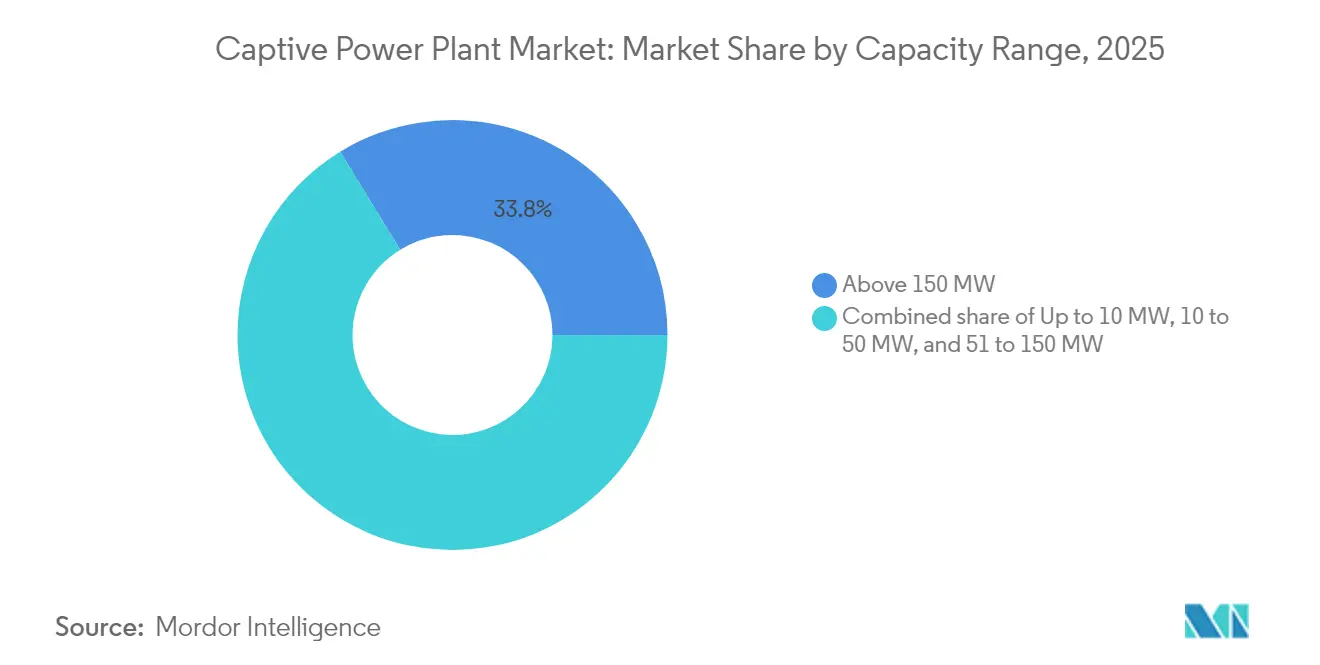
- By capacity range, plants exceeding 150 MW accounted for 33.75% of the captive power plant market size in 2025, while systems with a capacity of up to 10 MW are expected to expand at a 10.86% CAGR through 2031.
- By technology, reciprocating engines held a 28.60% share of the captive power plant market size in 2025, whereas fuel cells and hydrogen systems are projected to advance at a 24.1% CAGR to 2031.
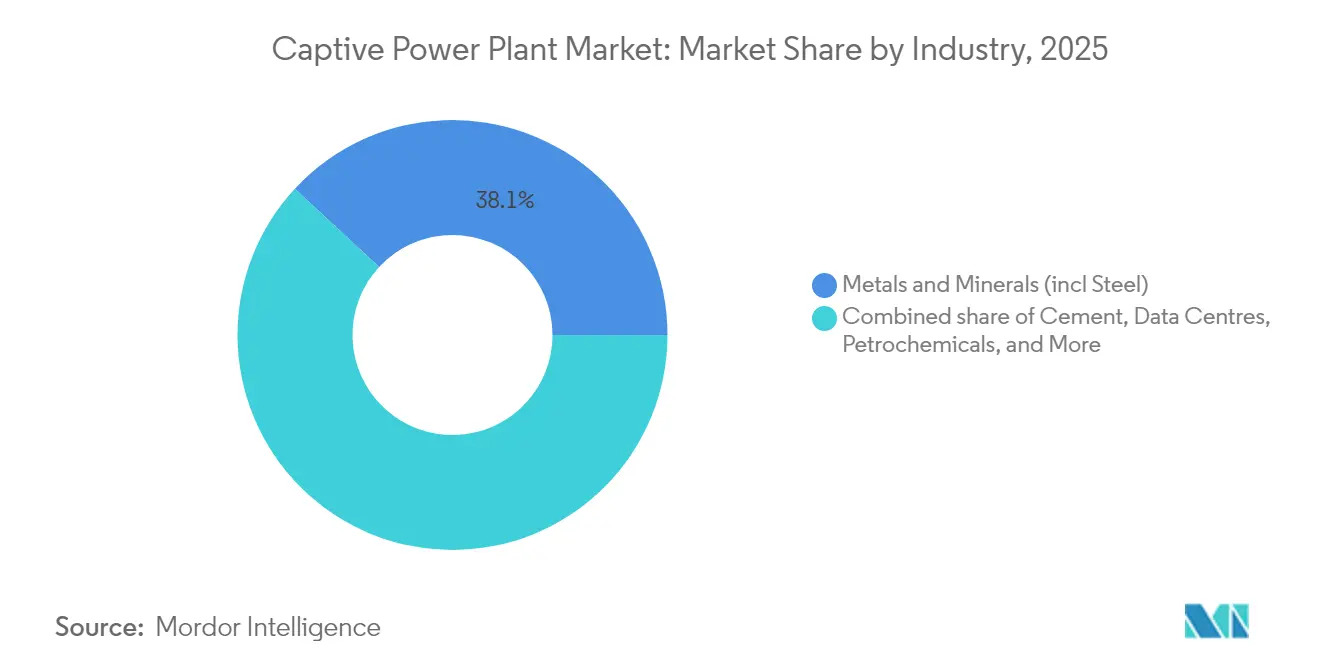
- By industry, metals processing captured 38.10% of the captive power plant market share in 2025, while data centers posted the fastest CAGR at 14.55% through 2031.
- By geography, North America dominated the market with a 36.25% market share in 2025, and the Middle East & Africa region is projected to register a 10.25% CAGR between 2026 and 2031.
Note: Market size and forecast figures in this report are generated using Mordor Intelligence’s proprietary estimation framework, updated with the latest available data and insights as of 2026.
Market Trends and Insights
Drivers Impact Analysis of Captive Power Plant Market*
| Driver | (~) % Impact on CAGR Forecast | Geographic Relevance | Impact Timeline |
|---|---|---|---|
| Growing industrial electricity demand & unreliable grids | 1.80% | Asia-Pacific, Sub-Saharan Africa, global | Medium term (2-4 years) |
| Carbon-reduction push toward gas & renewables | 1.20% | North America, EU, Asia-Pacific | Long term (≥ 4 years) |
| Favourable open-access & wheeling regulations | 0.90% | India, select U.S. states, Latin America | Short term (≤ 2 years) |
| Data-center boom demanding mission-critical power | 1.10% | North America, Northern Europe, Asia-Pacific hubs | Medium term (2-4 years) |
| Hydrogen-ready gas engines cut future compliance risk | 0.70% | EU, Australia, Japan, California | Long term (≥ 4 years) |
| AI-enabled predictive maintenance slashes OPEX | 0.50% | Global (early adoption in developed markets) | Short term (≤ 2 years) |
| Source: Mordor Intelligence | |||
Growing Industrial Electricity Demand & Unreliable Grids
Manufacturing reshoring, AI deployment, and process electrification are increasing industrial loads faster than utilities can build new transmission lines. CSIS projects that U.S. winter-peak demand will climb by 78 GW within a decade, eroding grid reserves and raising the probability of curtailments.[1]CSIS Energy Security Program, “Managing Rising Electricity Demand in the United States,” csis.org Similar supply gaps emerge in Sub-Saharan Africa, where Nigeria generated a record 6,003 MW in 2024 but could dispatch only 5,700 MW on average due to network constraints. Industrial operators, therefore, install on-site plants to avoid lost production and to arbitrage tariffs; in India, captive units deliver power at rates below INR 5/kWh, compared to grid rates of nearly INR 8/kWh. This economic spread, coupled with reliability premiums, reinforces adoption across the captive power plant market.
Carbon-Reduction Push Toward Gas & Renewables
Corporate net-zero pledges are accelerating the shift away from coal and diesel toward natural gas and renewable energy configurations. The U.S. EPA’s pending performance standards require large combustion turbines to meet a 3 ppm NOx limit on gas, effectively forcing the use of selective catalytic reduction for new projects.[2]U.S. Environmental Protection Agency, “Standards of Performance for Stationary Combustion Turbines,” epa.gov Equipment vendors responded with hydrogen-compatible machines; GE Vernova validated 100% H₂ firing on its B- and E-class frames, achieving 4%–7% efficiency gains compared to legacy systems.[3]GE Vernova, “Validated 100% Hydrogen Combustion on B- and E-Class Turbines,” ge.com Field pilots, such as Chevron’s 60% hydrogen blend test in California, prove the pathway’s technical feasibility. These developments lower long-term compliance risks and make low-carbon project financing more accessible, giving further momentum to the captive power plant market.
Favourable Open-Access & Wheeling Regulations
Policy reforms that let industrial consumers buy or sell power across utility networks are improving project economics. India’s Green Energy Open Access Rules reduced the transaction floor from 1 MW to 100 kW and removed inter-state transmission charges for renewable projects commissioned before June 2025.[4]Ministry of Power (India), “Green Energy Open Access Rules 2022,” powermin.gov.in Similar moves in select U.S. states and Latin American markets simplify interconnection for privately owned units. Open access converts once-isolated assets into revenue-earning resources, allowing surplus generation to flow to the grid during low-load periods. The rule changes, alongside banking provisions, shorten payback periods and enlarge the addressable captive power plant market.
Data-Center Boom Demanding Mission-Critical Power
Hyperscale data center demand is forecast to reach 35 GW of U.S. load within five years, with AI clusters seeking sub-$0.05/kWh tariffs and 99.999% uptime. Outages can cost operators millions of dollars per minute, prompting them to build purpose-designed captive power rather than relying solely on grid supply. Nuclear partnerships and hydrogen-ready gas turbines are being evaluated for their carbon-free baseload attributes. NERC is drafting new reliability guidelines tailored to large digital loads, implicitly endorsing self-generation as a means of enhancing resilience. As these facilities multiply, they create a high-value niche that sustains growth in the captive power plant market.
Restraints Impact Analysis of Captive Power Plant Market*
| Restraint | (~) % Impact on CAGR Forecast | Geographic Relevance | Impact Timeline |
|---|---|---|---|
| High CAPEX & OPEX requirements | -1.40% | Emerging markets with tight capital | Medium term (2-4 years) |
| Tightening emission norms on fossil CPPs | -0.80% | EU, California, global expansion | Long term (≥ 4 years) |
| Rise of off-site corporate PPAs | -0.60% | North America, Europe, Australia | Medium term (2-4 years) |
| Turbine/BESS supply-chain bottlenecks | -0.90% | North America, Europe, global | Short term (≤ 2 years) |
| Source: Mordor Intelligence | |||
High CAPEX & OPEX Requirements
Combined-cycle and CHP projects can range from USD 5 million to USD 200 million, and balance-sheet constraints deter small firms despite the attractive long-term savings. Battery storage, vital for renewable microgrids, will only see 18%–52% capital-cost relief by 2035, limiting near-term ROI for many sites. Lease and third-party ownership models exist but add contractual complexity, so penetration remains skewed toward large conglomerates with investment-grade ratings. This financial hurdle curbs the captive power plant market in capital-scarce regions.
Tightening Emission Norms on Fossil CPPs
Selective catalytic reduction installs inflate capital budgets and add ammonia-handling OPEX, raising the breakeven cost of fossil-based projects. Divergent state and country limits for NOx, SOx, and mercury create compliance uncertainty for multi-site operators. The cumulative burden shortens asset life and encourages earlier migration to cleaner fuels, tempering growth for legacy fossil units within the captive power plant industry.
*Our forecasts treat driver/restraint impacts as directional, not additive. The impact forecasts reflect baseline growth, mix effects, and variable interactions.
Captive Power Plant Market Segment Analysis
By Fuel Source:
Diesel Dominance Faces Renewable DisruptionDiesel and heavy fuel oil retained 37.15% of the captive power plant market share in 2025, as legacy generators continue to backstop operations in remote areas where fuel logistics outweigh environmental costs. Renewable options, however, are scaling fastest at a projected 12.05% CAGR, propelled by falling solar-PV prices and corporate decarbonization mandates. Diesel units deliver tried-and-tested reliability and rapid ramping, yet their high operating cost and emissions expose users to carbon penalties, prompting a pivot toward gas and hybrid solar-battery architectures.
Natural-gas plants serve as a transitional technology, bridging the gap between reliability and emission objectives until hydrogen blends become more commonplace. Coal-based captive assets are moving toward strategic retirement, especially in markets with carbon pricing. Hybrid solar-storage projects reach parity with diesel on a levelized-cost basis in island and mining jurisdictions, accelerating fuel switching. These dynamics keep the captive power plant market diversified yet clearly trending toward renewables.
By Capacity Range:
Large-Scale Efficiency Versus Distributed FlexibilityUnits above 150 MW captured 33.75% of the captive power plant market size in 2025, thanks to economies of scale that suit steel, aluminum, and petrochemical clusters. Multi-shaft combined-cycle configurations utilize exhaust heat to generate process steam, thereby increasing overall efficiencies to above 60%.
Installations under 10 MW, although smaller, will clock the fastest 10.86% CAGR as standardized, containerized sets shorten lead times and reduce engineering costs. These micro-plants pair well with rooftop solar and energy-management systems, providing factories with tariff hedges without requiring grid expansion. As distributed energy resource rules evolve, numerous small projects collectively expand the captive power plant market.


By Technology:
Reciprocating Engines Lead While Fuel Cells SurgeReciprocating engines owned 28.60% of 2025 revenue because they handle variable loads and frequent starts better than turbines. Gas turbines dominate continuous-duty base load, but packaged CHP designs create an efficiency edge by capturing exhaust heat. Fuel cells and hydrogen systems are expected to grow at a 24.1% CAGR, driven by policy incentives for green hydrogen under the U.S. Inflation Reduction Act and comparable EU schemes.
Electrical efficiencies above 60% and zero-combustion emissions make fuel cells attractive for data centers and electronics fab powerhouses that crave power quality. Renewable microgrids integrating PV, wind, and lithium-ion storage expand niche applications where footprint constraints and noise limits matter. This innovation mix enriches the captive power plant market’s technology palette.
By Industry:
Metals Dominance Meets Data-Center DynamismMetals and minerals processing accounted for 38.10% of the captive power plant market share in 2025, utilizing process gases and waste heat to create integrated energy loops. Steel plants, for example, recycle blast-furnace gas to cut net fuel purchases and carbon fees. Cement kilns utilize waste-heat-to-power units, enhancing energy self-sufficiency without requiring new fossil fuel input.
Data centers will post a 14.55% CAGR to 2031 as hyperscale sites demand multi-gigawatt power parcels with five-nines reliability. Partnerships such as KKR and ECP’s USD 50 billion program highlight the scale of capital flowing into dedicated generation for AI clusters. This diversification ensures that the captive power plant market taps both heavy-industry incumbents and digital-economy entrants.
Geography Analysis
North America Captive Power Plant Market
North America’s 36.25% share is based on abundant shale gas, sophisticated project finance, and robust demand from data center hubs. U.S. electricity growth of 16% by 2029, confirmed by pipeline interconnection queues, underlines why factory and server-farm operators turn to on-site plants. High turbine backlogs favor early movers with equipment reservations, while Canada and Mexico contribute via mining and automotive investments in regions with constrained transmission.
Europe Captive Power Plant Market
Europe ranks second, characterized by stringent emission caps and generous incentives for cogeneration. Hydrogen-ready gas turbines gain prominence as Brussels targets industrial decarbonization, and combined-heat-and-power rules support integrated sites. Market participation mechanisms allow surplus power sales, further monetizing projects.
MEA and APAC Captive Power Plant Market
The Middle East & Africa region heads global growth at a 10.25% CAGR, fueled by industrial diversification and isolated resource projects. Governments deploy captive solar-plus-storage systems at mining camps and industrial zones, while natural-gas-rich Gulf states invest in hydrogen-ready turbines to meet load growth without derailing climate goals. Asia-Pacific’s momentum rests on China and India, where captive generation supplies 14% of total industrial consumption and often beats utility tariffs by a wide margin. As grids strain, self-generation fills the gap, enlarging the captive power plant market.

Regulatory Landscape
Captive power policy is tightening around definitional clarity and verification, with the changes aimed at high-growth industrial markets. In India, the Ministry of Power notified the Electricity (Amendment) Rules, 2026 (substituting Rule 3 of the Electricity Rules, 2005), reaffirming core captive-qualification tests such as minimum 26% ownership by the captive user and at least 51% aggregate annual consumption for captive use, with certain compliance sub-rules taking effect from April 2026. The rules also formalize verification by load-dispatch institutions, routing single-state captive compliance to state-level authorities and inter-state projects to the National Load Despatch Centre (NLDC), which reduces ambiguity for group captive and open-access structures.
Decarbonization-linked rules and standards continue to influence technology choices for on-site generation. In the U.S., the Environmental Protection Agency (EPA) performance standards referenced in the report context, including a 3 ppm NOx limit for new large combustion turbines on gas, raise the compliance bar for fossil captive assets and increase the role of abatement equipment such as selective catalytic reduction. In India, the integration of energy storage into captive-rule definitions supports round-the-clock captive models by allowing stored energy to retain captive character, improving the bankability of hybrid renewable microgrids for commercial and industrial users.
Competitive Landscape
The captive power plant market is moderately fragmented. General Electric, Siemens Energy, and Wärtsilä anchor turbine and engine supply, leveraging extensive service portfolios. Renewable developers such as Capton Energy and Enerwhere focus on solar-plus-storage for off-grid sites, while Bloom Energy and INNIO promote high-efficiency fuel-cell and gas-engine platforms.
Strategic investment vehicles are scaling; ADQ and Energy Capital Partners formed a USD 25 billion U.S. joint venture in 2025, targeting natural-gas and hybrid projects that serve data centers. Equipment makers differentiate themselves through their readiness for hydrogen and digital service layers that reduce downtime. Supply-chain bottlenecks favor vertically integrated players who can secure long-lead components.
White-space opportunities include waste-heat recovery, which could displace 9% of U.S. industrial energy while cutting costs 10%–20%. Firms that combine process integration with financing expertise are well-positioned to capture market share as customers increasingly favor turnkey energy-as-a-service models. This competitive dynamic continues to widen the addressable captive power plant market.
Captive Power Plant Industry Leaders
General Electric Company
Wartsila Oyj Abp
Siemens AG
Caterpillar Inc.
Mitsubishi Heavy Industries Ltd.
- *Disclaimer: Major Players sorted in no particular order

Captive Power Plant Market Companies Covered in this Report
- General Electric Company
- Siemens AG
- Wärtsilä Oyj Abp
- Caterpillar Inc.
- Mitsubishi Heavy Industries Ltd.
- Bharat Heavy Electricals Ltd.
- Kohler Co.
- Cummins Inc.
- ABB Ltd.
- Schneider Electric SE
- INNIO (GE Jenbacher)
- Capstone Green Energy Corp.
- Tata Power Renewable Energy
- AMP Solar Group Inc.
- JSW Energy Ltd.
- Vedanta Ltd.
- Jindal Steel & Power Ltd.
- ArcelorMittal SA
- Adani Power Ltd.
- Capital Power Corp.
- Rolls-Royce Holdings plc (mtu)
- Clarke Energy
- APR Energy
- MAN Energy Solutions SE

Market Opportunities and Future Outlook
A clear opportunity sits where tighter captive qualification rules intersect with the expansion of mission-critical power for digital infrastructure. India's Electricity (Amendment) Rules, 2026 provide more explicit guardrails on ownership and consumption thresholds and define verification pathways (state authorities for intra-state and NLDC for inter-state), which supports scalable group captive and open-access implementations for manufacturers and large industrial campuses. On the demand side, AI-driven data center growth is translating into large, dedicated generation commitments, illustrated by Babcock & Wilcox receiving full notice to proceed in March 2026 on a USD 2.4 billion agreement with Base Electron to construct 1.2 GW of natural gas-fired generation intended to supply Applied Digital AI data centers.
Another near-term opportunity is hybridization and fuel switching for incumbent captive fleets, as industrials and suppliers respond to decarbonization constraints without waiting for transmission upgrades. Recent actions such as Wärtsilä's fuel-conversion upgrade enabling natural gas operation at a captive engine-based cement plant in Jordan and Mitsubishi Power's July 2026 boiler-supply contract supporting heavy oil-to-natural gas conversion at existing plants in Saudi Arabia point to practical pathways for emissions and OPEX reduction while keeping on-site reliability. Consolidation and financing channels for multi-site C&I programs are also active, including AMPYR Distributed Energy's July 2026 acquisition of a 70 MW commercial and industrial solar portfolio from TotalEnergies.
Recent Industry Developments in Captive Power Plant Market
- July 2026: NALCO and NLC India sign a joint venture to develop a 1,080 MW thermal captive power plant at Anugola, Odisha, linked to NALCO's aluminum smelter expansion. The project highlights how energy-intensive industries are locking in large blocks of captive capacity to reduce power-availability risk and cost during expansion cycles.
- March 2026: Atlas Energy Solutions disclosed a Global Framework Agreement with Caterpillar covering approximately 1.4 GW of incremental power generation assets, including natural gas reciprocating gensets for behind-the-meter deployments. The scale and standardization of genset procurement supports faster rollout of modular captive capacity for industrial users facing grid constraints.
- June 2024: DCM Shriram reported commencement of operations of its 120 MW captive power plant. Commissioning large onsite capacity adds resilience for continuous-process industrial operations and illustrates ongoing investment in self-generation where tariff and reliability considerations justify dedicated assets.


Captive Power Plant Market Report Scope and Research Methodology
Market Definition and Coverage
For this study, the captive power plant market covers revenue linked to power generation assets set up mainly to supply electricity (and sometimes useful heat) to the same owner or a defined user site, whether run fully off-grid or in parallel with the grid.
Scope exclusions: Standalone utility-scale generation that is built primarily for merchant sale into the grid is excluded, even if an industrial customer is a major off-taker.
Segments Covered in This Report
- By Fuel Source
- Coal
- Natural Gas
- Diesel/HFO
- Renewable (Solar, Wind, Biomass, WHR)
- Hybrid and Others
- By Capacity Range
- Up to 10 MW
- 10 to 50 MW
- 51 to 150 MW
- Above 150 MW
- By Technology
- Gas Turbine
- Reciprocating Engine
- Combined Heat and Power (CHP)
- Renewable Microgrid (PV/Wind + BESS)
- Fuel Cells/Hydrogen
- By Industry
- Cement
- Metals and Minerals (incl Steel)
- Petrochemicals
- Data Centres
- Pulp and Paper
- Others
- By Geography
- North America
- United States
- Canada
- Mexico
- Europe
- Germany
- United Kingdom
- France
- Italy
- Russia
- Rest of Europe
- Asia-Pacific
- China
- India
- Japan
- South Korea
- ASEAN Countries
- Rest of Asia-Pacific
- South America
- Brazil
- Argentina
- Rest of South America
- Middle East and Africa
- Saudi Arabia
- United Arab Emirates
- South Africa
- Egypt
- Rest of Middle East and Africa
- North America
Data Sources, Market Sizing, and Validation
Desk Research
Desk research was used to build the basic market structure and to keep assumptions tied to observable energy signals. We referred to public sources such as IEA country power statistics, US EIA datasets, World Bank indicators, UN Comtrade trade flows for power equipment, and IRENA publications for renewable and distributed generation context.
In addition, company annual reports, investor presentations, project announcements, and reputable press coverage were screened to understand how captive projects are being justified and financed, and what fuel switching patterns look like across industries. Where it improved consistency, we also used paid subscriptions for company financials and intelligence, shipment and trade level checks, and patent lookups to validate technology direction. The sources listed here are illustrative, and many other references were used during data collection, validation, and clarification.
Primary Interviews and Surveys
Primary interviews and surveys were used to test what we saw in public data, especially around project sizing logic, fuel selection, and how grid-parallel captive plants treat surplus export in contracts. We spoke with a mix of asset owners, engineering and operations leaders, and channel participants across key demand regions so assumptions on utilization, commissioning timelines, and cost pass-through could be adjusted before finalizing totals.
Distribution of primary research fieldwork respondents
| Company type | Respondent position | Region |
|---|---|---|
| Top tier: 32% | CXOs: 14% | APAC: 41% |
| Mid tier: 52% | Functional/Unit leaders: 40% | EMEA: 33% |
| Smaller Players: 16% | Managers: 46% | Americas: 26% |
Market-Sizing & Forecasting
Sizing was built using a top-down approach where industrial electricity demand patterns and captive adoption signals were used to reconstruct the addressable revenue pool by region, and then split by fuel and end-user use cases. To keep totals practical, we also used selective bottom-up approximations, like sampling typical project sizes and multiplying by observed build activity, followed by checks on implied spending per MW for common configurations.
Key inputs included industrial power consumption growth, grid reliability and tariff direction (which influence captive economics), announced capacity additions and retirements, fuel price spreads between coal, gas, diesel, and renewables, and utilization assumptions that vary by industry intensity. Because project execution can shift quickly, scenario analysis was used for the forecast, with base, conservative, and accelerated cases discussed with interviewees and then translated into commissioning ramps and revenue recognition patterns. When bottom-up visibility was weaker in smaller countries, gaps were handled using proxy indicators such as industrial output indices and power deficit frequency, and the estimates were then rebalanced at the regional level.
Data Validation & Update Cycle
Outputs were cross-checked against independent signals, including implied captive capacity build rates, fuel mix realism, and whether the modeled spend aligns with typical EPC and equipment cost ranges seen in public disclosures. Variance checks were run to flag countries where revenue growth looked too high versus industrial activity, and those cases were reviewed again. Where the driver could not be explained from available evidence, we completed targeted re-contacts with experts.
Each report goes through multi-step analyst review before sign-off, and key assumptions are compared year over year so abrupt jumps are justified by a traceable event, such as a policy change, fuel price shock, or a major commissioning wave. The report is refreshed annually, with interim updates when material events occur, and a final pre-delivery review is completed so clients receive an up-to-date view.
Mordor Intelligence's Captive Power Plant Market Size Measured Against Other Published Estimates
Published market sizes for captive power plants can differ even when they appear to cover the same topic, because firms are not always counting the same revenue items or using the same timing for project commissioning and currency conversion.
The gap usually comes from scope choices around whether grid-parallel plants are counted only for behind-the-meter supply, how surplus export revenue is treated, and whether the model is anchored to industrial demand signals versus a broader power generation spending pool. The table also reflects differences in base year selection and forecast window, which can change the reported current size even before any growth assumptions are applied.
Benchmark comparison
| Source | Market Size | Gaps in Research Methodology |
|---|---|---|
| Mordor Intelligence | USD 241.60 B (2026) | |
| Industry Publisher A | USD 251.50 B (2025) | Uses a different base year and tends to expand the scope with extra segmentation like capacity range and technology that can pull in adjacent distributed generation spending not strictly tied to captive use at a specific site. |
| Industry Publisher B | USD 207.80 B (2024) | Relies on an earlier base year and a shorter forecast window, and it can understate newer build activity when commissioning ramps and grid-parallel revenue treatment are not updated frequently. |
The table shows a spread that is mainly explained by timing and what gets counted as captive revenue. In Mordor Intelligence's model, grid-parallel plants are included only when the primary intent is on-site supply, with surplus export treated as secondary. When those boundaries are applied consistently and checked against industrial demand and build signals, the market total can be traced back to clear variables and repeatable steps.


Key Questions Answered in the Report
What is the projected value of the captive power plant market by 2031?
The captive power plant market size is forecast to reach USD 323.74 billion by 2031 from USD 241.6 billion in 2026, growing at a 6.03% CAGR between 2026-2031.
Why are industrial companies investing in captive power plants instead of relying on the grid?
On-site generation offers tariff savings, shields operations from outages, and helps firms meet decarbonization targets faster than waiting for grid upgrades.
What fuels dominate today’s captive power installations?
Diesel and heavy fuel oil still lead with 37.15% share in 2025, yet renewable systems record the highest growth at a 12.05% CAGR through 2031.
How big is the data-center opportunity for the captive power plant market?
Data centers are expected to grow at a 14.55% CAGR, driving multi-gigawatt demand for mission-critical, low-carbon power solutions by 2031.
Are hydrogen-ready gas turbines commercially available?
Yes. GE Vernova validated 100% hydrogen combustion on standard frames and plans commercial rollout by 2026, giving operators a future-proof option.
What are the main barriers to setting up a captive power plant?
High upfront capital, tightening emission regulations for fossil units, supply-chain delays for turbines and batteries, and the availability of off-site PPAs all constrain adoption.
Which region will expand fastest over the forecast period?
The Middle East & Africa region is projected to post a 10.25% CAGR to 2031 on the back of industrial diversification and remote-site energy needs.
Page last updated on:


 Your data is secure and never sold or shared.


