
Capacitive Ceramic Pressure Sensors Market Size and Share
Market Overview
| Study Period | 2020 - 2031 |
|---|---|
| Market Size (2026) | USD 1.14 Billion |
| Market Size (2031) | USD 1.61 Billion |
| Growth Rate (2026 - 2031) | 7.18 % |
| Fastest Growing Market | Asia Pacific |
| Largest Market | North America |
| Market Concentration | Medium |
Major Players *Disclaimer: Major Players sorted in no particular order Image © Mordor Intelligence. Reuse requires attribution under CC BY 4.0. | |
Capacitive Ceramic Pressure Sensors Market Analysis by Mordor Intelligence
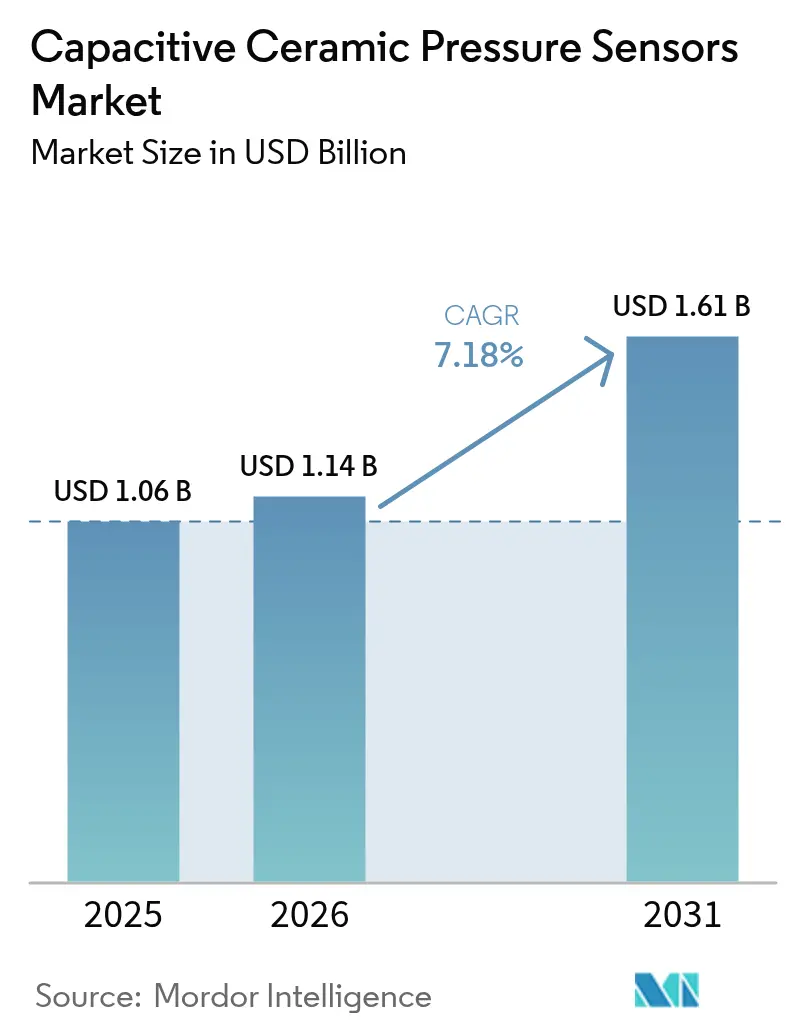
The capacitive ceramic pressure sensors market size is expected to grow from USD 1.06 billion in 2025 to USD 1.14 billion in 2026 and is forecast to reach USD 1.61 billion by 2031 at 7.18% CAGR over 2026-2031. Growth stems from regulatory mandates for tire pressure monitoring systems, post-pandemic expansion in critical medical equipment, and Industry 4.0 upgrades that favor sensors able to withstand heat, vibration, and corrosive media. Automotive electrification adds further momentum as high-voltage battery packs require pressure feedback immune to electromagnetic interference. Healthcare equipment suppliers continue shifting toward ceramic diaphragms to meet long-duration accuracy and biocompatibility standards. Process industries deploy ceramic devices in wireless networks where low drift reduces recalibration cycles, while early green-hydrogen projects specify them for electrolyzer safety.
Key Report Takeaways
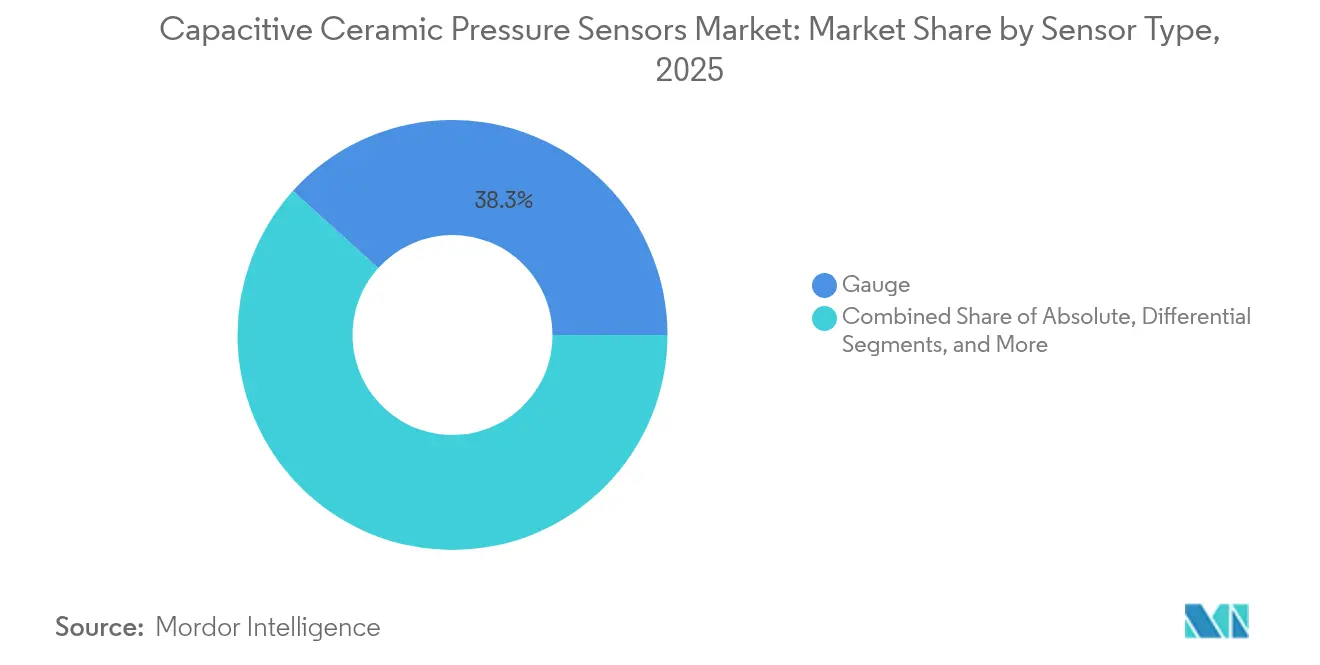
- By sensor type, gauge variants delivered 38.32% revenue share of the capacitive ceramic pressure sensors market in 2025; differential sensors record the fastest CAGR at 7.96% through 2031.
- By application, automotive and transportation held 41.25% of capacitive ceramic pressure sensors market share in 2025, whereas medical and healthcare is advancing at an 8.06% CAGR through 2031.
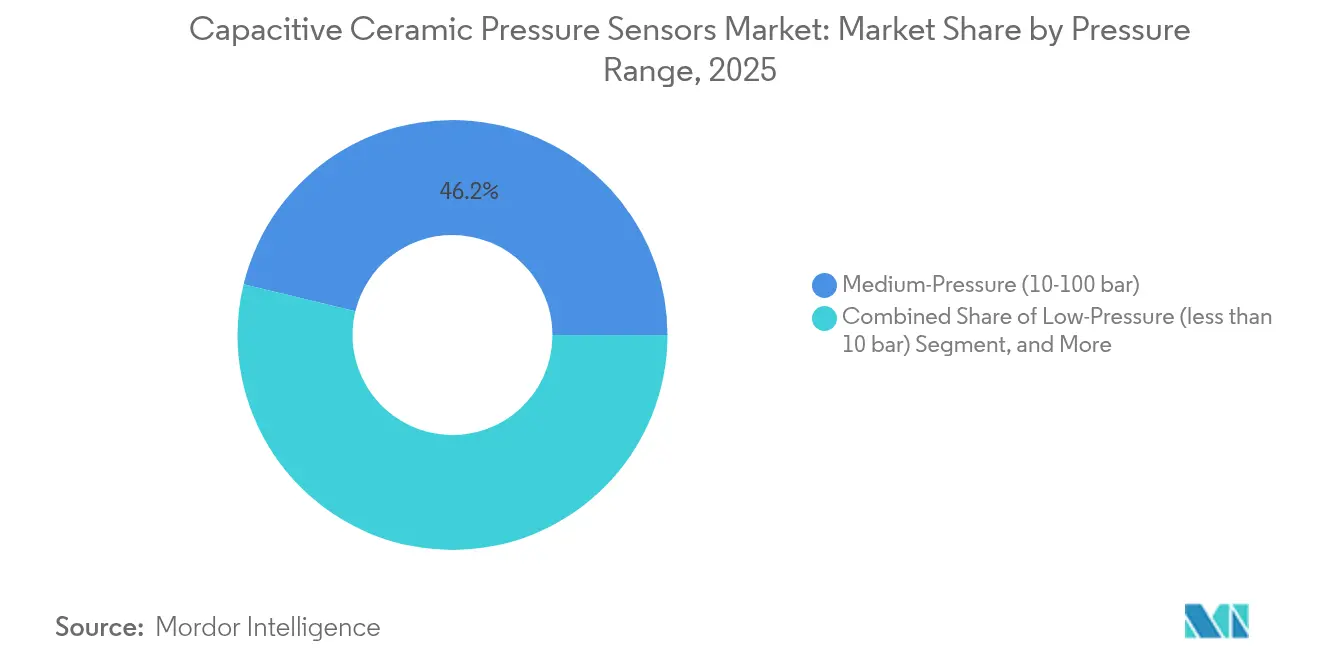
- By pressure range, medium-pressure devices accounted for 46.20% of the capacitive ceramic pressure sensors market size in 2025, while low-pressure models are projected to grow at an 8.24% CAGR between 2026-2031.
- By end-use industry, automotive OEMs accounted for 35.25% of the capacitive ceramic pressure sensors market size in 2025, while medical device manufacturers are projected to grow at an 7.71% CAGR between 2026-2031.
- By geography, North America captured 38.40% of the capacitive ceramic pressure sensors market size in 2025, whereas Asia-Pacific leads growth at an 7.97% CAGR to 2031
Note: Market size and forecast figures in this report are generated using Mordor Intelligence’s proprietary estimation framework, updated with the latest available data and insights as of 2026.
Market Trends and Insights
Drivers Impact Analysis of Capacitive Ceramic Pressure Sensors Market*
| Driver | (~) % Impact on CAGR Forecast | Geographic Relevance | Impact Timeline |
|---|---|---|---|
| Regulatory mandates for TPMS and engine management in next-gen vehicles | +1.8% | Global, with early adoption in North America and EU | Medium term (2-4 years) |
| Industry 4.0 retrofits demanding rugged, corrosion-resistant sensors | +1.2% | APAC core, spill-over to North America | Long term (≥ 4 years) |
| Post-pandemic boom in ventilators and infusion pumps | +1.5% | Global, concentrated in established medical device hubs | Short term (≤ 2 years) |
| Ceramic sensors' high-temperature and chemical-resistance edge | +0.9% | Global, particularly in harsh industrial environments | Long term (≥ 4 years) |
| Electro-lyzer pressure monitoring for green-hydrogen plants | +0.7% | EU, APAC, with emerging presence in North America | Medium term (2-4 years) |
| Chiplet-based sensor-fusion modules for EV battery packs | +0.6% | APAC manufacturing centers, global deployment | Medium term (2-4 years) |
| Source: Mordor Intelligence | |||
Regulatory mandates for TPMS drive automotive integration
Safety rules such as FMVSS 138 in the United States and ECE R64 in Europe require tire pressure monitoring in every new passenger vehicle, locking in stable demand for robust sensing solutions. Ceramic capacitive elements preserve calibration from -40 °C to +125 °C, whereas silicon MEMS variants drift above +85 °C. Electric-vehicle makers additionally install ceramic units in sealed battery enclosures to monitor pack pressure during rapid charging events that create thermal spikes. The move toward 800 V powertrains elevates electromagnetic interference, yet ceramic devices exhibit lower intrinsic noise than semiconductor alternatives, helping automakers protect data integrity. In 2024, automotive OEMs accounted for 35.83% of global offtake, underscoring the segment’s volume influence.
Industry 4.0 retrofits accelerate industrial sensor adoption
Factories modernizing under Industry 4.0 connect established controllers with digital feedback loops and predictive-maintenance software. Ceramic capacitive sensors ship with 4-20 mA and IO-Link outputs, enabling rapid plant-wide installation without rewiring legacy input cards. Corrosion-proof diaphragms minimize unplanned downtime caused by caustic cleaners or acidic process media. As analytics platforms rank sensor stability above lowest piece-price, ceramic units benefit from life-cycle savings that outweigh higher purchase cost. Wireless gateways exploit their low leakage current to extend battery life in remote assets. Industrial OEMs now form the second-largest buyer cohort, particularly in chemical and pulp-and-paper lines operating up to 500 °C.
Post-pandemic medical device expansion boosts precision requirements
Ventilator shipments surged in 2024-2025, cementing ceramic capacitive devices as the reference technology for airway pressure loops where sub-1 % total error band is mandatory. FDA 21 CFR 820 and ISO 13485 emphasize long-term drift below 0.25% full scale, specifications regularly met by alumina-based diaphragms. Biocompatibility and protein-fouling resistance favor ceramics in hemodialysis pumps and infusion controllers. Market growth extends into home-health respiratory aids, where portable units rely on ceramic stability to cut service calls. Medical and healthcare revenue is tracking an 8.34% CAGR to 2030, the fastest among all end-use categories.
Ceramic sensors’ high-temperature and chemical-resistance edge
Many refineries, smelters, and food-sterilization autoclaves expose instrumentation to 400 °C gas streams, acid steams, and abrasive slurries. Alumina diaphragms retain Young’s modulus and dielectric constant across this span, allowing linear output without complex compensation circuitry. Chemical inertness avoids chlorine-induced pinholes that plague metallic or polymer diaphragms. Semiconductor MEMS chips, by contrast, require exotic passivation layers that add cost and still degrade under cyclic heat. As asset managers prioritize uptime, total cost of ownership tilts toward ceramic platforms even if initial list price runs 3-4 times higher than MEMS. This resilience edge contributes roughly 0.9 percentage points to forecast CAGR.
Restraints Impact Analysis of Capacitive Ceramic Pressure Sensors Market*
| Restraint | (~) % Impact on CAGR Forecast | Geographic Relevance | Impact Timeline |
|---|---|---|---|
| Cost-competition from piezoresistive MEMS alternatives | -1.4% | Global, particularly in cost-sensitive applications | Short term (≤ 2 years) |
| High tooling and calibration cost of ceramic capacitive lines | -0.8% | Manufacturing centers in APAC and Europe | Medium term (2-4 years) |
| Supply-risk of high-purity alumina feedstock | -0.6% | Global supply chain, concentrated risk in APAC | Long term (≥ 4 years) |
| EMI issues in 800-V EV platforms | -0.5% | EV manufacturing regions, primarily APAC and Europe | Medium term (2-4 years) |
| Source: Mordor Intelligence | |||
Cost competition from silicon MEMS alternatives pressures pricing
High-volume MEMS fabs ship basic piezoresistive sensors below USD 5, whereas ceramic capacitive units often list between USD 15-50 depending on range and certification tier.[1] Consumer IoT buyers frequently accept tighter temperature deratings to hit aggressive bill-of-materials targets. While ceramics hold favor in harsh settings, downward price pressure forces makers to streamline LTCC firing cycles and automate final calibration. Some vendors now co-package thin-film signal conditioners to eliminate external electronics and trim module cost.
High ceramic manufacturing costs limit market penetration
Low-temperature co-fired ceramic stacks demand furnace dwell times above 850 °C, specialized molybdenum metallization, and precision lapping equipment. A new gauge-pressure production line can exceed USD 0.5 million in capital outlay, a hurdle that discourages new entrants. Multi-point temperature calibration also remains labor-intensive because dielectric constants vary batch-to-batch. Although scale economies help majors dilute fixed costs over millions of parts, smaller firms struggle to match the price curves set by integrated MEMS producers. Until automated optical test platforms mature, this restraint could shave 0.8 percentage points off long-term CAGR.
*Our forecasts treat driver/restraint impacts as directional, not additive. The impact forecasts reflect baseline growth, mix effects, and variable interactions.
Capacitive Ceramic Pressure Sensors Market Segment Analysis
By Sensor Type:
Gauge Sensors Anchor Automotive DemandGauge devices accounted for 38.32% of the capacitive ceramic pressure sensors market in 2025, reflecting wide deployment in tire pressure monitoring, brake hydraulics, and industrial compressors. The capacitive ceramic pressure sensors market size for gauge designs stood at USD 0.41 billion the same year and is projected to expand steadily as electric-vehicle makers integrate in-wheel pressure nodes. Automotive compliance cycles drive steady, high-volume bids, enabling suppliers to amortize their tooling investments. In parallel, the rollout of smart meters by water utilities is creating incremental demand for gauges, as submerged installations favor ceramic corrosion immunity.
Differential variants are projected to advance at an 7.96% CAGR through 2031, driven by HVAC filter monitoring and fuel-cell stack management. These devices exploit the inherent linearity of capacitive plates to resolve sub-20 Pa pressure drops, a key metric in medical ventilators. Absolute and sealed sensors together occupy a modest niche but gain relevance in altitude drones and deep-well pumping. Across the broader capacitive ceramic pressure sensor market, technology vendors are increasingly bundling digital ASICs inside stainless housings to simplify installation.

By Application:
Automotive Holds Scale while Medical Leads GrowthAutomotive and transportation dominated revenue with 41.25% share in 2025, underpinned by statutory TPMS inclusion and emerging battery-pack pressure loops. Vehicle architectures adopting 800 V inverters generate electromagnetic fields that ceramic sensors tolerate without signal distortion, protecting traction-control algorithms. Rail operators also specify ceramic diaphragms for brake-line safety in alpine routes where -40 °C ambient is routine.
Medical and healthcare spending accelerates fastest at an 8.06% CAGR to 2031, fueled by intensive-care ventilators, infusion pumps, and dialysis circuits that demand zero drift over thousands of sterilization cycles. The capacitive ceramic pressure sensors market size for medical equipment is predicted to reach USD 0.32 billion by 2031, translating into meaningful supply contracts for firms holding ISO 13485 lines. Long-term home respiratory therapy and remote monitoring further widen the revenue funnel as aging populations seek outpatient options.
Industrial automation remains a resilient third pillar. Plants handling sulfuric acid, ammonia, or hydrogen sulfide migrate to ceramic inserts because polymer MEMS coatings blister under chemical attack. Consumer wearables adopt miniature ceramic chips for barometric altitude, though volumes remain modest versus automotive.
By Pressure Range:
Medium-Pressure Tier Leads, Low-Pressure SurgesSensors rated 10-100 bar secured 46.20% of capacitive ceramic pressure sensors market share in 2025 as they align with brake systems, hydraulic jacks, and general industrial pneumatics. In this bracket, ceramics outperform metal-foil gauges at extreme ambient swings, cutting warranty claims for heavy-duty trucks.
Low-pressure devices below 10 bar are progressing at an 8.24% CAGR, amplified by smart-building diff-pressure loops and IoT weather stations. Here, ceramic capacitors achieve resolutions better than 0.01% full scale, enabling precise airflow balancing in cleanrooms. High-pressure models up to 700 bar target hydrogen storage drums for fuel-cell vehicles, green-hydrogen pipeline trials, and oilfield downhole telemetry.
By End-Use Industry:
OEM Integration Sets the PaceOriginal automotive manufacturers represented 35.25% of total shipments in 2025, and most seek Tier-1 suppliers able to deliver AEC-Q100 qualified sensors with functional-safety documentation. Integrated assembly at the factory line ensures optimal routing and shields against aftermarket fitment errors. The capacitive ceramic pressure sensors industry also serves industrial OEMs building chemical reactors, utility meters, and packaging machines, many of whom embed sensors into proprietary modules.
Medical OEMs constitute the fastest-growing buyer group at a 7.71% CAGR. Their purchasing patterns prioritize supplier audit trails, sterilization evidence, and biocompatibility certificates. Utilities and energy developers embracing hydrogen electrolysis also contract directly with sensor makers for high-pressure variants, while contract electronics manufacturers handle volume board-level integration for smart-home brands.
Geography Analysis
North America Capacitive Ceramic Pressure Sensors Market
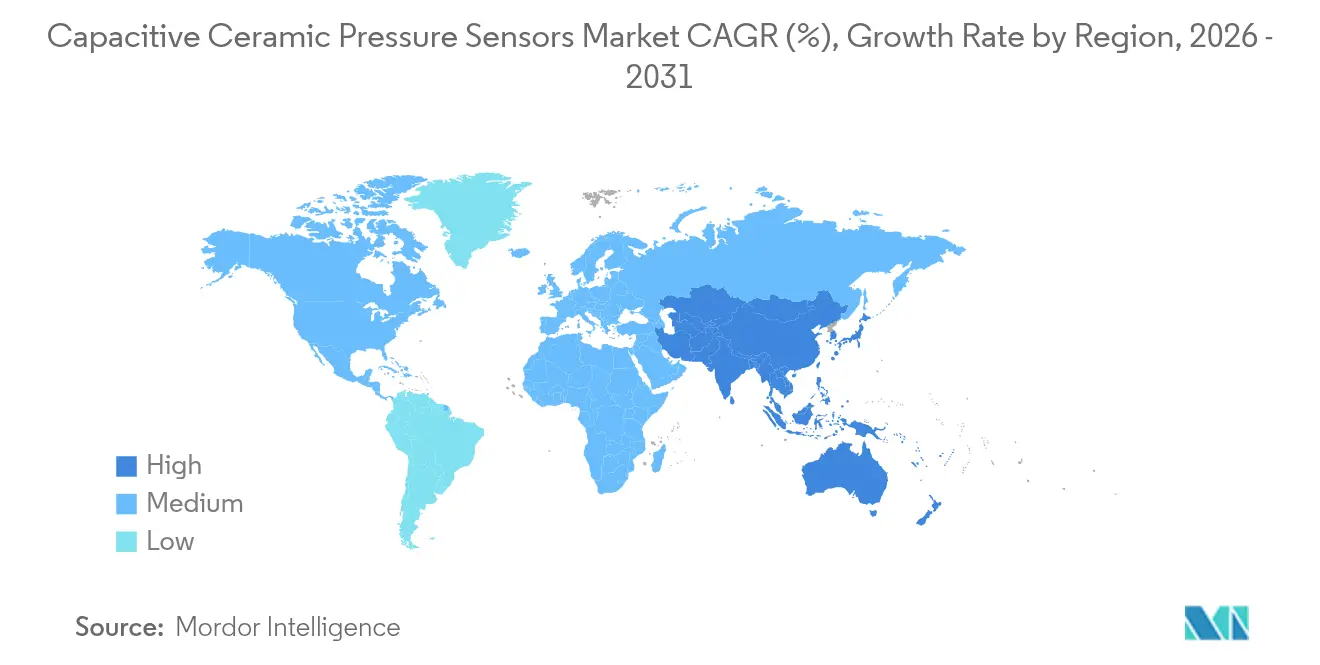
North America held 38.40% of global sales in 2025 and remains the single largest region thanks to early TPMS legislation, entrenched medical-device clusters, and substantial electric-vehicle output. U.S. sensor suppliers leverage DOE grants targeting hydrogen supply chains to pilot 700 bar ceramic assemblies. Canada’s cold-weather truck market values ceramic consistency at -30 °C, supporting domestic Tier-2 fabrication.
EMEA and APAC Capacitive Ceramic Pressure Sensors Market
Asia-Pacific is the growth engine at 7.97% CAGR. China’s EV leaders such as BYD embed ceramic nodes inside blade-battery modules to monitor gas formation during fast charging. Japan’s robotics integrators specify alumina diaphragms for six-axis arms that sanitize with pressurized steam. South Korea channels public subsidies into green-hydrogen hubs where electrolyzer stacks operate near 30 bar and demand ceramic reliability. Europe sustains a solid share through German automotive giants Bosch and Continental, which co-develop ceramic chips for next-generation driver-assistance platforms. Scandinavia deploys sensors in offshore wind turbine gearboxes exposed to salt spray and oscillating load cycles. Middle East refiners adopt ceramic packages for sulfur recovery units running above 400 °C, while Africa’s mining firms experiment with ceramic telemetry in acid leach pads.
Regulatory Landscape
Regulation and standards in this market center on automotive safety mandates, functional safety in process instrumentation, and material compliance for global shipment. In automotive, TPMS requirements such as FMVSS 138 (United States) and ECE R64 (Europe) keep pressure sensing embedded in new-vehicle platforms, supporting sustained qualification and validation cycles for sensor suppliers.
In industrial automation, capacitive ceramic pressure sensors used inside transmitters and safety loops commonly align to IEC 61508:2010 for functional safety (SIL targeting depends on system architecture), alongside diagnostic and interoperability expectations in process plants that follow NAMUR guidance such as NE107 for self-monitoring. On the product-compliance side, EU market access frequently requires adherence to RoHS Directive 2011/65/EU and REACH (EC) No 1907/2006, reflected in supplier documentation such as Metallux AG's April 2026 update for its CPS 2184 ceramic pressure cell. In controls applications, the IEC published the fourth edition of IEC 60730-2-6:2025 (pressure-sensing controls), creating a new reference point for mechanical and safety requirements that vendors and integrators map into design files and conformity assessments over the standard cycle.
Value Chain Analysis
Upstream inputs include high-purity alumina (commonly around 99.9% Al2O3) and associated dielectric materials, plus metallization and conductive coatings used to form electrodes and terminations. Core manufacturing spans ceramic forming and sintering, thick-film or thin-film deposition, precision lapping and finishing, bonding or soldering the ceramic membrane to the base, and multi-point calibration and test. Because particulate contamination can affect long-term stability, cleanroom-controlled assembly is a defining step for higher-end capacitive ceramic cores; Endress+Hauser Sensors and Components highlighted cleanroom manufacturing for its Ceracore USC30 series in February 2026.
Midstream participants include sensor-core producers and module makers that add ASICs, housings, connectors, and interfaces (for example, 4-20 mA, IO-Link, or digital variants), followed by qualification workflows aligned to end-market requirements (for example, IATF 16949 in automotive supply chains and ISO 9001 or ISO 13485 where applicable). Downstream routes run through industrial automation OEMs, automotive Tier suppliers and OEMs, medical device manufacturers, and distributors for general instrumentation. Key bottlenecks sit in high-temperature furnace capacity, yield management across ceramic batches, and labor- and equipment-intensive calibration, while raw-material risk concentrates around consistent availability of high-purity alumina that controls dielectric losses and drift.
Competitive Landscape
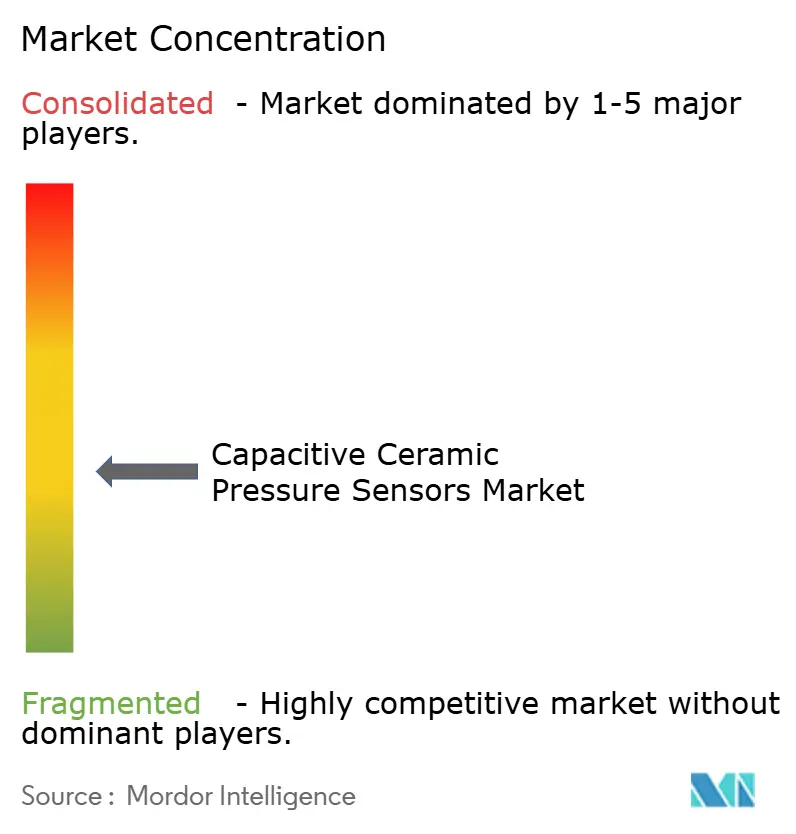
The capacitive ceramic pressure sensors market is moderately fragmented; the five largest vendors hold roughly 50% collective share, leaving ample room for mid-tier specialists. Established multinationals differentiate through broad certification portfolios, vertically integrated LTCC lines, and global application-engineering teams. Niche players compete on custom diaphragm alloys, hermetic feedthroughs, and miniaturized form factors.
Strategic moves center on digital interface upgrades, package ruggedization, and regional production footprints that hedge geopolitical supply risks. Sensata debuted a water-meter sensor with ten-year lithium battery life, targeting utilities facing non-revenue water losses. Bosch Sensortec expanded its gel-filled barometric family for swim-proof wearables, exploiting ceramic resistance to chlorine exposure. Start-ups such as Peratech chase keyboard and haptic markets with quantum-tunneling films that offer capacitive-like performance but lower thickness profiles.
Patent filings increasingly address multilayer sealing rings, autonomous self-calibration algorithms, and EMI-hardened ASIC layouts. Supply-chain conversations focus on alumina purity above 99.7% to limit dielectric loss tangent, with some firms inking long-term offtake contracts to stabilize cost curves. Overall competition balances premium-priced performance against commoditizing volumes in IoT, ensuring sustained innovation.
Capacitive Ceramic Pressure Sensors Industry Leaders
-
Vega Americas Inc.
-
Nanjing Jiucheng Technology Co. Limited
-
Sensata Technologies Holding PLC(Impress Sensors and Kavlico Corporation)
-
Metallux SA
-
Angst+Pfister Sensors and Power AG
- *Disclaimer: Major Players sorted in no particular order
Capacitive Ceramic Pressure Sensors Market Companies Covered in this Report
- Sensata Technologies Holding plc
- Metallux SA
- Vega Americas, Inc.
- Pewatron AG
- BD|SENSORS GmbH
- Angst+Pfister Sensors and Power AG
- Nanjing Jiucheng Technology Co. Limited
- Baumer Electric AG
- ifm electronic gmbh
- Sitron Sensores Industriais Ltda.
- Shenzhen Amperon Technology Co., Ltd.
- Suzhou Novosense Microelectronics Co., Ltd.
- TE Connectivity Ltd.
- STMicroelectronics N.V.
- Bosch Sensortec GmbH
- Honeywell International Inc.
- Amphenol Advanced Sensors
- Infineon Technologies AG
- NXP Semiconductors N.V.
- Shanghai Camozzi Automation Co., Ltd.
- WIKA Alexander Wiegand SE and Co. KG
- ABB Ltd.
- Emerson Electric Co.
- Analog Devices, Inc.
- Endress+Hauser Group Services AG
Read Analysis of Capacitive Ceramic Pressure Sensors Companies
Market Opportunities and Future Outlook
White-space is building around ruggedized, application-specific ceramic capacitive designs where users prioritize stability, overload resistance, and chemical inertness over lowest sensor cost. Construction and off-highway hydraulics illustrate this pull: in May 2026, Endress+Hauser described use of its Ceracore UTC30 capacitive ceramic pressure transducer in construction machinery to handle vibration, pressure peaks, and aggressive media, signaling an active pathway for suppliers that can package ceramic cores into compact, shock-tolerant modules with simplified field service.
A second opportunity area is deeper integration into digitalized plants and fleets, where sensor value is tied to diagnostics and connectivity rather than only the pressure reading. Industrial deployments already emphasize self-monitoring and interoperability (for example, NAMUR-oriented diagnostic behavior in process environments), and the market shows ongoing movement toward intelligent modules that embed signal conditioning and digital interfaces suitable for IIoT and retrofit upgrades. Opportunities also come with design constraints that support differentiation, including EMC hardening in electrically noisy platforms (including higher-voltage EV subsystems), and manufacturing approaches that reduce recalibration burden through improved drift performance and controlled cleanroom assembly.
Recent Industry Developments in Capacitive Ceramic Pressure Sensors Market
- January 2026: Sensata Technologies issued an end-of-life notification (EOL-KAV-250131) for select Kavlico pressure sensor families. The change forces program managers to qualify alternates or redesign sensor footprints in affected platforms, creating near-term re-sourcing activity for pressure-sensing modules.
- October 2025: VEGA Americas announced the grand opening of a 120,000 sq ft expansion at its Mason, Ohio headquarters, described as doubling production capacity and enabling domestic manufacturing of electronic components previously imported from Germany. The expanded footprint supports faster lead times and supply continuity for instrumentation customers in North America.
- May 2024: VEGA Americas broke ground on an expansion at its Mason (North American Corp HQ) site. The project signaled a multi-year capacity and localization push that strengthens regional supply for sensor-integrated instrumentation and related electronics.
Capacitive Ceramic Pressure Sensors Market Report Scope and Research Methodology
Market Definition and Coverage
This market covers the revenue generated from capacitive ceramic pressure sensors sold for measuring pressure in equipment and systems across industrial, automotive, medical, and other end uses. The sizing is done in USD for the global demand and supply activity tied to these sensors.
Scope exclusions: It excludes non-ceramic capacitive designs, non-capacitive pressure sensing technologies, and aftermarket service revenue that is not directly linked to sensor sales.
Segments Covered in This Report
- By Sensor Type
- Absolute
- Gauge
- Differential
- Sealed
- By Application
- Automotive and Transportation
- Marine Systems
- Electric and Hybrid Vehicles
- Industrial
- Food and Beverage Processing
- HVAC and Refrigeration
- Energy and Chemical
- Industrial Robotics and Factory Automation
- Medical and Healthcare
- Respiratory and Ventilation Equipment
- Hemodialysis and Infusion Pumps
- Consumer Electronics and IoT
- Other Applications (Aerospace, Smart Agriculture)
- Automotive and Transportation
- By Pressure Range
- Low-Pressure (less than 10 bar)
- Medium-Pressure (10-100 bar)
- High-Pressure (above 100 bar)
- By End-Use Industry
- Automotive OEMs
- Industrial OEMs
- Medical Device Manufacturers
- Process Industries
- Utilities and Energy
- ODMs / Contract Manufacturers
- By Geography
- North America
- United States
- Canada
- Europe
- Germany
- United Kingdom
- France
- Italy
- Spain
- Rest of Europe
- Asia-Pacific
- China
- Japan
- India
- South Korea
- ASEAN
- Rest of Asia-Pacific
- Middle East and Africa
- Middle East
- Saudi Arabia
- United Arab Emirates
- Turkey
- Rest of Middle East
- Africa
- South Africa
- Egypt
- Rest of Africa
- Middle East
- South America
- Brazil
- Mexico
- Argentina
- Rest of South America
- North America
Data Sources, Market Sizing, and Validation
Desk Research
Desk work started by mapping where capacitive ceramic pressure sensors are used, and how demand typically shifts across industrial automation, vehicles, and medical devices. For trade flows and product context, we referenced public sources including the US Census Bureau trade statistics, UN Comtrade, Eurostat, and ISO and IEC publications that reflect relevant sensor and safety expectations.
To keep the assumptions grounded, we also used regulatory and safety publications tied to automotive sensing, government manufacturing output indicators, and peer reviewed papers on ceramic diaphragm and capacitive sensing performance limits. In parallel, we reviewed company filings, product catalogs, investor presentations, and credible press coverage to confirm product positioning, typical pressure range coverage, and observed price direction. Where needed, we used a paid subscription for company financials and patent intelligence selectively to cross-check activity signals. These desk sources are not exhaustive, and additional public references were also used for data collection, validation, and clarification during the research.
Primary Interviews and Surveys
Primary discussions were used to stress-test what the desk model assumed about ceramic sensor penetration, average selling price movement, and the practical split between high accuracy and ruggedized use cases. We spoke with a mix of manufacturers, component specialists, system integrators, and large buyers, and we ensured coverage across the main demand regions so gaps in public data could be closed and assumptions could be triangulated.
Distribution of primary research fieldwork respondents
| Company type | Respondent position | Region |
|---|---|---|
| Top tier: 34% | CXOs: 12% | APAC: 50% |
| Mid tier: 51% | Functional/Unit leaders: 39% | EMEA: 31% |
| Smaller Players: 15% | Managers: 49% | Americas: 19% |
Market-Sizing & Forecasting
Sizing was built mainly through a top-down demand reconstruction, where industrial production signals, automotive sensor fitment trends, and medical device build activity were translated into an addressable demand pool for capacitive ceramic pressure sensors. After shaping that pool, we applied adoption rates and pricing logic aligned with ceramic diaphragm use in higher temperature and harsh environment applications, since these are where these sensors tend to be specified.
To keep the totals realistic, results were corroborated with selective bottom-up checks using sampled supplier revenue splits, channel feedback on unit volumes, and sampled ASP times estimated shipment volumes for a few core applications. Inputs tracked included pressure range mix (low versus higher MPa ranges), share of absolute versus gauge versus differential usage, replacement and maintenance cycles in industrial settings, typical qualification timelines in automotive and medical programs, and regional manufacturing output direction. For forecasting, we ran scenario analysis around industrial capex cycles and automotive electrification pace. The final line was then smoothed with an exponential trend where primary inputs pointed to stable pricing and steady penetration. When bottom-up pieces were missing, we used conservative ranges and only expanded totals when more than one signal moved in the same direction.
Data Validation & Update Cycle
Checks were run at multiple stages so the market size did not rely on a single data series or one interview view. Model outputs were compared against independent indicators such as import trends for related sensor categories, manufacturing output direction by region, and the expected pace of automation investments, and we reviewed any large variances before sign-off.
If an assumption created an unusual jump in share, price, or regional mix, we rechecked the underlying drivers and re-contacted the relevant experts to confirm what had changed and what had not. Reports are refreshed annually, and interim updates are made when a material event impacts demand or supply. Before delivery, we review the latest public releases again so the final numbers reflect the most recent information available.
Mordor Intelligence's Capacitive Ceramic Pressure Sensors Market Estimate Compared With Other Published Estimates
Published market sizes for capacitive ceramic pressure sensors often do not align because scope lines are drawn differently and input variables are not always handled the same way. Differences usually come from what is counted as a qualifying ceramic capacitive sensor, which end uses are included, and how prices are converted and carried across years.
It also depends on whether a study uses broad sensor categories and then allocates a share, or whether it is built from a demand pool tied to adoption indicators such as industrial output, vehicle sensing content, and medical equipment production. When refresh timing is slow, earlier pricing and macro assumptions can stay in the model longer than they should, which can make the current year appear higher or lower than the active market reality in core application categories.
Benchmark comparison
| Source | Market Size | Gaps in Research Methodology |
|---|---|---|
| Mordor Intelligence | USD 1.06 B (2025) | |
| Global Consultancy A | USD 2.10 B (2024) | Uses a broader grouping and segment set (for example, mixing absolute, gauge, and differential categories across wider end uses), which can pull in adjacent pressure sensing revenue that is not strictly capacitive and ceramic at the point of sale. |
| Industry Publisher B | USD 1.68 B (2024) | Builds a wider material and application view, and it can include non-ceramic materials and additional device types before applying shares, which typically lifts the starting value versus a tighter product-only scope. |
The table shows a clear spread between 2024 and 2025 baselines. In Mordor Intelligence's model, the value is counted only for capacitive ceramic pressure sensors sold as discrete sensing components, rather than being expanded through broader pressure sensor groupings or mixed-material definitions. With the scope kept consistent and then checked against adoption and pricing signals, the resulting market size stays easier to trace back to repeatable demand drivers.
Key Questions Answered in the Report
What CAGR is projected for capacitive ceramic pressure sensors between 2026-2031?
The global capacitive ceramic pressure sensors market is forecast to grow at 7.18% during 2026-2031.
Which region is expected to post the fastest revenue growth?
Asia-Pacific leads with an anticipated 7.97% CAGR through 2031 driven by electric-vehicle production and hydrogen investments.
Why are ceramic sensors preferred over silicon MEMS in TPMS?
Ceramic diaphragms retain accuracy from -40 °C to +125 °C and resist electrolyte corrosion, key for long-life tire sensors.
What application segment is growing quickest?
Medical and healthcare devices show the fastest expansion at an 8.06% CAGR due to ventilators and infusion pumps.
Which pressure range currently dominates demand?
Sensors rated 10-100 bar hold the largest share at 46.20% thanks to automotive hydraulics and industrial pneumatics.