
Market Overview
| Study Period | 2021 - 2031 |
|---|---|
| Market Size (2026) | USD 33.30 Billion |
| Market Size (2031) | USD 43.98 Billion |
| Growth Rate (2026 - 2031) | 5.72 % |
| Fastest Growing Market | Asia Pacific |
| Largest Market | Europe |
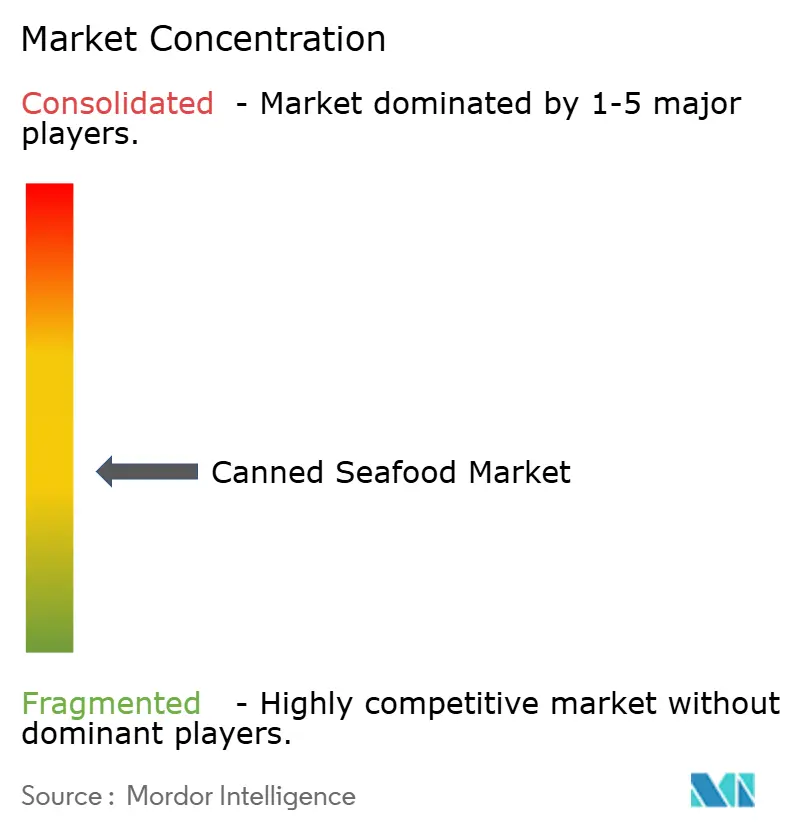
| Market Concentration | Medium |
Major Players *Disclaimer: Major Players sorted in no particular order Image © Mordor Intelligence. Reuse requires attribution under CC BY 4.0. | |
Canned Seafood Market Analysis by Mordor Intelligence
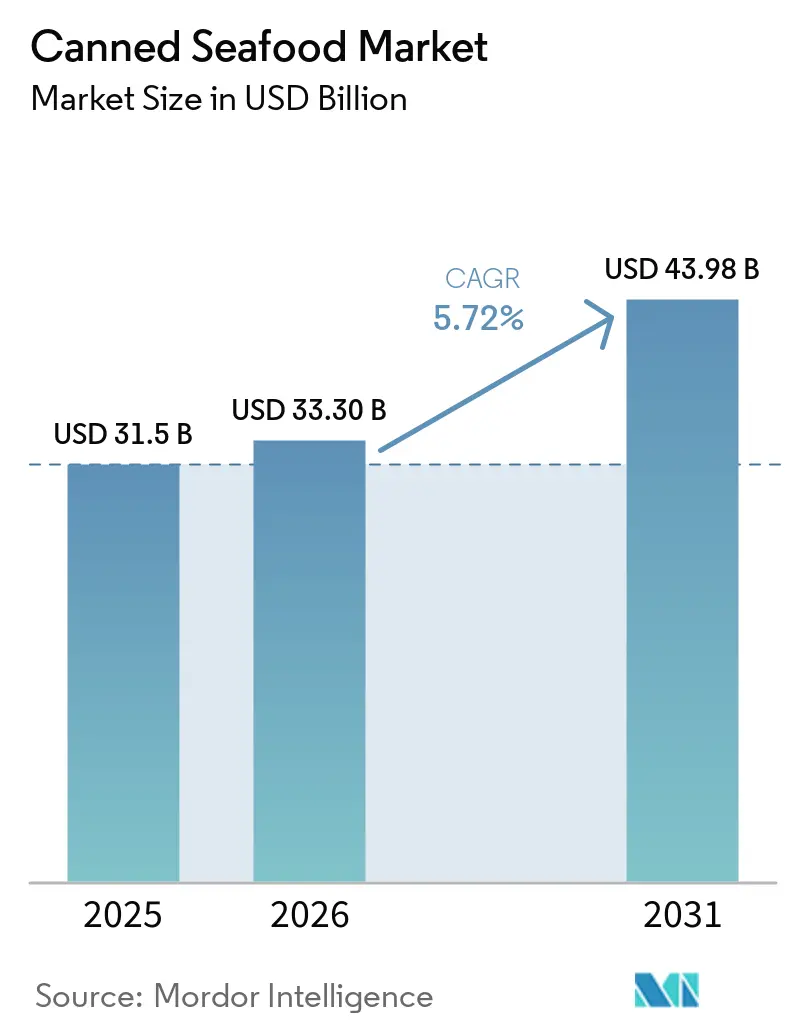
The Canned Seafood Market size was valued at USD 31.5 billion in 2025 and estimated to grow from USD 33.3 billion in 2026 to reach USD 43.98 billion by 2031, at a CAGR of 5.72% during the forecast period (2026-2031). Market growth is primarily driven by rising demand for convenient, shelf-stable protein options that support quick meal preparation and long-term storage. Health-conscious consumers favor canned tuna, salmon, and sardines for their high omega-3 content, nutritional benefits, and clean-label appeal. With global food prices rising, canned seafood also stands out as an affordable and reliable protein source that maintains its quality year-round. Advances in packaging, including BPA-free linings, easy-open lids, and retort pouches, have enhanced safety and convenience. Meanwhile, digital marketing efforts, including social media and influencer collaborations, are successfully engaging younger audiences and showcasing the versatility of canned fish products.
Key Report Takeaways
- By species, canned tuna led with 52.62% of canned seafood market share in 2025; canned shrimp is forecast to expand at a 6.23% CAGR through 2031.
- By packaging material, steel cans held 77.65% share of the canned seafood market in 2025, while retort pouches post the highest projected CAGR at 7.25% to 2031.
- By product form, chunks and pieces accounted for 53.80% of the canned seafood market size in 2025; whole fish formats are advancing at an 7.85% CAGR through 2031.
- By distribution channel, off-trade captured 59.82% revenue share in 2025; on-trade is set to grow fastest at 6.85% CAGR to 2031.
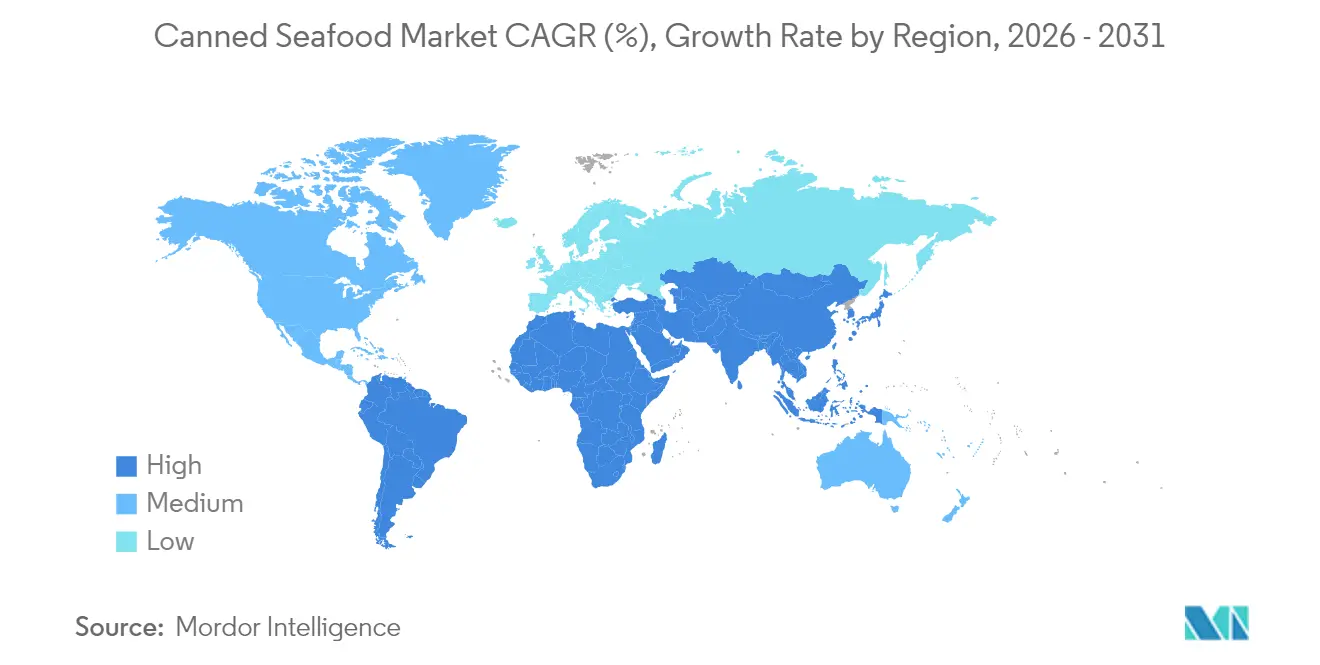
- By geography, Europe commanded 33.85% of the canned seafood market share in 2025, whereas Asia-Pacific will climb at 5.88% CAGR between 2026-2031.
Note: Market size and forecast figures in this report are generated using Mordor Intelligence’s proprietary estimation framework, updated with the latest available data and insights as of 2026.
Market Trends and Insights
Drivers Impact Analysis of Canned Seafood Market*
| Driver | (~) % Impact on CAGR Forecast | Geographic Relevance | Impact Timeline |
|---|---|---|---|
| Convenience attributes and extended shelf life capabilities | +1.2% | Global, with strongest impact in North America and Europe | Medium term (2-4 years) |
| Premium "on-the-go" seafood snacking trend | +0.8% | North America, Europe, urban Asia-Pacific | Short term (≤ 2 years) |
| Demand generation through urbanization and fast-paced lifestyles | +1.5% | Asia-Pacific core, spill-over to Latin America and MEA | Long term (≥ 4 years) |
| Protein-rich food products driven by health consciousness | +1.0% | Global, particularly North America and Europe | Medium term (2-4 years) |
| Ambient storage capability in markets with limited cold chain infrastructure | +0.9% | Africa, parts of Asia-Pacific, Latin America | Long term (≥ 4 years) |
| Consumer purchase decisions influenced by sustainability certifications | +0.7% | Europe, North America, urban centers globally | Medium term (2-4 years) |
| Source: Mordor Intelligence | |||
Convenience Attributes and Extended Shelf life Capabilities in Canned Seafood
The combination of busy lifestyles and supply chain reliability concerns has established canned seafood as a key pantry staple in global food markets. Consumers increasingly seek protein sources that reduce preparation time while maintaining essential nutritional value, including omega-3 fatty acids, protein, vitamins B12 and D, and minerals such as zinc, iron, and selenium. The extended shelf life of 2-5 years provides significant food security benefits that fresh alternatives cannot match, particularly in regions with limited or inconsistent cold chain infrastructure. During supply chain disruptions, such as natural disasters, transportation challenges, or global health crises, canned seafood functions as a reliable protein reserve for households, emergency response organizations, food banks, military operations, and institutional buyers. The ability to store at room temperature eliminates refrigeration costs and reduces food waste throughout the distribution chain, offering substantial economic benefits to both retailers and consumers. This storage flexibility also enables retailers to maintain larger inventories without additional cold storage investments, while providing consumers with a convenient, long-lasting protein source that requires minimal preparation and storage space.
Premium "on-the-go" Seafood Snacking Trend
The influence of social media, particularly among Generation Z consumers, has transformed canned seafood from a basic commodity into a lifestyle product, increasing demand for premium products with higher profit margins. This shift has expanded the market beyond traditional consumer segments, reaching younger, urban professionals, food enthusiasts, and health-conscious individuals seeking convenient protein sources. Companies can now position their products as artisanal offerings rather than emergency food items, as demonstrated by Fishwife's revenue growth through premium positioning and direct-to-consumer sales. Premium brands capitalize on this by offering diverse species like sardines, mackerel, and specialty tuna, along with distinct flavors such as smoked paprika, lemon herb, and chili oil, complemented by refined packaging that attracts both food enthusiasts and health-conscious buyers. The market growth potential is supported by increasing seafood consumption among younger consumers, social media-driven food education, sustainability concerns, nutritional awareness, and developing brand loyalty that persists beyond social media trends, establishing canned seafood as a permanent part of modern dining habits and meal preparation routines.
Urbanization and Fast-paced Lifestyles
Urbanization reshapes food consumption patterns, driven by tighter schedules and broader access to diverse protein sources. As traditional fishing communities shift to urban jobs and modern lifestyles, emerging markets see a rise in canned seafood consumption. Urban challenges, such as limited storage in apartments, unpredictable meal times due to work, and shortened cooking periods from lengthy commutes, make shelf-stable proteins an appealing daily nutrition choice. This trend is pronounced in the Asia-Pacific, where swift urbanization and a growing middle class fuel a demand for convenient, nutritious, ready-to-eat foods. According to World Bank data from 2023, Japan boasts a 95% urban population, followed by China at 65% and India at 35%, underscoring the region's diverse urbanization stages.[1] The urban population's acceptance of premium pricing for convenience supports market expansion beyond rural areas, driven by higher disposable incomes and changing lifestyle preferences. This market dynamic is particularly notable in rapidly developing markets such as China and India, where the pace of urbanization exceeds infrastructure development, creating substantial opportunities for shelf-stable food products that offer both convenience and nutritional value.
Protein-rich Food Products Driven by Health Consciousness
Factors like protein quality, omega-3 content, and mercury levels increasingly shape consumer choices in the seafood market. As a result, canned seafood has transitioned from a mere protein substitute to a sought-after premium nutrition source. The Marine Stewardship Council (MSC) reports that consumers not only prioritize products with verified sustainability claims but are also ready to pay a premium for certified options. This trend underscores a growing health consciousness that spans personal well-being and environmental stewardship. The MSC Fisheries Standard, which sets sustainability benchmarks, emphasizes three core principles: fishing from healthy stocks, adopting long-term management practices, and reducing ecosystem impact. Over 400 wild-capture fisheries globally proudly hold this certification[2]. Such a landscape presents lucrative opportunities for brands that can substantiate their nutritional claims and environmental commitments through credible third-party certifications. Companies like Safe Catch are leading the charge, adopting mercury testing protocols that surpass FDA benchmarks. The trend's longevity is further underscored by demographic shifts: aging populations are gravitating towards functional nutrition, while younger consumers are increasingly demanding transparency with clean-label products.
Restraints Impact Analysis of Canned Seafood Market*
| Restraint | (~) % Impact on CAGR Forecast | Geographic Relevance | Impact Timeline |
|---|---|---|---|
| Market growth potential impacted by raw material price fluctuations | -0.8% | Global, particularly affecting import-dependent regions | Short term (≤ 2 years) |
| BPA-free can-lining mandates raising conversion costs | -0.4% | North America and Europe primarily | Medium term (2-4 years) |
| Purchase decisions affected by sodium content and preservative concerns | -0.5% | Global, strongest in health-conscious markets | Medium term (2-4 years) |
| Market expansion challenged by fresh seafood preferences | -0.6% | Developed markets with robust cold chain infrastructure | Long term (≥ 4 years) |
| Source: Mordor Intelligence | |||
Market growth Potential Impacted by Raw Material Price Fluctuations
Raw material price fluctuations significantly impact profit margins, requiring processors to balance profitability against market share. Small processors are particularly vulnerable due to limited vertical integration capabilities and inadequate hedging mechanisms for commodity risk management. European processors face challenges from supply chain disruptions and geopolitical tensions, which increase input costs while energy prices rise. The industry's dependence on imports in key markets like Europe increases its vulnerability. According to the European Commission, higher prices led to a decreased in at-home fresh seafood consumption in 2023.[3] Moreover, Vietnam's seafood industry exemplifies challenges, with raw material shortages in shrimp and tuna production due to disease outbreaks and regulatory requirements affecting export growth despite strong international demand. Price fluctuations impact species segments differently, with premium products like salmon experiencing higher price sensitivity compared to commodity species like sardines, affecting portfolio management strategies.
Market Expansion Challenged by Fresh Seafood Preferences
The strong consumer preference for fresh seafood in developed markets with established cold chain infrastructure limits the market penetration of canned seafood, particularly among higher-income consumers who associate freshness with quality. This trend is evident in markets like Japan, where consumers continue to prefer fresh formats over processed options, even amid rising prices for fresh salmon. According to the Ministry of Internal Affairs and Communications (Japan), the Consumer Price Index (CPI) for fish and seafood increased by 26.4 points in 2024 compared to the base year 2020.[4] This preference for fresh seafood presents challenges for canned seafood manufacturers attempting to expand into premium market segments, where profit margins are higher but consumer resistance is more significant. Retail data indicates that while canned seafood sales rose during economic downturns, fresh seafood sales rebounded as economic conditions improved, indicating that canned products serve as temporary alternatives rather than permanent consumer choices. However, this market dynamic presents opportunities for premium canned seafood brands that can address the freshness bias through enhanced product quality, diverse species offerings, and effective marketing strategies that position canned seafood as a distinct category rather than a substitute for fresh products.
*Our forecasts treat driver/restraint impacts as directional, not additive. The impact forecasts reflect baseline growth, mix effects, and variable interactions.
Canned Seafood Market Segment Analysis
By Species/Type:
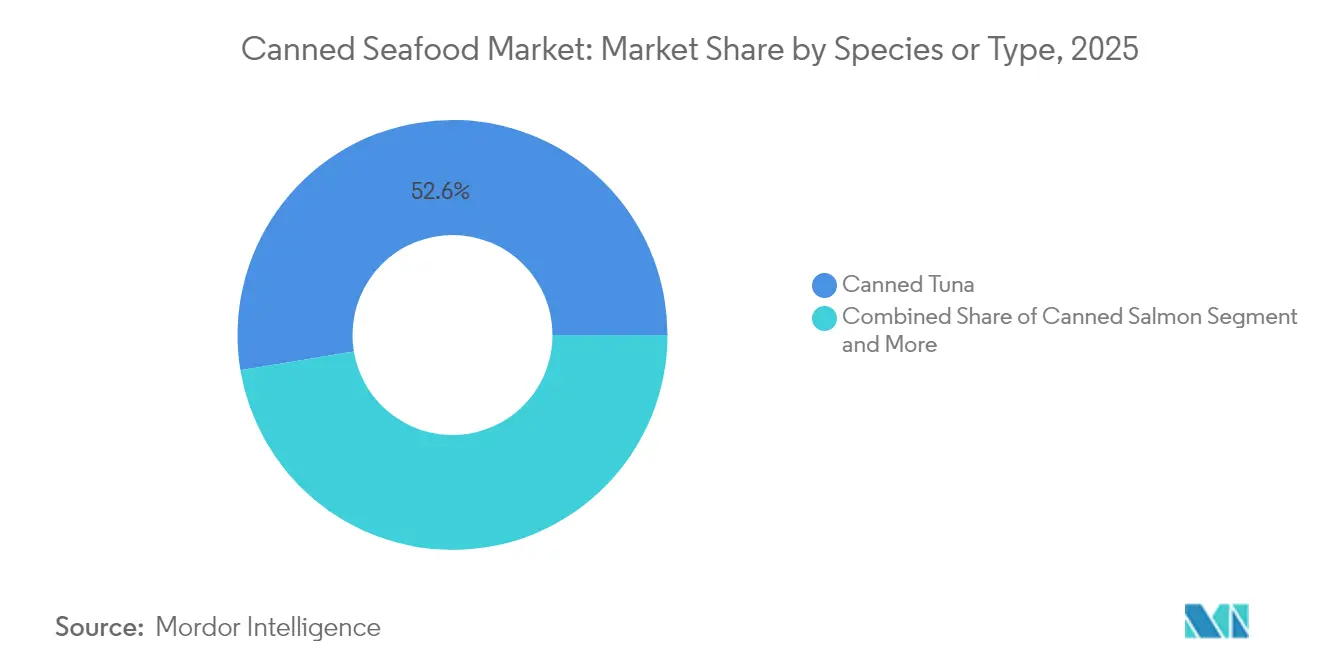
Tuna Dominance Faces Shrimp DisruptionCanned tuna maintains a dominant 52.62% market share in 2025, supported by decades of established brand presence, sophisticated distribution networks, and optimized supply chains. The segment's leadership position stems from widespread consumer acceptance, competitive pricing strategies, and versatile product applications. However, canned shrimp is emerging as the fastest-growing segment with a projected CAGR of 6.23% during 2026-2031. This trend indicates evolving consumer preferences toward premium seafood options that provide diverse culinary applications across multiple cuisine types and meal occasions. Canned salmon continues to show stable demand due to its recognized health benefits, high omega-3 content, and increasing consumer awareness of nutritional value, while sardines maintain their market position through sustainable fishing practices, competitive pricing, and appeal during economic uncertainty. Mackerel and other fish varieties cater to specific regional markets, particularly in Europe and Asia, where these species are deeply embedded in traditional cuisine and cultural preferences.
The market segmentation by species significantly influences supply chain operations and vertical integration strategies, as each species requires specialized sourcing networks, specific processing methods, quality control measures, and targeted marketing approaches. The growth in the shrimp segment demonstrates successful premium positioning strategies, transforming canned seafood from a basic protein source to a premium convenience product. This strategic shift creates opportunities for processors to increase profit margins through enhanced quality standards, innovative packaging solutions, and comprehensive brand development initiatives.

By Packaging Material:
Steel Resilience Meets Pouch InnovationSteel cans hold a dominant 77.65% market share in 2025, due to their effective barrier properties against moisture, light, and oxygen, supported by well-established global recycling systems. Retort pouches are experiencing the fastest growth at 7.25% CAGR, benefiting from enhanced portability, reduced storage requirements, and improved convenience for retailers and consumers. The market shows a clear shift toward flexible packaging options that reduce transportation costs, storage space needs, and environmental impact while preserving product quality and shelf life. Aluminum cans serve premium market segments, with their light weight, temperature resistance, and recyclability offsetting higher material costs, particularly for sustainability-focused brands. Glass jars and composite materials maintain specific market positions where product visibility, premium presentation, or preservation requirements offer competitive benefits.
The variety of packaging materials shapes investment decisions and technological advancement, as each material type requires specific manufacturing processes, equipment, and supplier relationships. Sonoco's USD 3.9 billion acquisition of Eviosys in December 2024 reflects ongoing metal packaging consolidation, as companies seek operational efficiency and scale advantages in the expanding canned food market. The industry's shift to BPA-free linings in metal packaging addresses regulatory requirements and consumer health concerns, with companies like Sherwin-Williams developing protective coatings that enhance product safety through improved material science and manufacturing methods.
By Product Form:
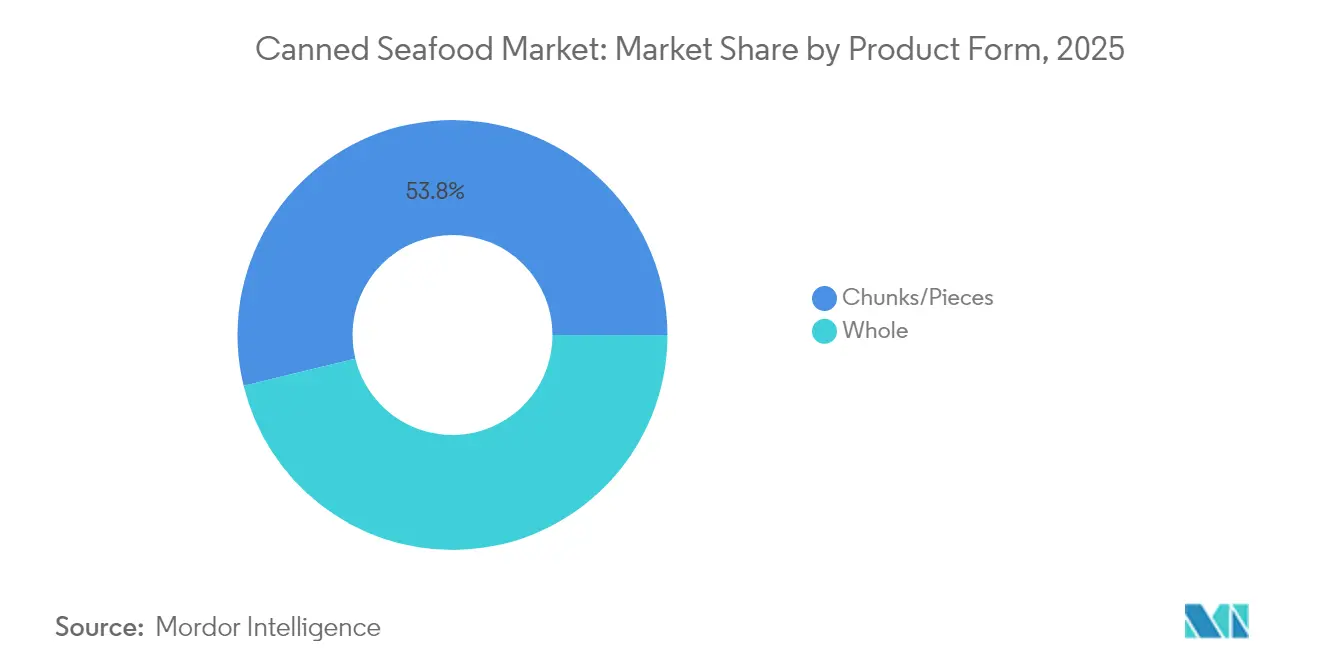
Chunks Lead While Whole Fish GainsChunks and pieces accounted for 53.80% of the canned seafood market size in 2025, primarily serving as ingredients in salads, sandwiches, and casseroles. The whole fish segment is projected to grow at an 7.85% CAGR, driven by consumer demand for intact fillets in olive oil with visible skin and bones that provide authenticity. Premium products now feature QR codes on packaging that allow consumers to trace harvest locations and processing methods, transforming traditional packaging into an interactive consumer experience. This traceability feature has become increasingly important for consumers seeking transparency in their seafood purchases.
Processors optimize production costs by directing dark meat to pet food manufacturing while maintaining profitability on white-meat tuna chunks. While whole fish processing requires precise positioning in cans during production, these products command premium prices in specialty retail stores, often selling at higher margins. Retailers position these premium products alongside complementary items like gourmet crackers and wine selections, expanding their market presence beyond traditional seafood departments and creating dedicated gourmet seafood sections. This strategic placement has resulted in increased cross-category sales and higher overall basket values for retailers.
By Distribution Channel:
Off-Trade Stability Meets On-Trade GrowthOff-trade channels maintain a dominant 59.82% market share in 2025, driven by well-established retail partnerships, consistent consumer shopping behaviors, and extensive distribution networks. The on-trade segment demonstrates stronger growth at 6.85% CAGR as restaurants and foodservice operators increase their use of canned seafood for innovative menu development, portion control, and operational cost management. This shift indicates evolving consumption patterns, with canned seafood expanding from a household staple to a versatile restaurant ingredient, enabling diverse culinary applications and menu flexibility. Supermarkets and hypermarkets generate significant volume through strategic promotions, competitive pricing, and extensive private label offerings, while convenience stores capitalize on growing grab-and-go demand, urban population density, and changing consumer lifestyles.
The distribution channel landscape significantly influences brand development and customer relationship strategies, requiring carefully tailored channel-specific marketing approaches and differentiated service capabilities. E-commerce growth demonstrates the complementary role of digital platforms alongside traditional retail, particularly for premium brands seeking direct consumer engagement and enhanced market visibility. Online retail provides smaller brands access to national markets without traditional distribution constraints, enabling efficient market entry and expansion. Specialty stores serve as strategic platforms for premium positioning, product differentiation, and comprehensive consumer education regarding sustainability practices, product quality, and sourcing transparency.
Geography Analysis
Europe Canned Seafood Market
Europe accounts for 33.85% of global revenue in 2025, supported by Mediterranean fish preservation traditions, strict sustainability regulations, and high consumer purchasing power. Spain processes a significant amount of the region's canned tuna through its fishing fleets operating in the Atlantic, Indian, and Pacific Oceans. The country's processing facilities and supply chains enable efficient production and distribution. Norway continues its premium sardine production, combining traditional preservation methods with modern processing techniques, which strengthens its tourism appeal and export market position.
APAC Canned Seafood Market
Asia-Pacific exhibits the highest growth rate at 5.88% CAGR. China's growing urban middle class incorporates canned fish into lunchboxes and daily meals, while India's coastal states increase domestic processing capabilities to serve inland markets. Vietnam experiences raw material limitations and aquaculture disease issues, but implements government-supported hatchery modernization programs to maintain export stability. Asian Development Bank-funded cold chain infrastructure improvements, including refrigerated transportation and storage facilities, enhance product distribution to tier-2 cities, increasing per capita consumption.
The Americas and MEA Canned Seafood Market
North America shows moderate growth with strong brand loyalty, supported by established distribution networks and consumer preferences. Product innovation centers on flavored snack kits, low-sodium options, and convenient pouch formats. FDA container inspection requirements drive investments in automated seam testing equipment and x-ray inspection systems, raising operational costs while ensuring safety standards. South America and the Middle East see consumption growth from urbanization and expanding tourism. In Africa, population growth impacts local fish resources, making canned fish imports a vital protein source in areas with limited cold storage infrastructure, particularly in rural and semi-urban regions.
Regulatory Landscape
Canned seafood is regulated through overlapping food safety, hygiene, and labeling regimes. Codex Alimentarius (CCFFP circular letters issued in 2026) continues to influence reference standards for fish and fishery products used by national authorities. In China, GB 7098-2025 (National Food Safety Standard for Canned Foods) took effect on March 16, 2026, tightening the compliance baseline for processors and importers supplying the domestic market.
Operational compliance increasingly links processing controls with traceability and microbiological verification. In the United States, FDA oversight remains centered on seafood HACCP and related guidance, while FSMA traceability requirements for certain foods carry an extended compliance date to July 20, 2028, affecting how brands schedule record, data system, and supplier onboarding investments. In Europe, national implementation details add complexity, including Spain enforcing Royal Decree 1082/2023 from January 2, 2026 on commercial denominations for preserved fishery products, and Ireland’s SFPA applying updated Listeria monocytogenes criteria for ready-to-eat products effective July 1, 2026 under EU Regulation 2024/2895.
Value Chain Analysis
The canned seafood value chain starts with wild-catch and aquaculture supply, followed by landing and cold storage, primary processing (for example loining and cooking), canning or pouching with thermal processing, and downstream distribution via importers, wholesalers, retail, and foodservice. Large brand owners and integrated groups typically run sourcing programs, specification control, and certification needs such as MSC and ASC, supported by specialized regional ecosystems for throughput and coordination, including the ANFACO-CECOPESCA cluster in Galicia, Spain.
Most pressure points concentrate on raw material availability and compliance-heavy logistics. Cold-chain gaps in some origin markets, port clearance and documentation demands tied to traceability and import controls, and periodic raw material disruptions linked to fishery management measures, such as Vietnam’s Decree No. 37/2024/ND-CP (effective May 19, 2024) introducing minimum size regulations for skipjack tuna, can disrupt supply flows. Processors also carry high fixed costs in thermal processing, quality verification, and packaging conversion, while side-stream valorization remains uneven due to technology and space limitations, particularly for smaller facilities.
Competitive Landscape
The canned seafood market demonstrates moderate fragmentation. Thai Union Group maintains market leadership across Asia, Europe, and North America through its vertically integrated operations in fishing, processing, and branding. Bumble Bee focuses on millennial consumers through innovations in pouch packaging and chef-inspired flavors. Bolton Group S.p.A. maintains market differentiation through pole-and-line fishing methods, non-GMO certification, and transparent mercury testing protocols.
Digital traceability emerges as a primary focus of technology adoption. Companies implement blockchain technology with QR-code tracking to document catch information and vessel details, enhancing retailer confidence. Technology providers deliver AI and software solutions that support seafood producers' manufacturing and supply chain operations. The premium segment experiences increased competition from new market entrants. Direct-to-consumer brands achieve significant price premiums through Instagram marketing, limited-edition releases, and distinctive packaging.
Established companies respond by implementing sustainable sourcing initiatives and charitable partnerships. Retail buyers incentivize emission reduction through carbon footprint labeling, prompting companies to implement renewable energy solutions in canneries and optimize transportation logistics. Companies are also emphasizing sustainability certifications and traceability initiatives, with many obtaining Marine Stewardship Council (MSC) certification and implementing blockchain technology for supply chain transparency.
Canned Seafood Industry Leaders
-
Thai Union Group PCL
-
Bolton Group S.p.A.
-
Dongwon Industries Co. Ltd. (StarKist)
-
Bumble Bee Foods, LLC.
-
Maruha Nichiro Corp.
- *Disclaimer: Major Players sorted in no particular order
Canned Seafood Market Companies Covered in this Report
- Thai Union Group PCL
- Bolton Group S.p.A.
- Dongwon Industries Co. Ltd. (StarKist)
- Bumble Bee Foods, LLC.
- Maruha Nichiro Corp.
- Nippon Suisan Kaisha Ltd.
- Century Pacific Food Inc.
- Trident Seafoods Corp.
- Alimentos Prosalud
- Princes Group
- Ocean Brands GP
- Clover Leaf Seafoods Corp.
- Wild Planet Foods Inc.
- Conservas Ortiz
- Mowi ASA
- Oman Fisheries Co. SAOG
- Dhofar Fisheries and Food Co. SAOG
- Safe Catch
- Calvo Group
- Ekone Seafood
Market Opportunities and Future Outlook
Packaging changes are creating near-term opportunities for shelf-stable seafood brands to differentiate on recyclability, convenience, and channel fit. In July 2026, Thai Union introduced a fully recyclable mono-material polypropylene tuna pouch under the John West brand, developed with Mondi, illustrating a pathway away from multi-layer structures that are harder to recycle. That same month, Tetra Pak introduced Tetra Recart carton packaging for shelf-stable tuna in Southeast Asia, widening format options beyond metal cans and conventional pouches and giving brands a route to emphasize lighter weight, shelf efficiency, and sustainability.
Supply security and regional capacity programs are influencing where manufacturers add lines and partnerships. In June 2026, Century Pacific Food Inc. maintained 2026 capex guidance of up to PHP 9 billion to support capacity increases across key processing categories including tuna, while in April 2026 Hijos de Carlos Albo acquired 63,000 square meters at the Plisan dry port in Galicia for an expansion footprint connected to seafood canning. Trade and sourcing constraints are also creating openings for compliant suppliers: the United States extended the ban on Russian seafood imports through April 15, 2027, shifting procurement patterns for affected whitefish-linked supply chains and reinforcing the value of diversified origins and verified traceability.
Recent Industry Developments in Canned Seafood Market
- July 2026: Thai Union launched an industry-first shelf-stable tuna product in a fully recyclable mono-material polypropylene pouch under the John West brand, developed with Mondi. The move supports a shift toward recyclable flexible formats while preserving retort performance requirements for ambient distribution.
- April 2025: Dongwon Group made Dongwon F&B a wholly owned subsidiary and created a Global Food Division to integrate R&D and production for international expansion. The restructuring strengthens coordination across brands such as StarKist and supports faster rollout of new canned and shelf-stable seafood formats across markets.
- December 2024: Simak, owned by Fisheries Development Oman, launched its commercial canned tuna line for the domestic market from its facility in the Duqm Special Economic Zone. With capacity stated at over 100 million cans annually and more than 30,000 metric tons of raw seafood processing, the project increases regional supply availability and adds a new processing hub for shelf-stable seafood.
Canned Seafood Market Report Scope and Research Methodology
Market Definition and Coverage
This market covers shelf-stable seafood preserved and sold in sealed containers, where the product is processed (such as cooked or packed in brine, oil, or sauce) and then distributed through retail and foodservice in ready-to-store format.
Scope exclusions: Fresh, frozen, chilled, and bulk seafood sold without canning, along with plant-based seafood substitutes, are excluded from this sizing.
Segments Covered in This Report
- By Species/Type
- Canned Fish
- Tuna
- Salmon
- Sardines
- Mackerel
- Other Canned Fish
- Canned Shrimp
- Canned Prawns
- Other Types
- Canned Fish
- By Packaging Material
- Steel Cans
- Aluminum Cans
- Retort Pouches
- Other Packaging Material
- By Product Form
- Whole
- Chunks/Pieces
- By Distribution Channel
- On- Trade
- Off-Trade
- Supermarkets/Hypermarkets
- Convenience Stores
- Online Retail
- Specialty Stores
- Other Off-Trade Distribution Channels
- By Geography
- North America
- United States
- Canada
- Mexico
- Rest of North America
- Europe
- United Kingdom
- Germany
- France
- Spain
- Italy
- Russia
- Norway
- Sweden
- Denmark
- Belgium
- Rest of Europe
- Asia-Pacific
- China
- Japan
- India
- South Korea
- Indonesia
- Thailand
- Vietnam
- Malaysia
- Philippines
- Rest of Asia-Pacific
- South America
- Brazil
- Argentina
- Chile
- Peru
- Rest of South America
- Middle East and Africa
- Saudi Arabia
- United Arab Emirates
- Oman
- South Africa
- Nigeria
- Kenya
- Egypt
- Rest of Middle East and Africa
- North America
Data Sources, Market Sizing, and Validation
Desk Research
Desk work starts by setting a clean fact base on seafood supply, trade, and consumption, because canned seafood demand is strongly linked with fish availability and cross-border movement. We use public sources such as FAO fisheries datasets, UN Comtrade trade statistics, national fisheries agencies, and customs and inspection bodies, along with food safety and labeling guidance from regulators such as the US FDA and the European Commission.
To convert those signals into a workable market model, we also review company annual reports, investor decks, and retailer or wholesaler disclosures where they are publicly shared. In parallel, we reference paid subscriptions used for company financials and intelligence, shipment-level import and export checks, and patent databases to validate packaging and processing direction. The sources listed here are illustrative only, and additional public and credible references were also used to collect data, validate figures, and clarify assumptions.
Primary Interviews and Surveys
Primary work was used to pressure-test the desk assumptions that move the number the most, especially species mix, price movement by format, and channel splits between off-trade and on-trade. We spoke with a mix of brand owners, processors, packaging participants, distributors, and category managers, and the discussion was balanced across major consuming and trading regions so regional price and supply shocks did not get averaged out too quickly.
Distribution of primary research fieldwork respondents
| Company type | Respondent position | Region |
|---|---|---|
| Top tier: 26% | CXOs: 16% | APAC: 38% |
| Mid tier: 58% | Functional/Unit leaders: 29% | EMEA: 36% |
| Smaller Players: 16% | Managers: 55% | Americas: 26% |
Market-Sizing & Forecasting
Sizing is built using top-down and bottom-up logic in a practical way. The top-down build reconstructs value by linking seafood supply and trade flows to consumer-pack demand, and then filtering it through the portion that is processed into canned formats in each region, which is then aligned to observed retail and foodservice mixes.
Where the totals looked too smooth versus real market behavior, selective bottom-up checks were used to calibrate them. Examples include sampled price per kg for key species, pack-size norms, and supplier and distributor channel checks. In the process, gaps were handled by using proxy indicators like canned fish import trends, household shelf-stable protein spend direction, and packaging material shifts (steel, aluminum, and retort pouches) to keep the model consistent when a country series was incomplete.
Forecasts are developed using scenario analysis supported by short, explainable drivers. Inputs that were tracked include tuna and sardine raw material pricing direction, fleet landings and quotas where available, inflation pass-through in packaged foods, private label penetration in shelf-stable categories, and the pace of online grocery contribution to canned seafood sales. Assumptions were then validated and adjusted with expert consensus from interviews so the forward view stays tied to what buyers and sellers expect to happen in pricing and volumes.
Data Validation & Update Cycle
Validation is done by triangulating the modeled value against independent signals, including trade value trends for canned products, major category price changes, and directionally consistent consumption patterns for shelf-stable proteins. Outliers are reviewed one by one, and if a variance cannot be explained by a clear driver like currency timing, temporary supply disruption, or channel shift, the assumptions are rebuilt and checked again.
Before sign-off, the model and write-up go through multiple analyst reviews so logic, units, and country roll-ups match. If a late-breaking event changes raw material availability, regulations, or pricing behavior, we re-contact relevant experts to confirm the likely impact. The report is refreshed annually, and a final pre-delivery pass is done so clients receive the latest updated view using the newest available public and interview-backed inputs.
Mordor Intelligence's Canned Seafood Market Size Measured Against Other Published Estimates
Published market sizes for canned seafood can differ even when the topic name looks the same, because firms do not always count the same products, price points, and selling stages. Differences also show up when the base year is not aligned, or when currency conversion timing and inflation handling are not clearly stated.
The main gap comes from which value point gets measured, because some sources use factory-gate revenue and add related services, while others use consumer-facing value and include broader shelf-stable packaged seafood formats. When retort pouches are treated as packaging options within the canned seafood definition and the total is checked against trade value movements and channel mix, Mordor Intelligence avoids inflating the number during periods of fast price change.
Benchmark comparison
| Source | Market Size | Gaps in Research Methodology |
|---|---|---|
| Mordor Intelligence | USD 33.30 B (2026) | |
| Global Consultancy A | USD 37.20 B (2025) | Uses a different base year and often blends fish and shellfish under broader packaged seafood framing, which can shift the counted channel mix and price basis versus a can-first scope. |
| Trade Publisher B | USD 37.20 B (2025) | Reports factory-gate value and includes related services, which can diverge from a consumption-aligned view, especially when distributor margins, retailer pricing, and currency timing are moving quickly. |
The spread is mostly explained by the value-chain pricing point and what gets bundled around canned seafood, rather than a single demand driver. By keeping the variables visible and running common-sense checks against independent signals, the final number stays repeatable and easier to audit when assumptions are updated.
Key Questions Answered in the Report
What is the current size of the canned seafood market?
The canned seafood market stands at USD 33.3 billion in 2026 and is projected to reach USD 43.98 billion by 2031 at a 5.72% CAGR.
Which species segment leads global sales?
Canned tuna dominates with 52.62% 2025 revenue, while canned shrimp is the fastest-growing at a 6.23% CAGR
Which region is expanding the fastest?
Asia-Pacific shows the highest forecast growth at 5.88% CAGR for 2026-2031 driven by rapid urbanization and rising middle-class incomes.
What packaging format is growing quickest?
Retort pouches will outpace other formats with a 7.25% CAGR thanks to portability, lower transport emissions, and microwave convenience.