
Cannabis Lighting Market Size and Share
Market Overview
| Study Period | 2020 - 2031 |
|---|---|
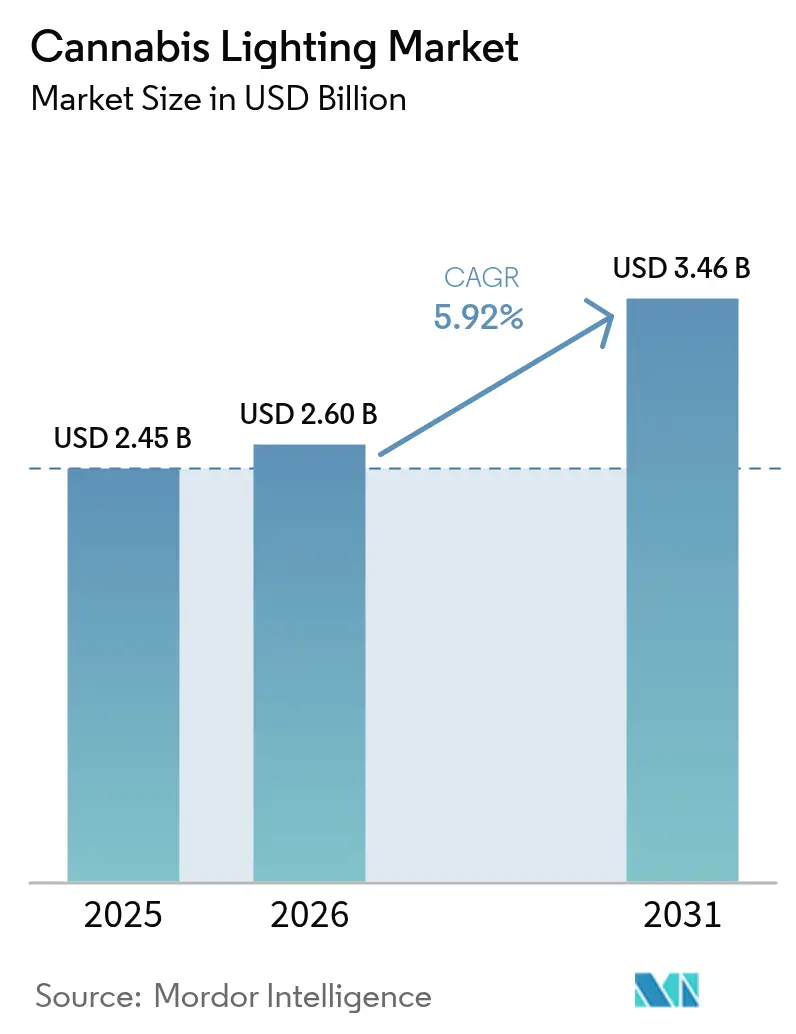
| Market Size (2026) | USD 2.6 Billion |
| Market Size (2031) | USD 3.46 Billion |
| Growth Rate (2026 - 2031) | 5.92 % |
| Fastest Growing Market | Europe |
| Largest Market | North America |
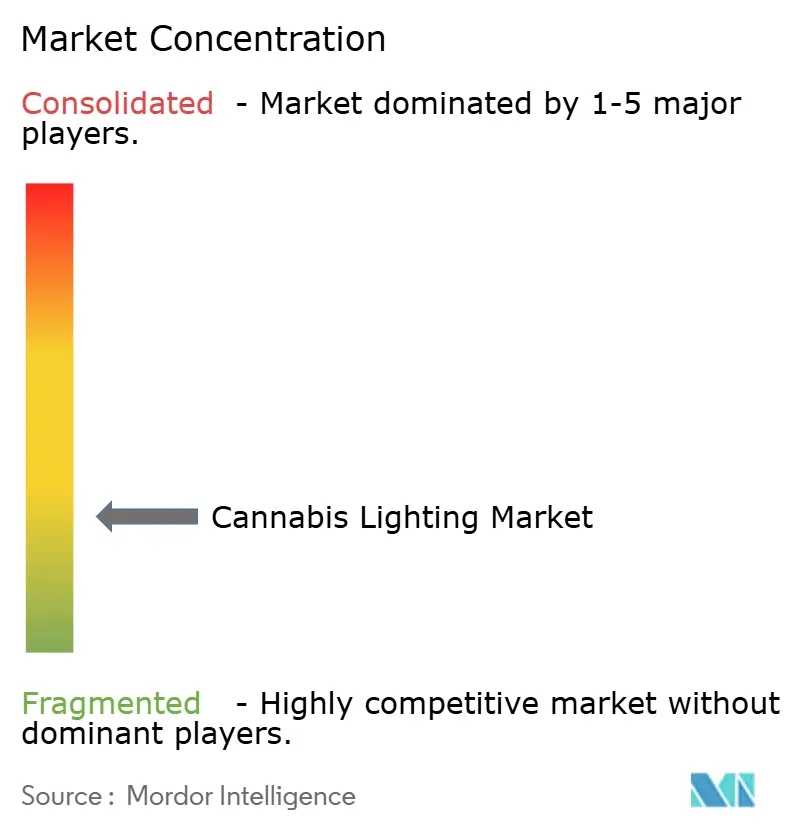
| Market Concentration | Low |
Major Players *Disclaimer: Major Players sorted in no particular order Image © Mordor Intelligence. Reuse requires attribution under CC BY 4.0. | |
Cannabis Lighting Market Analysis by Mordor Intelligence
The cannabis lighting market size was valued at USD 2.45 billion in 2025 and estimated to grow from USD 2.6 billion in 2026 to reach USD 3.46 billion by 2031, at a CAGR of 5.92% during the forecast period (2026-2031). Robust growth stems from synchronized legalization waves, energy-efficiency regulations that accelerate light-emitting diode (LED) adoption, and rising demand for controllable spectra that drive premium yields across commercial cultivation sites. Germany’s 2024 Cannabis Act illustrates regulatory momentum that fuels equipment demand; patient counts surged from 250,000 to 900,000 within 13 months, lifting facility construction and, in turn, lighting procurement needs. Large multi-state operators (MSOs) standardize lighting specifications across sites to contain costs, while mercury and compact fluorescent phase-out rules in Canada and the European Union compel a rapid shift toward LED arrays. [1] Vertical farming structures register the fastest uptake because their tiered layouts magnify light-use efficiency, and intercanopy strategies that insert fixtures within plant canopies have delivered 20% higher yields and 27% larger buds in commercial trials.
Key Report Takeaways
- By lighting technology, LED commanded 77.12% of the cannabis lighting market share in 2025.
- By application, indoor cultivation facilities represented 63.45% share of the cannabis lighting market size in 2025, while vertical farming structures are predicted to expand at an 7.78% CAGR through 2031.
- By installation type, retrofits held 56.05% of the cannabis lighting market size in 2025; new-build projects record the highest projected CAGR at 6.72% to 2031.
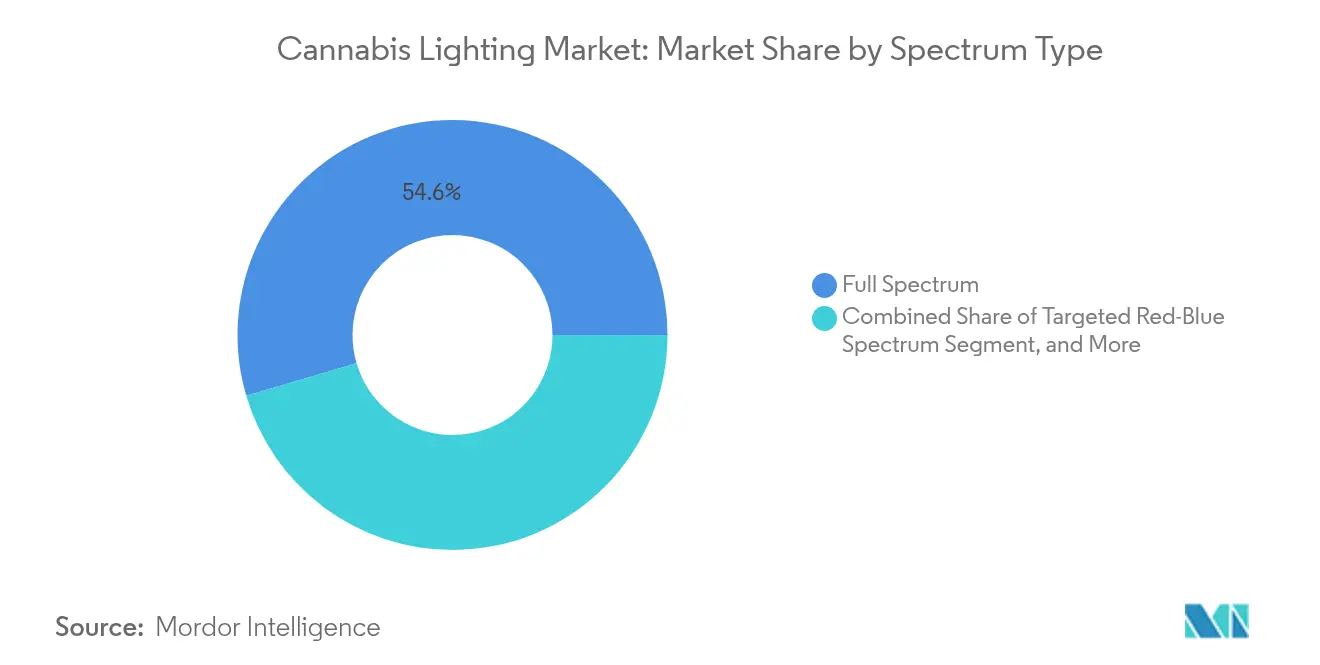
- By spectrum type, full-spectrum luminaires commanded 54.55% share in 2025, whereas UV plus far-red supplemental systems are expected to grow the fastest at 6.95% CAGR to 2031.
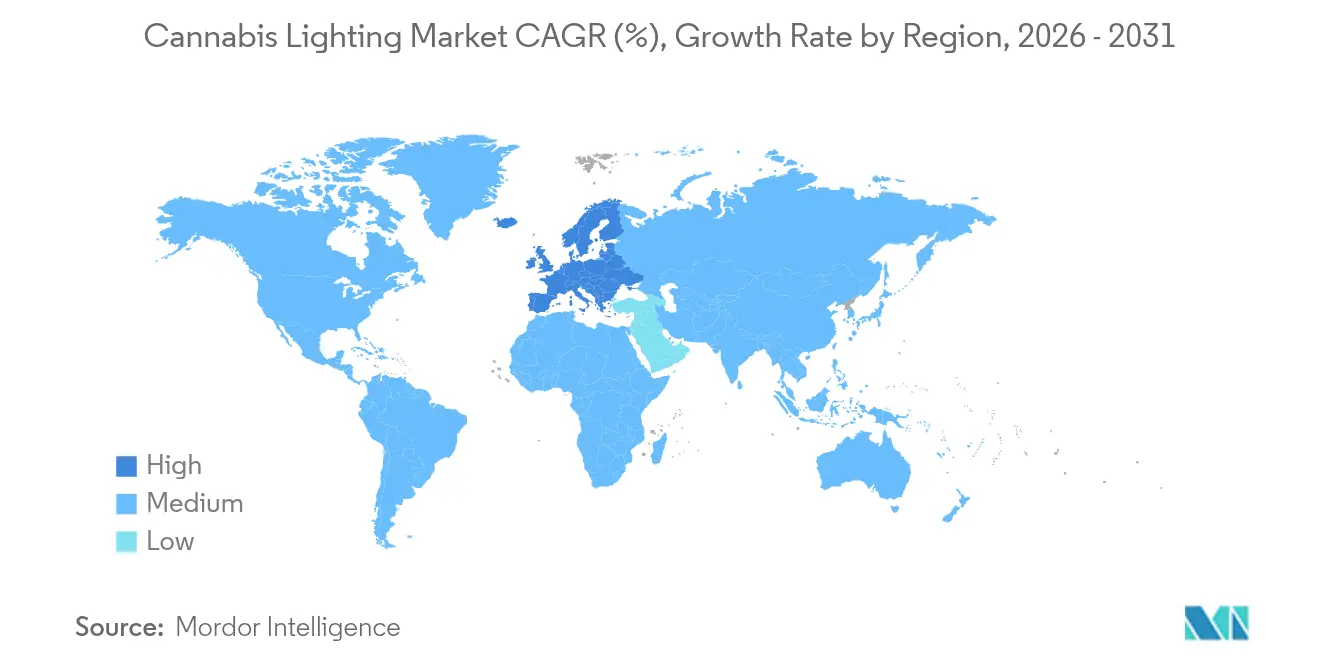
- By geography, North America accounted for 54.45% of the cannabis lighting market share in 2025, whereas Europe is projected to post the fastest 6.55% CAGR to 2031.
Note: Market size and forecast figures in this report are generated using Mordor Intelligence’s proprietary estimation framework, updated with the latest available data and insights as of 2026.
Global Cannabis Lighting Market Trends and Insights
Drivers Impact Analysis*
| Driver | (~) % Impact on CAGR Forecast | Geographic Relevance | Impact Timeline |
|---|---|---|---|
| Rapid expansion of legalized recreational cannabis markets in North America driving large-scale indoor farms | +1.2% | North America | Medium term (2-4 years) |
| Energy-efficiency mandates in Canada and EU incentivizing LED adoption in cannabis cultivation facilities | +0.9% | North America & EU | Short term (≤ 2 years) |
| Yield-optimization requirements for high-THC premium flower pushing demand for tunable spectrum luminaires | +0.8% | Global | Medium term (2-4 years) |
| Growth of vertically integrated multi-state operators (MSOs) leading to retrofit cycles of legacy HID fixtures | +0.7% | North America | Short term (≤ 2 years) |
| Surge in EU GMP-compliant medical cannabis exports from Portugal and Denmark requiring consistent photoperiod lighting | +0.6% | Europe | Medium term (2-4 years) |
| Advancements in smart, IoT-enabled lighting controls reducing operational costs for cultivators | +0.5% | Global | Long term (≥ 4 years) |
| Source: Mordor Intelligence | |||
Rapid expansion of legalized recreational markets driving indoor farm development
Large-scale indoor sites underpin demand in the cannabis lighting market. Recreational frameworks in the United States and Canada incentivize year-round production under tightly managed photoperiods. Germany’s medical expansion added 650,000 patients in just over a year, triggering new construction that requires high-intensity LEDs and intelligent controls to maintain pharmaceutical-grade consistency. MSOs roll out standardized fixture layouts that streamline procurement and assure repeatable yields across state lines. Studies show yield climbs proportionally up to 1,800 µmol m² s-¹, reinforcing high-power LED investments that replace high-pressure sodium (HPS) lamps. [2] Modern facilities thereby maximize canopy productivity and reduce risk associated with legacy lighting variability.
Energy-efficiency mandates accelerating LED adoption in cannabis cultivation
Regulatory initiatives remain pivotal. Canada’s amended Products Containing Mercury Regulations prohibit most mercury and metal-halide lamps between 2025 and 2028, a move projected to save USD 5.16 billion in energy costs. The European Ecodesign Regulation 2024/1781 sets durability and efficiency thresholds that LED products already meet. [3] Lighting drives 38% of an indoor grow’s energy expenditure, so swapping HPS units for LEDs cuts consumption by more than 40%, lowers cooling demand, and secures utility rebates. As a result, operators see paybacks in two to three years despite higher purchase prices, fueling continual growth in the cannabis lighting market.
Yield-optimization requirements driving demand for tunable-spectrum luminaires
Competitive differentiation increasingly relies on terpene and cannabinoid profiles, thus growers seek advanced fixtures that allow spectral fine-tuning. Full-spectrum models still dominate, yet adoption of ultraviolet (UV) and far-red supplementation grows at 7.3% CAGR as cultivators quantify secondary metabolite gains. Czech trials reported significant rises in flower mass and potency at 1,300 µmol m² s-¹ photon density relative to 900 µmol m² s-¹, outcomes facilitated by tunable LEDs. Intercanopy arrays further even out light distribution, and commercial tests confirm 20% yield uplifts. These performance premiums continue to pull capital into spectrum-adaptive solutions within the cannabis lighting market.
Growth of MSOs creating retrofit opportunities
Retrofit activity remains pronounced. MSOs often acquire older facilities equipped with HPS or ceramic metal halide units. Urban-Gro revealed more than 1,000 controlled-environment projects and a USD 20 million build contract with an MSO, illustrating scale. [4] LED life spans exceed 50,000 hours, curbing lamp replacement labor and cutting downtime. Consolidated purchasing supports volume discounts, driving fresh demand across MSO property portfolios and sustaining the retrofit-oriented share of the cannabis lighting market.
Restraints Impact Analysis*
| Restraint | (~) % Impact on CAGR Forecast | Geographic Relevance | Impact Timeline |
|---|---|---|---|
| High upfront capital expenditure of full-spectrum LED arrays relative to HPS fixtures, especially for small growers | -0.8% | Global | Short term (≤ 2 years) |
| Regulatory uncertainty and delayed licensing rounds in Germany and United States states stalling facility construction | -0.6% | North America & EU | Medium term (2-4 years) |
| Heat-management challenges in high-density vertical farms limiting use of high-intensity fixtures | -0.4% | Global | Medium term (2-4 years) |
| Illicit market persistence in Asia-Pacific dampening investment in professional-grade cultivation lighting | -0.3% | Asia-Pacific | Long term (≥ 4 years) |
| Source: Mordor Intelligence | |||
High upfront capital expenditure limiting LED adoption among small-scale growers
Professional-grade LEDs cost two to three times more than HPS setups. A medium farm retrofit can reach USD 200,000, yet banking constraints in federally illegal U.S. markets impede access to equipment loans. Smaller operators hence postpone investments despite long-term savings, tempering near-term volume growth for manufacturers within the cannabis lighting market.
Regulatory uncertainty and licensing delays stalling facility construction
Jurisdictional shifts introduce scheduling risk. Germany’s switch to authorization-based licensing yielded initial confusion, while new U.S. state programs face prolonged review periods, lagging real estate build-outs and equipment orders. Developers hesitate to commit to lighting purchases until permits are secure, slowing conversion of forecast demand into booked revenue across the cannabis lighting market.
*Our forecasts treat driver/restraint impacts as directional, not additive. The impact forecasts reflect baseline growth, mix effects, and variable interactions.
Segment Analysis
By Lighting Technology: Efficiency rules reinforce LED ascendancy
LED systems captured 77.12% cannabis lighting market share in 2025 and are projected to grow at 6.25% CAGR to 2031. Canada’s mercury ban mandates replacement of fluorescent and metal-halide lamps, triggering compulsory conversions that expand the cannabis lighting market. LEDs cut energy use by 40%, emit less heat, and deliver spectral precision increasingly vital for premium flower. HPS fixtures persist among cost-constrained cultivators, whereas ceramic metal halide lights remain confined to niche phenotyping or specialty strain rooms. Compact fluorescents are scheduled for elimination, accelerating their exit. Overall, technology substitution cycles secure a central position for LEDs in the cannabis lighting industry.
LED upgrades often coincide with broader facility improvements. Operators add wireless sensors, dim-to-watt drivers, and networked controls that modulate intensity by growth stage. These enhancements integrate seamlessly with HVAC systems to maintain stable vapor-pressure deficits, driving holistic efficiency gains. In new builds, architects design electrical distribution and bench layouts around modular LED bars, underscoring how technology choices reshape cultivation footprints while expanding the cannabis lighting market.


By Application: Indoor grows dominate while vertical farms accelerate
Indoor sites accounted for 63.45% of the cannabis lighting market size in 2025. Tight environmental control satisfies good manufacturing practice (GMP) rules and enables year-round harvest schedules. Close-canopy LED installations improve photon-use efficiency by up to 100% when fixture clearance narrows to 15 cm. Vertical farms, although newer, outpace all other applications with an 7.78% CAGR. Urban land-price pressures, zoning limits, and local-sourcing mandates make multi-tiered formats attractive for metropolitan retailers, boosting the cannabis lighting market.
Greenhouses blend sunlight with supplemental LEDs to moderate operating costs. Combined photosynthetic photon flux maintains cannabinoid consistency during winter months, and automatic shading systems prevent photoinhibition in summer. Indoor and greenhouse strategies thus coexist: operators select configurations that align with electricity tariffs, real estate constraints, and product positioning as the cannabis lighting industry matures.
By Spectrum Type: Full spectrum leads; supplemental UV gains momentum
Full-spectrum fixtures held 54.55% share of the cannabis lighting market in 2025, offering turnkey flexibility without the need for spectral tuning. Yet UV-plus-far-red supplementation posts the strongest growth, reflecting evidence that targeted wavelengths influence terpene pathways. Blue-heavy recipes encourage compact vegetative structure, while red-rich spectra accelerate floral biomass. Developers embed on-board diodes that deliver programmable recipes, enabling cultivators to fine-tune cycles and command premium prices. As crop-steering software links sensor feedback with lighting arrays, demand for adaptive spectral platforms continues to grow within the cannabis lighting market.
Simpler red-blue boards remain relevant where capital budgets are tight, particularly for vegetative rooms. However, the advent of dynamically addressable channels diminishes earlier cost gaps. Suppliers now market mid-priced fixtures that automate sunrise-sunset ramps, reinforcing elevated quality norms across regulated markets and widening adoption of spectral agility in the cannabis lighting industry.
By Installation Type: Retrofit predominates; new-build pace quickens
Retrofit projects contributed 56.05% to the cannabis lighting market size in 2025 as growers swapped aging HID fixtures for LEDs. Operators value immediate utility savings and cooling-load reductions. Project teams often integrate lighting refits with electrical panel upgrades, adopting lower-gauge wiring as LEDs reduce amperage draw. New builds are growing faster—6.72% CAGR—because legalization in frontier jurisdictions sparks greenfield complexes engineered for vertical integration. Electrical architecture, ceiling height, and bench spacing are optimized from inception, lowering installation cost per micromole and widening future retrofit windows for advanced modules, which sustains expansion of the cannabis lighting market.
Geography Analysis
North America continued to generate 54.45% of global revenue in the cannabis lighting market during 2025. Mature adult-use programs in Canada and 24 U.S. states underpin large contract volumes. Utility rebates offset 20-30% of LED invoice costs, enabling rapid recoupment of investment. Canadian federal mercury restrictions further compel replacement, ensuring fixture demand even in flat-sales provinces.
Europe delivers the fastest 6.55% CAGR to 2031. Germany’s patient base almost quadrupled post-legalization, spurring cultivation capacity investments that rely on LED arrays to satisfy pharmacopeial purity standards. Portugal and Denmark export EU-GMP flower, and southern markets combine greenhouse structures with supplemental LEDs to mitigate summer heat stress. The EU Ecodesign law, effective mid-2024, cements LED preference and channels funding toward high-efficiency products.
Asia-Pacific, South America, and the Middle East & Africa represent nascent territories for the cannabis lighting market. Illicit trade, limited financing, and evolving statutes restrain near-term volumes. Nonetheless, Brazil and Thailand examine broader medical frameworks, while Japan backs clinical trials that could unlock domestic cultivation. Multinationals position regional hubs to leverage eventual liberalization, anticipating future uplift in the cannabis lighting industry.
Regulatory Landscape
Energy and environmental rules are increasingly shaping lighting specifications in licensed cannabis cultivation, with efficacy thresholds and controls becoming explicit requirements in key jurisdictions. In New York, Office of Cannabis Management aligned requirements set horticultural lighting efficacy thresholds by operator tier (1.7 umol/J for smaller tiers and 2.2 umol/J for larger tiers), embedding performance compliance into facility planning. California adds a dual layer through the California Energy Commission energy code (including requirements around lighting controls and photosynthetic photon efficacy for high-load indoor grow spaces) and California Department of Cannabis Control rules that require shielding of indoor lighting from sunset to sunrise to mitigate light pollution.\n\nStandards bodies are tightening qualification and safety baselines that influence what fixtures are rebate-eligible and procurement-ready. The DesignLights Consortium (DLC) released Horticultural Lighting Technical Requirements V4.0, effective April 18, 2025, raising the minimum photosynthetic photon efficacy (PPE) threshold to 2.5 umol/J and tying market access to listing on the Hort QPL used by utility programs. In Europe, Ecodesign rules under EU Regulation 2019/2020 continue to regulate light sources, while horticultural luminaires are increasingly assessed against photobiological safety approaches such as IEC 62471-7:2023 and related EN/IEC luminaire safety frameworks, pushing suppliers toward documented testing and conformity markings for professional deployments.
Value Chain Analysis
The cannabis lighting value chain starts with LED and electronics inputs (diodes, drivers, optics, heat sinks, housings), then moves through luminaire design and manufacturing, compliance testing, and distribution via horticulture specialists, electrical distributors, and cultivation-focused integrators that bundle layout design, installation, and commissioning. A key gate in the chain is third-party verification of performance and safety, with efficacy and maintenance claims increasingly needing accredited test methods (for example ANSI/IES LM-79-19 for photometric testing, and LED package and system maintenance standards such as LM-80 and LM-84) to support qualification and procurement. For many commercial projects, controls hardware and software (dimmers, sensors, and networked controllers) sit alongside fixtures as a parallel supply stream that is integrated during commissioning.\n\nStandards-driven qualification and delisting risk have become major operational considerations for manufacturers and distributors. DLC Horticultural Lighting Technical Requirements V4.0 raised the minimum PPE to 2.5 umol/J and introduced durability expectations such as Q90 photon flux maintenance at 36,000 hours, while setting deadlines for listing updates to avoid removal from the Hort QPL, which many incentive programs use to screen products. This accelerates product refresh cycles, increases reliance on certified supply availability for high-efficacy LED and driver components, and pushes vendors and integrators to maintain documentation packs (including safety certifications such as ANSI/CAN/UL 8800 via recognized certification bodies) to keep projects moving through utility rebate and licensing-related reviews.
Competitive Landscape
Competition remains fragmented; no single vendor holds double-digit revenue share across all regions. Multinational lighting groups acquire niche horticultural brands to deepen domain expertise. Signify’s 2024 purchase of Fluence broadened its agricultural suite and added North America-focused Gavita products. Scotts Miracle-Gro divested Hawthorne Collective in April 2025, signaling portfolio realignment that may shift distribution alliances.
Strategic partnerships dominate differentiation strategies. Hydrofarm joined with Trolmaster to integrate IoT-ready controllers and deliver remote spectrum scheduling. Sollum’s collaboration with Leaficient combines in-plant sensors and adaptive lighting algorithms aimed at real-time photon deployment efficiency. Certification gains importance following new IEC horticultural standards that set safety and reliability thresholds, a development that favors firms with in-house compliance capacity.
Vendors that couple data analytics, cultivation modeling, and service networks improve stickiness within the cannabis lighting market. Integrated offerings reduce downtime, facilitate preventive maintenance, and increase lifetime customer value. As regulatory scopes broaden, companies that master local compliance and utility rebate paperwork will outpace competitors that rely solely on hardware pricing.
Cannabis Lighting Industry Leaders
-
OSRAM Licht AG
-
Gavita Holland BV
-
Illumitex Inc.
-
Signify Holding
-
LumiGrow, Inc.
- *Disclaimer: Major Players sorted in no particular order
Market Opportunities and Future Outlook
A primary whitespace sits at the intersection of compliance-driven efficacy thresholds and software-defined cultivation, where growers and facility designers need lighting systems that meet higher PPE rules while supporting crop steering and environmental coordination. DLC Horticultural Lighting Technical Requirements V4.0 (effective April 18, 2025) lifted the qualified-product minimum to 2.5 umol/J, and California Title 24 stakeholder materials in March 2026 discussed raising minimum PPE for horticultural lighting in a future code cycle (from 2.3 to 2.5 umol/J). That combination creates room for vendors that can supply high-efficacy fixtures with complete certification packages and application engineering that helps facilities document compliance, especially in retrofits where operators target fast energy and HVAC relief.\n\nAnother opportunity is the shift from hardware-only selling to integrated controls and biological-response optimization, supported by field adoption of dimming and increasing attention to dynamic recipes. In 2025, 83% of surveyed cultivators used dimming technology, up from 75% in 2024, indicating that controllability has moved into the core bill of materials for commercial grows. Supplier innovation is moving toward modular architectures and operating systems that simplify upgrades and reduce downtime, illustrated by Gavita and Agrolux showcasing the LYRA modular LED platform and AgroluxOS in 2026. This opens space for platforms that link lighting with HVACD and sensor stacks, and for service-led offerings (commissioning, validation documentation, and ongoing optimization) that help operators manage total cost of ownership under tighter energy and environmental scrutiny.
Recent Industry Developments
- June 2026: Gavita International B.V. announced an evolution of the LYRA modular LED platform and AgroluxOS at GreenTech Amsterdam 2026, signaling platform-wide expansion into modular luminaires and integrated control across cultivated environments.
- July 2025: Fluence (a Signify company) began shipping its next-generation VYPR 4 top light series to global cannabis cultivators, with the product line positioned for high-intensity commercial production and photon flux up to 2,660 umol/s.
- June 2024: The European Union adopted Regulation 2024/1781 establishing updated ecodesign benchmarks for products in scope, reinforcing durability and efficiency expectations that align with LED-based horticultural lighting.
Research Methodology Framework and Report Scope
Market Definition and Coverage
This market covers revenues from lighting systems used specifically to cultivate cannabis, across indoor rooms and greenhouse setups, including fixtures, lamps, and control-ready horticulture lights used through the plant growth cycle.
Scope exclusions: We exclude general-purpose residential bulbs, unrelated horticulture lighting sold only for non-cannabis crops, and downstream farm operations services that are not lighting equipment or lighting controls.
Segmentation Overview
- By Lighting Technology
- Light Emitting Diodes (LED)
- High-Pressure Sodium (HPS) Lamps
- Ceramic Metal Halide (CMH) Lights
- T5 High Output Fluorescent
- Compact Fluorescent Lights (CFL)
- Magnetic Induction Lights
- Other Technologies
- By Spectrum Type
- Full Spectrum
- Targeted Red-Blue Spectrum
- UV and Far-Red Supplemental Spectrum
- By Installation Type
- New Build Facilities
- Retrofit Projects
- By Application
- Indoor Cultivation Facilities
- Greenhouses
- Vertical Farming Structures
- By Geography
- North America
- United States
- Canada
- Mexico
- Europe
- Germany
- United Kingdom
- France
- Nordics
- Rest of Europe
- South America
- Brazil
- Rest of South America
- Asia-Pacific
- China
- Japan
- India
- South-East Asia
- Rest of Asia-Pacific
- Middle East and Africa
- Middle East
- Gulf Cooperation Council Countries
- Turkey
- Rest of Middle East
- Africa
- South Africa
- Rest of Africa
- Middle East
- North America
Data Sources, Market Sizing, and Validation
Desk Research
Desk work starts with building a clear picture of the legal cannabis cultivation footprint and facility types, since that determines the addressable lighting pool. We typically use public sources such as USDA agriculture statistics releases, US Energy Information Administration electricity price series, US Census trade and manufacturing tables, and standards and energy-efficiency documentation from the US Department of Energy.
We also review cannabis program updates and licensing counts from official state and provincial regulators, plus customs and tariff notes where relevant for components. To keep the inputs grounded in operating reality, we supplement with company annual reports, investor presentations, product certification notes, and reputable press coverage on greenhouse builds, indoor capacity additions, and retrofit cycles. We use selected paid subscriptions for company financials and patent databases to cross-check participation levels and technology direction. These are illustrative source types, and other public references were also used for data collection, validation, and clarification.
Primary Interviews and Surveys
Primary work is used to validate how lighting is bought and replaced, and what drives average spending per square foot across grow stages. We speak with a mix of lighting manufacturers, distributors, cultivation operators, and engineering contractors across Americas, EMEA, and APAC, so assumptions on retrofit rates, fixture mix, and pricing can be stress-tested before the numbers are finalized.
Distribution of primary research fieldwork respondents
| Company type | Respondent position | Region |
|---|---|---|
| Top tier: 29% | CXOs: 14% | APAC: 41% |
| Mid tier: 50% | Functional/Unit leaders: 28% | EMEA: 35% |
| Smaller Players: 21% | Managers: 58% | Americas: 24% |
Market-Sizing & Forecasting
Sizing is built using a top-down demand pool reconstruction where licensed canopy, indoor floor area, and typical lighting power density are translated into fixture counts, replacement cycles, and annual spend. Once that structure is set, we corroborate it with selective bottom-up checks such as sampled ASPs times unit shipments for key fixture classes, distributor channel checks, and a supplier roll-up on a limited set of visible revenues, which then helps adjust outliers.
Inputs used in the model include the split of indoor versus greenhouse cultivation, the pace of LED penetration versus legacy HID, typical wattage and fixture density by facility style, electricity price trends that influence upgrade decisions, and legalization and licensing momentum that signals new build activity. Where direct unit visibility is limited, gaps are handled by using range-based assumptions for fixture life, utilization, and retrofit timing, then interview validation is used so implied spend stays realistic.
For forecasting, we lean on scenario analysis supported by a light multivariate regression view, where new licenses, cultivation capacity additions, and energy cost direction are treated as key drivers. Assumptions on pricing progression and mix shift are updated using what respondents see in bids and procurement cycles, and then applied consistently across regions.
Data Validation & Update Cycle
Outputs are checked against independent signals such as cultivation footprint changes, reported expansion announcements, and observed mix shift toward LED in commercial grows. When a region shows an unusual jump, the underlying drivers are re-tested, and we re-contact select respondents to confirm whether the change is from legalization timing, retrofit waves, or pricing effects.
Before sign-off, the model goes through multi-step analyst review where unit economics, implied fixtures per facility, and regional totals are compared for consistency. The report is refreshed annually, and interim updates are made when there are material policy shifts, major capacity announcements, or sharp energy price changes. Right before delivery, a final sweep is done so the numbers reflect the latest available public indicators.
Mordor Intelligence's Cannabis Lighting Market Estimate Compared With Other Published Estimates
Published market values for cannabis lighting often differ because the underlying boundary is not always the same, and because updates to legalization, build-outs, and retrofit cycles can shift the demand pool quickly. The table highlights how changes in geography coverage, included product scope, and base year choice can move the total in either direction.
The table shows a spread mainly because some estimates blend broader grow-light demand or narrow down to one region, and then apply different price and replacement assumptions. In Mordor Intelligence's model, the total is built for the global cannabis lighting equipment scope across indoor cultivation facilities, greenhouses, and vertical farming structures, and it is anchored to a 2026 starting value with a defined 2026 to 2031 forecast window, which affects comparability versus studies using 2024 or region-only figures.
Benchmark comparison
| Source | Market Size | Gaps in Research Methodology |
|---|---|---|
| Mordor Intelligence | USD 2.6 B (2026) | |
| Industry Publisher A | USD 3.0 B (2025) | Uses a 2025 base and a longer horizon, and it appears to bundle a wider set of cannabis lighting demand signals (including more aggressive LED adoption and pricing progression), which can lift the near-term total versus a 2026-anchored build. |
| Regional Consultancy B | USD 1.39 B (2024) | This is North America only, so the value is not directly comparable to a global market, and the regional mix of indoor builds versus greenhouses can also change the implied average spend per facility. |
Across the three figures, the biggest drivers are whether the scope is global or regional, whether adjacent grow-light spending is included, and which year anchors the model. By tying totals to observable cultivation footprint indicators, realistic replacement timing, and interview-checked pricing, we keep the estimate traceable to repeatable steps even when public data is uneven.
Key Questions Answered in the Report
What is the current value of the cannabis lighting market?
The cannabis lighting market is valued at USD 2.6 billion in 2026.
How fast will the market grow through 2031?
Revenue is projected to rise to USD 3.46 billion by 2031, representing a 5.92% CAGR.
Which lighting technology leads today’s sales?
LED fixtures dominate with 77.12% market share in 2025, driven by energy-efficiency rules and yield-optimization needs.
Why are vertical farming structures expanding quickly?
Vertical farms achieve space efficiency in urban locales and post an 7.78% CAGR because tiered racks maximize photon use and leverage controlled spectra.
Which region offers the highest growth potential?
Europe shows the fastest 6.55% CAGR as Germany, Portugal, and Denmark scale EU-GMP facilities under new legalization frameworks.
What hampers small growers from adopting LEDs?
Full-spectrum LED arrays cost 200-300% more than HPS systems, and limited financing options extend payback periods, slowing uptake among capital-constrained operators.