
Market Overview
| Study Period | 2021 - 2031 |
|---|---|
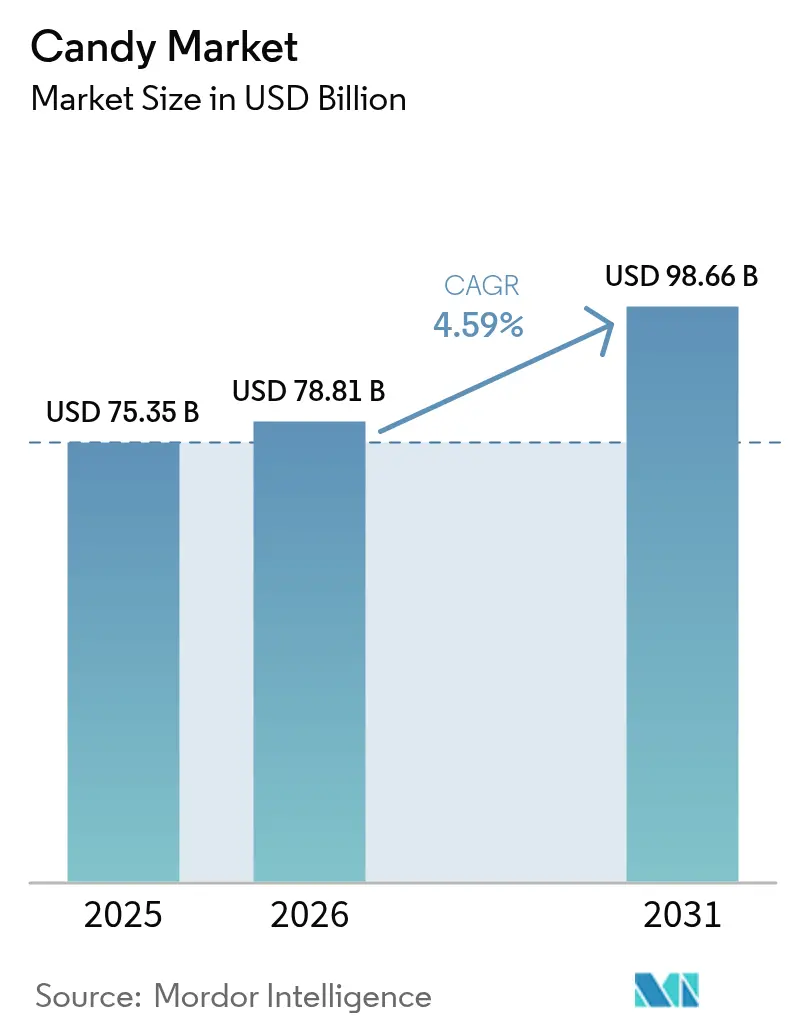
| Market Size (2026) | USD 78.81 Billion |
| Market Size (2031) | USD 98.66 Billion |
| Growth Rate (2026 - 2031) | 4.59% CAGR |
| Fastest Growing Market | North America |
| Largest Market | Asia-Pacific |
| Market Concentration | Medium |
Major Players
*Disclaimer: Major Players sorted in no particular order Image © Mordor Intelligence. Reuse requires attribution under CC BY 4.0. |
|
Candy Market Analysis by Mordor Intelligence
The Candy Market size was valued at USD 75.35 billion in 2025 and estimated to grow from USD 78.81 billion in 2026 to reach USD 98.66 billion by 2031, at a CAGR of 4.59% during the forecast period (2026-2031). Despite inflationary pressure and fast-evolving wellness habits, the candy market preserves demand by anchoring products to cultural rituals, celebratory gifting, and indulgent snacking. Rising premiumization, continuous flavor experimentation, and digital commerce adoption underpin steady value gains, while acute cocoa price swings and tighter sugar-reduction rules influence cost structures. Category resilience also reflects the candy market’s balanced product mix, with chocolate commanding the largest revenue pool and non-chocolate segments absorbing texture-driven innovation waves. Competitive intensity remains moderate as global majors pursue acquisitions and manufacturing upgrades to secure scale benefits and shield margins from raw-material
Key Report Takeaways
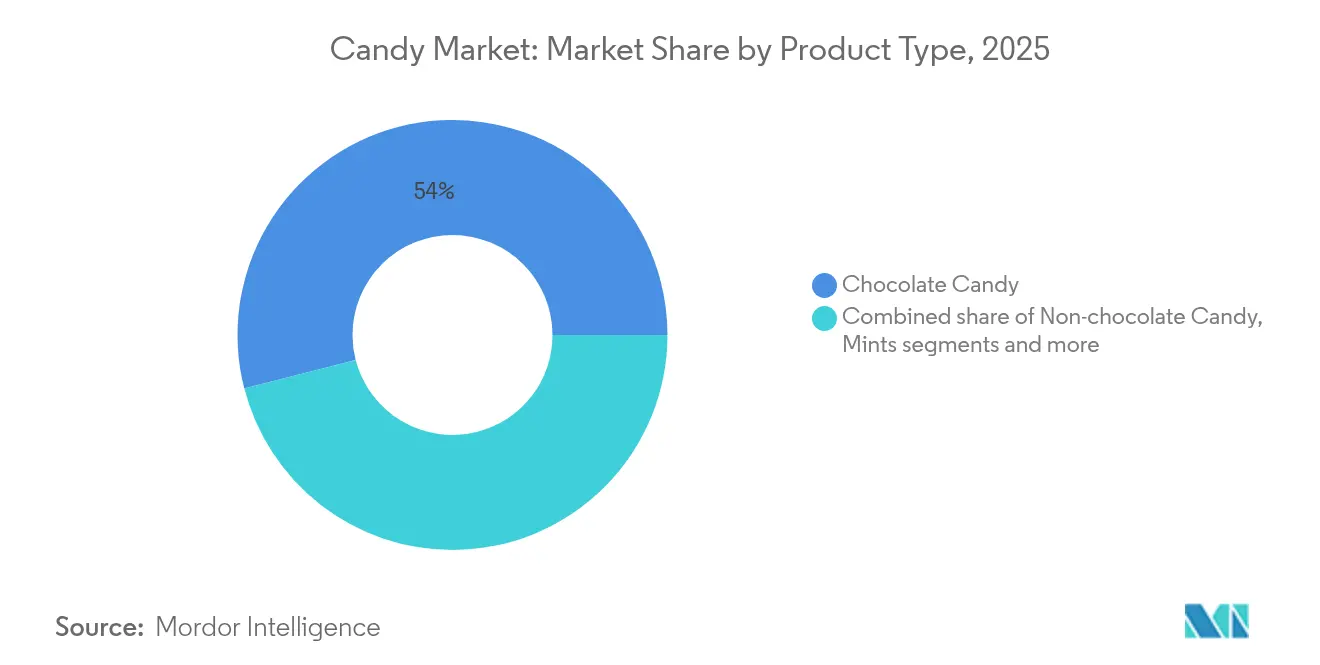
- By product type, chocolate candy led with 54.01% of candy market share in 2025, while pastilles, gums, jellies, and chews are forecast to grow at an 8.30% CAGR to 2031.
- By ingredient, sugar-based candies accounted for 79.15% of candy market share in 2025; sugar-free formats are projected to scale at a 7.12% CAGR by 2031.
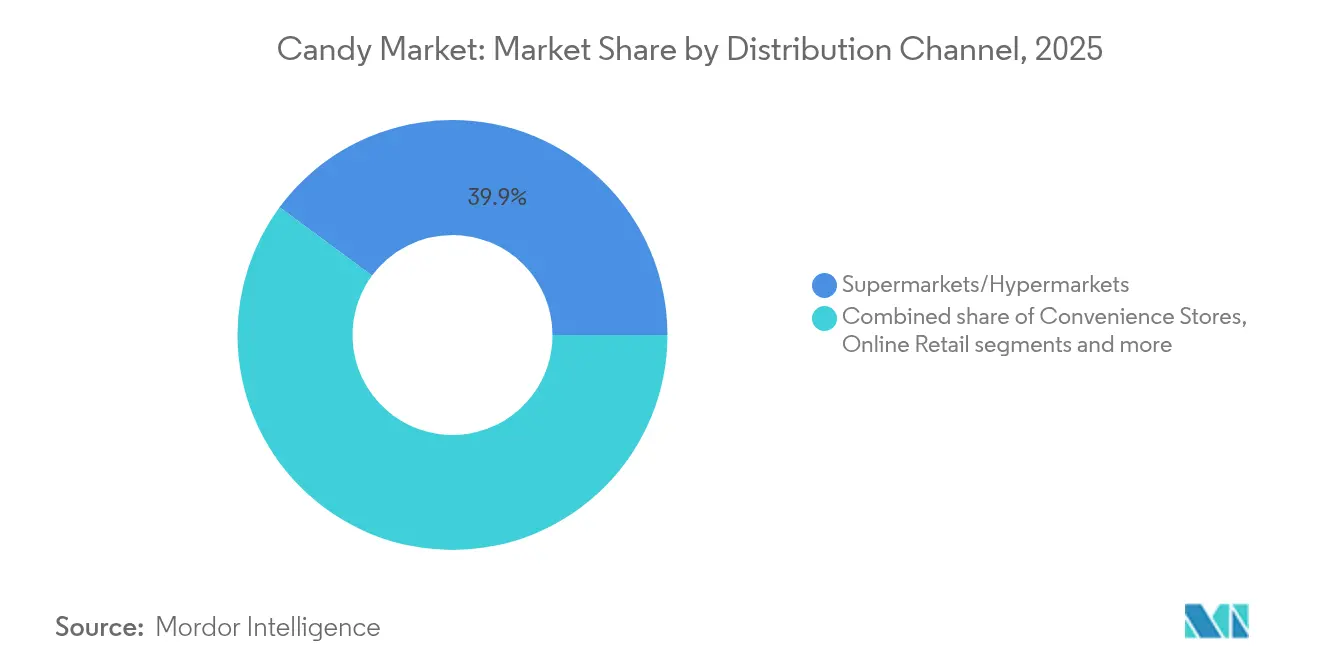
- By distribution channel, supermarkets and hypermarkets held 39.88% of the candy market size in 2025, whereas online retail is expanding at a 6.58% CAGR through 2031.
- By category, mass offerings represented 72.10% of candy market size in 2025; premium offerings are advancing at a 6.32% CAGR through 2031.
- By geography, North America accounted for 35.92% of candy market size in 2025; Asia-Pacific is projected to grow at a CAGR of 7.06% through 2031.
Note: Market size and forecast figures in this report are generated using Mordor Intelligence’s proprietary estimation framework, updated with the latest available data and insights as of 2026.
Global Candy Market Trends and Insights
Drivers Impact Analysis*
| Driver | (~) % Impact on CAGR Forecast | Geographic Relevance | Impact Timeline |
|---|---|---|---|
| Premium and artisanal candy demand surge | +0.8% | North America and Europe, expanding to Asia-Pacific | Medium term (2-4 years) |
| Expansion of organized retail and e-commerce | +0.9% | Global, with strongest growth in Asia-Pacific and South America | Short term (≤ 2 years) |
| Continuous flavour and texture innovation | +0.6% | Global, led by North America and Europe | Medium term (2-4 years) |
| Growing gifting culture and seasonal spikes | +0.7% | Global, particularly strong in Asia-Pacific emerging markets | Long term (≥ 4 years) |
| Functional / nutraceutical candy launches | +0.5% | North America and Europe, expanding globally | Long term (≥ 4 years) |
| AI-driven micro-batch manufacturing adoption | +0.3% | Global, concentrated in developed markets initially | Long term (≥ 4 years) |
| Source: Mordor Intelligence | |||


Premium and artisanal candy demand surge
The candy market is witnessing a significant boost due to the rising demand for premium and artisanal candies. Consumers are increasingly seeking high-quality, unique, and handcrafted confectionery products that offer superior taste and innovative flavors. This trend is driven by a growing preference for indulgent experiences and the willingness to pay a premium for products perceived as luxurious or exclusive. Additionally, the emphasis on natural and organic ingredients in artisanal candies aligns with the evolving consumer focus on health and wellness. Artisanal candies often feature clean labels, free from artificial additives, which further attract health-conscious consumers. The premium and artisanal candy segment is also benefiting from the growing trend of gifting premium confectionery items during festive seasons, celebrations, and special occasions, as these products are often seen as thoughtful and sophisticated gifts. Furthermore, the expansion of e-commerce platforms and direct-to-consumer channels has enabled manufacturers to reach a broader audience, including niche markets, while offering personalized and customizable options.
Expansion of organized retail and e-commerce
The rapid expansion of organized retail and e-commerce is a significant driver of the global candy market. Organized retail chains provide consumers with easy access to a wide variety of candy products, while e-commerce platforms offer the convenience of purchasing these products online. The growth of these channels is further fueled by impulse buying, facilitated by social media integration, subscription box services, and personalized recommendation algorithms that increase basket sizes. Additionally, the expansion of organized retail in emerging markets, particularly in the Asia-Pacific region, is creating a robust distribution infrastructure that supports the penetration of both domestic and international brands. Modern trade formats in these regions also provide temperature-controlled environments, which are essential for preserving chocolate in tropical climates. This dual-channel growth is enhancing product availability and accessibility, thereby fueling market demand.
Continuous flavour and texture innovation
Ongoing innovations in flavor and texture are driving the growth of the global candy market. Manufacturers are continuously experimenting with new flavor combinations and textures to cater to evolving consumer preferences. This trend is particularly evident in the premium and gourmet candy segments, where unique and exotic flavors, along with innovative textures, are gaining popularity. Additionally, advancements in food technology are enabling companies to create candies with enhanced sensory experiences, further boosting consumer interest and market demand. According to the National Confectioners Association, 98% of shoppers in the United States reported purchasing confectionery products at some point in 2024 [1]Source: National Confectioners Association, "NCA: Candy Dollar Sales Up, Unit Sales Decline in 2024", candyusa.com. This statistic highlights that consumers continue to allocate a portion of their budgets for treats like chocolate and candy, which are often associated with enhancing special moments. Such consumer behavior underscores the importance of continuous innovation in flavor and texture to maintain engagement and drive sales in the candy market.
Growing gifting culture and seasonal spikes
Seasonal spikes play a significant role in driving the growth of gifting culture. Gifting behaviors have evolved beyond traditional holidays to include emerging celebrations like "Summerween," which are driven by Gen Z social media trends. These trends create additional sales opportunities throughout the year by encouraging consumers to participate in non-traditional gifting occasions. Asia-Pacific markets, in particular, showcase a strong adoption of gifting culture, where chocolate is increasingly positioned as a premium gift item. This trend supports higher price points and contributes to market expansion, especially in regions with historically lower per-capita consumption. According to the National Confectioners Association, the big four candy seasons (Valentine’s Day, Easter, Halloween, and the winter holidays) accounted for 62% of all confectionery sales in 2024 in the United States, highlighting the significant role of seasonal gifting in driving market growth [2]Source: National Confectioners Association, "NCA: Candy Dollar Sales Up, Unit Sales Decline in 2024", candyusa.com.
Restraints Impact Analysis*
| Restraint | (~) % Impact on CAGR Forecast | Geographic Relevance | Impact Timeline |
|---|---|---|---|
| Rising health consciousness and sugar reduction | -0.6% | Global, strongest in North America and Europe | Medium term (2-4 years) |
| Volatile cocoa and sugar commodity prices | -1.2% | Global, most severe impact on chocolate segments | Short term (≤ 2 years) |
| Stricter single-use plastic-waste regulation | -0.3% | Europe and North America, expanding globally | Long term (≥ 4 years) |
| Climate-linked cocoa yield variability | -0.8% | Global supply impact, West Africa production zones | Long term (≥ 4 years) |
| Source: Mordor Intelligence | |||
Rising health consciousness and sugar reduction
Health-conscious consumers push for reduced sugar intake, which acts as a significant restraint in the candy market. With increasing awareness of the adverse effects of excessive sugar consumption, consumers are shifting toward healthier alternatives. According to the International Diabetes Federation (IDF), approximately 589 million adults (20-79 years) were living with diabetes in 2024, and this number is projected to rise to 853 million by 2050 [3]Source: International Diabetes Federation, "Diabetes around the world in 2024", idf.org . This alarming increase in diabetes cases highlights the growing need for sugar-free or low-sugar products, as individuals with diabetes and those at risk are actively avoiding high-sugar foods, including traditional candies. Additionally, governments and health organizations worldwide are implementing stricter regulations and campaigns to reduce sugar consumption, further pressuring candy manufacturers to adapt. These factors collectively compel candy producers to invest in research and development to create healthier alternatives, such as candies made with natural sweeteners or sugar substitutes.
Volatile cocoa and sugar commodity prices
Volatile cocoa and sugar prices act as a significant restraint in the global candy market. The frequent fluctuations in the prices of these key raw materials directly impact production costs, leading to challenges for manufacturers in maintaining consistent pricing and profit margins. Such volatility is often driven by factors like unpredictable weather conditions, geopolitical tensions, currency fluctuations, and supply chain disruptions, which affect the availability and cost of these commodities. For instance, adverse weather conditions in cocoa-producing regions can lead to reduced yields, driving up prices. Similarly, geopolitical tensions or trade restrictions can disrupt the supply chain, further exacerbating price instability. As a result, manufacturers face difficulties in long-term planning, budgeting, and maintaining product affordability, which can ultimately hinder market growth. Additionally, the rising demand for sustainable and ethically sourced cocoa and sugar adds further pressure on manufacturers to manage costs effectively while adhering to consumer expectations and regulatory requirements.
*Our forecasts treat driver/restraint impacts as directional, not additive. The impact forecasts reflect baseline growth, mix effects, and variable interactions.
Segment Analysis
By Product Type: Chocolate Candy Dominates While Pastilles, Gums, Jellies and Chews Surge
In 2025, chocolate candy dominates the candy market with a substantial 54.01% share. This dominance highlights its established consumer preference, driven by its rich taste, variety, and cultural significance across global markets. The segment benefits from strong brand loyalty, frequent product innovations, and seasonal demand spikes during holidays and celebrations. Additionally, the increasing availability of premium and artisanal chocolate options has further solidified its position in the market. Manufacturers are also focusing on health-conscious consumers by introducing low-sugar, organic, and vegan chocolate variants, which are gaining traction.
On the other hand, the pastilles, gums, jellies, and chews segment is projected to grow at a robust 8.30% CAGR through 2031. This growth is primarily attributed to advancements in texture innovation, which enhance the sensory experience for consumers. Social media trends also play a pivotal role in driving demand, as visually appealing and unique products gain popularity among younger demographics. The segment's versatility in flavors and formats, coupled with its appeal as a fun and convenient snack option, continues to attract a diverse consumer base globally. Additionally, the increasing focus on functional candies, such as those infused with vitamins or other health benefits, is expanding the segment's reach.


By Ingredient Type: Sugar-based Candies Leads, Sugar-free Gains Momentum
In 2025, sugar-based candies dominate the candy market with a substantial 79.15% share. This dominance can be attributed to their widespread consumer appeal, affordability, and extensive product variety. Sugar-based candies continue to attract a broad demographic, ranging from children to adults, due to their traditional flavors, textures, and nostalgic value. Additionally, the strong presence of established brands and their consistent innovation in flavors and packaging further bolster the segment's market position. Despite growing health concerns, sugar-based candies remain a staple in the confectionery industry, particularly in emerging markets where regulatory pressures are less stringent.
Conversely, sugar-free and reduced-sugar alternatives are gaining significant traction, recording a notable CAGR of 7.12% through 2031. This growth reflects a shift in consumer preferences driven by increasing health awareness and the rising prevalence of lifestyle-related diseases such as diabetes and obesity. Regulatory pressures in developed markets, including stricter labeling requirements and sugar reduction initiatives, are also propelling the demand for these alternatives. Manufacturers are responding by introducing innovative products that use natural sweeteners, such as stevia and monk fruit, to cater to health-conscious consumers without compromising on taste. This segment is expected to witness sustained growth as consumers prioritize healthier options and governments continue to enforce sugar reduction policies globally.
By Category: Premium Segment Outpaces Mass Market
In 2025, mass market products dominate the candy market with a substantial 72.10% share. These products primarily cater to price-sensitive consumers who prioritize affordability and accessibility. Mass market candies are designed for everyday consumption, making them a popular choice for a wide range of consumers, including children, families, and individuals seeking quick, affordable treats. Their availability across various retail channels, such as supermarkets, convenience stores, vending machines, and online platforms, further strengthens their market presence. Manufacturers in this segment focus on cost-effective production methods, leveraging economies of scale to offer competitive pricing while maintaining consistent quality. Additionally, mass market candies often feature familiar flavors and recognizable branding, which resonate with consumers seeking comfort and nostalgia.
On the other hand, premium candy offerings are experiencing significant growth, projected to expand at a 6.32% CAGR through 2031. This growth is driven by a rising consumer preference for artisanal quality, unique flavor profiles, and a more indulgent experience. Premium candies often use high-quality ingredients, such as organic, fair-trade, or sustainably sourced components, which appeal to health-conscious and ethically minded consumers. These products are frequently handcrafted or produced in small batches, emphasizing exclusivity and attention to detail. Premium candies also stand out through innovative packaging designs, which enhance their appeal as luxury items or gifting options. The segment targets niche markets, including consumers seeking indulgence, special occasions, or gourmet experiences.
By Distribution Channel: Supermarkets/Hypermarkets Dominates While Digital Disruption Accelerates
In 2025, supermarkets and hypermarkets hold a dominant 39.88% share of the candy market. This significant market presence is attributed to their ability to leverage impulse purchase behavior effectively. By strategically placing candy products near checkout counters and high-traffic areas, these retail formats encourage unplanned purchases, which are a key driver of candy sales. Additionally, their broad consumer reach, supported by extensive physical store networks, ensures accessibility to a wide demographic, including urban, suburban, and rural consumers. Supermarkets and hypermarkets also benefit from offering a diverse range of candy products, catering to varying consumer preferences, dietary needs, and price points, which further solidifies their position in the market.
Online retail, on the other hand, is projected to grow at a CAGR of 6.58% through 2031, driven by evolving consumer shopping habits and technological advancements. The integration of social media platforms into online retail strategies has played a pivotal role in this growth, enabling targeted marketing, influencer collaborations, and personalized product recommendations that resonate with specific consumer segments. Subscription service models have also gained traction, offering consumers convenience, cost savings, and regular delivery of their favorite candy products, which fosters customer loyalty. Furthermore, the increasing adoption of e-commerce platforms, coupled with the rising preference for home delivery, has expanded the reach of online retail, making it a key growth driver in the candy market.
Geography Analysis
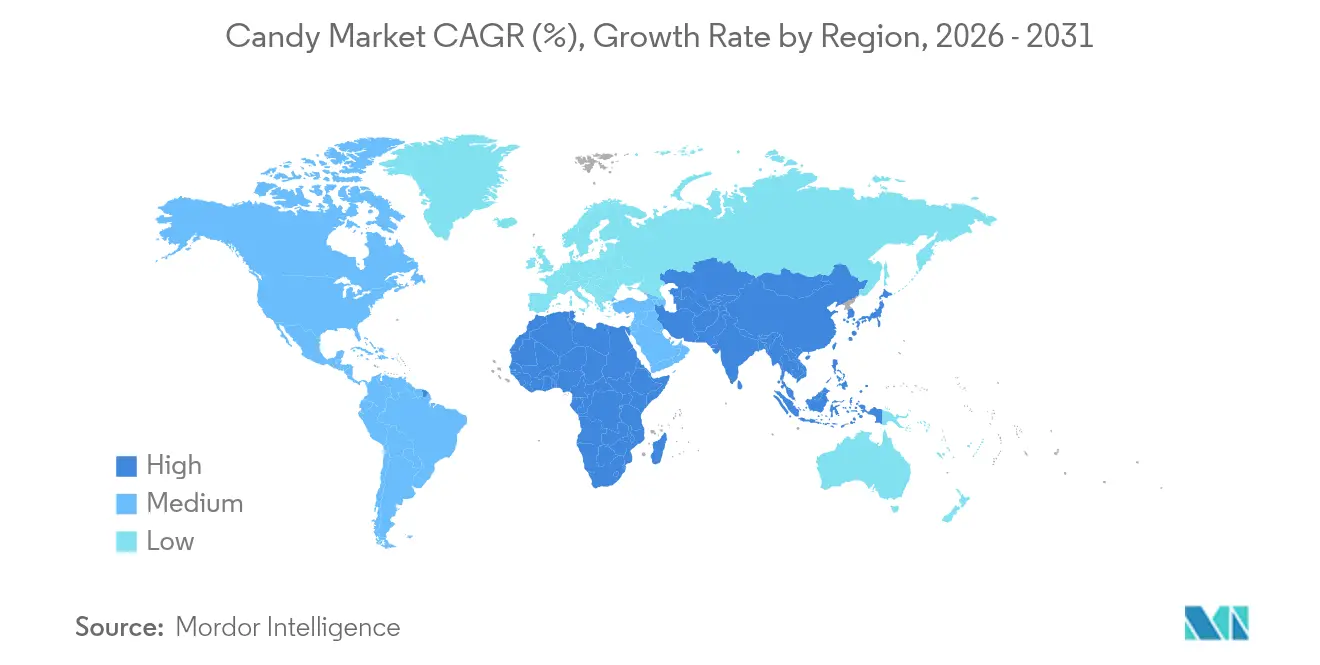
In 2025, North America holds a 35.92% share of the candy market, driven by established consumption patterns, a robust distribution network, and strong seasonal gifting traditions that boost premium pricing during major holidays. The region benefits from a well-developed retail infrastructure, which supports the availability of a wide range of candy products, catering to both mass-market and premium consumers. Additionally, high per-capita consumption rates and a preference for innovative product offerings further solidify North America's position as a key player in the global candy market. The mature nature of the market allows companies to implement sophisticated marketing strategies and leverage consumer loyalty effectively.
Europe represents a significant segment of the candy market, underpinned by its premium chocolate traditions, artisanal production heritage, and increasingly stringent sustainability regulations shaping industry practices. Diverse consumer preferences across countries create opportunities for localized product development and flavor innovation. EU packaging regulations further drive sustainable packaging adoption, influencing global industry standards. Major markets such as Germany, the United Kingdom, France, and Italy exhibit distinct consumption patterns and regulatory requirements, while Eastern Europe shows growth potential due to rising disposable incomes and the spread of Western consumption trends.
Asia-Pacific emerges as the fastest-growing region in the candy market, with a projected CAGR of 7.06% through 2031. Urbanization, rising middle-class incomes, and increasing market penetration in countries with historically low per-capita candy consumption drive this growth. China leads the region with double-digit growth in candy consumption, attracting significant investments from multinational companies in production and distribution. India, Japan, Australia, and Southeast Asia present unique opportunities and challenges, ranging from regulatory compliance to cultural preferences influencing product formulation and marketing strategies. South America, Middle East, and Africa represent emerging markets with significant long-term potential despite current smaller market shares, benefiting from economic development, population growth, and increasing exposure to global confectionery brands through improved distribution networks and digital connectivity.

Regulatory Landscape
Candy manufacturers operate under tightening global requirements for labeling, additives, and sweeteners that shape formulation choices and drive claim substantiation across chocolate and sugar confectionery. In February 2026, the US HHS/FDA introduced a new approach to voluntary "no artificial colors" claims and advanced approvals for naturally derived colors used in confectionery, including actions involving beetroot red (exempt from certification) and a gardenia (genipin) blue color additive for foods including hard and soft candy. In the EU, additive and flavoring compliance continues to evolve, including a 2025 European Commission authorization of a specified flavoring substance for food category 5 (confectionery) and ongoing scientific review and data expectations led by the European Food Safety Authority (EFSA).
Regulatory updates also extend to consumer-protection labeling and ingredient control beyond North America and Europe. In June 2026, Hong Kong's Centre for Food Safety proposed amendments to its Sweeteners in Food Regulations (Cap. 132U) to update the scope and maximum permitted levels for certain sweeteners, which can affect sugar-free and reduced-sugar candy recipes sold in the market. At the international standard-setting level, the Codex Alimentarius Commission adopted new guidance on precautionary allergen labeling ("may contain") in July 2026, reinforcing the need for stronger allergen risk assessment and clearer PAL statements in global brand portfolios, particularly for products with nut, milk, or soy cross-contact risks.
Value Chain Analysis
The candy value chain starts with agricultural and ingredient inputs (cocoa, sugar, dairy, palm oil, nuts, flavors, and colors), followed by processing (cocoa grinding, sugar refining, ingredient compounding), manufacturing (cooking, depositing, extrusion, molding, enrobing, panning), packaging, and then multi-channel distribution through modern trade, convenience, specialist retailers, and online retail. Chocolate-focused supply is especially exposed to upstream constraints because a significant share of cocoa originates from West Africa, while many confectionery brands rely on global ingredient suppliers and contract manufacturers to scale non-chocolate formats. Temperature-controlled handling (commonly requiring 15 to 18 degrees Celsius conditions for chocolate logistics) and packaging integrity are critical to reduce bloom, deformation, and returns, which increases operating complexity in warmer climates and for long-haul e-commerce fulfillment.
Recent operational priorities have centered on traceability, logistics resilience, and sustainable sourcing programs to manage cost and regulatory exposure. Corporate disclosures point to greater farm-level visibility and deforestation risk controls, such as Barry Callebaut mapping more than 1.5 million cocoa farms by 2024/25 to support compliance readiness for the EU Deforestation Regulation, and Hershey reporting that 80% of its core commodity supply chain is assessed as deforestation- and conversion-free as of 2025. Freight disruption has also been a material consideration, with 2025 supply chains facing higher shipping risk and costs (including Red Sea-related diversions), prompting manufacturers to strengthen regional warehousing, diversify sourcing geographies, and accelerate digital planning tools for demand and inventory balancing.
Competitive Landscape
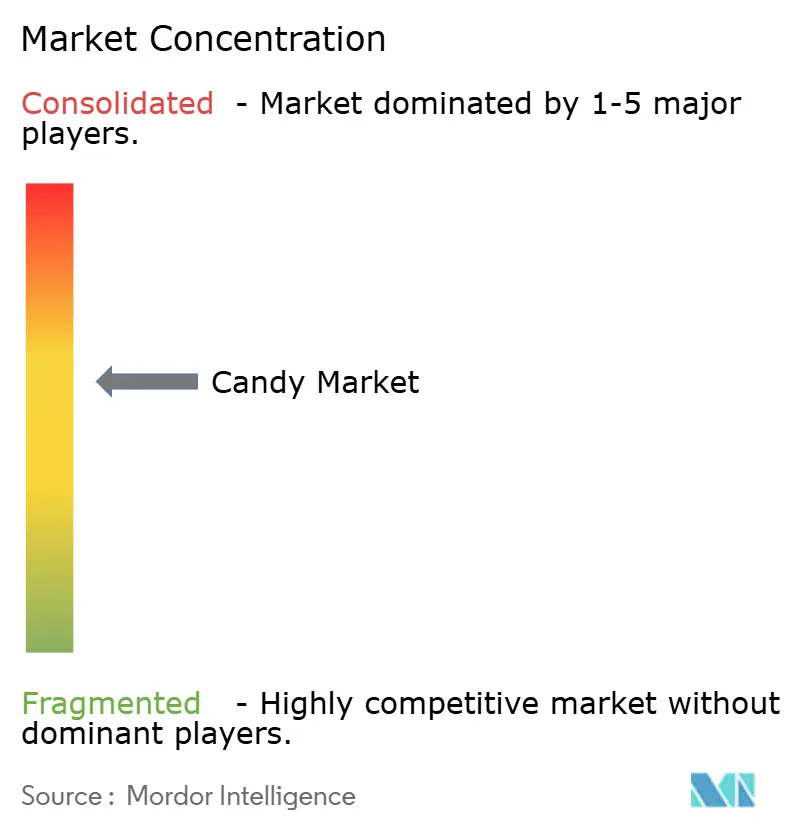
The candy market operates within a moderately consolidated competitive landscape, where established multinational players such as Mars, Mondelez, Hershey, and Ferrero hold significant market shares. These companies maintain their dominance through extensive brand portfolio management, continuous innovation, and strategic acquisitions. Such strategies enable these players to diversify their product categories and enhance their geographic reach, ensuring sustained growth in a competitive environment.
Regional players and artisanal producers also play a crucial role in shaping the market dynamics. These companies leverage their specialized positioning and deep understanding of local consumer preferences to capture market share. For example, artisanal chocolate makers in Europe focus on premium, handcrafted products that appeal to niche markets, while regional brands in Asia cater to unique flavor profiles preferred by local consumers. This localized approach allows smaller players to compete effectively against global giants, particularly in markets where cultural preferences heavily influence purchasing decisions.
Competition in the candy market is further intensified by vertical integration strategies adopted by leading companies. To mitigate supply chain risks and manage cost volatility, firms are increasingly investing in cocoa sourcing and processing capabilities. For example, Hershey has implemented sustainable cocoa sourcing programs to secure a stable supply of raw materials while addressing ethical concerns. Similarly, Ferrero has invested in its own cocoa processing facilities to reduce dependency on third-party suppliers. These initiatives not only strengthen supply chain resilience but also provide a competitive edge in terms of cost efficiency and product quality, further shaping the industry's competitive dynamics.
Candy Industry Leaders
-
The Hershey Company
-
Mondelez International, Inc.
-
Mars, Incorporated
-
Nestlé SA
-
Ferrero International S.A.
- *Disclaimer: Major Players sorted in no particular order

Market Opportunities and Future Outlook
Capacity and manufacturing modernization programs create room for faster format innovation and more localized supply, especially in high-growth non-chocolate segments and premium gifting assortments. In 2026, multiple major investments highlighted this direction: Ferrara announced a USD 675 million manufacturing plant in Orangeburg, South Carolina; Mondelez International expanded Toblerone capacity at its Bern Center of Excellence as part of a CHF 65 million (USD 83 million) investment; Morinaga & Co. opened a second HI-CHEW facility in Mebane, North Carolina (USD 130 million); and Haribo opened a GBP 35 million expansion at Castleford in the UK with an added warehouse and additional production line. These projects support opportunities tied to shorter lead times for seasonal spikes, broader SKU variety (textures, flavors, and portion sizes), and improved service levels for modern trade and online retail.
Product renovation and compliance-driven reformulation remain active opportunity areas as regulators and retailers press for sugar reduction, tighter additive specifications, and labeling credibility. The FDA pathway for naturally derived colors and evolving international guidance on precautionary allergen labeling provide a more defined framework for reformulating away from petroleum-based dyes and strengthening PAL governance across global portfolios. At the same time, supply chain digitization and traceability solutions are becoming more embedded in confectionery operations, backed by sustainability programs and farm-mapping initiatives among cocoa-linked players, which can help brands meet procurement requirements tied to deforestation-risk due diligence and chain-of-custody proof. Brands that convert these investments into differentiated sugar-free or reduced-sugar lines, functional candy formats, and premium seasonal gifting ranges have clearer routes to defend margins during cocoa and sugar price volatility while expanding in e-commerce and organized retail.
Recent Industry Developments
- July 2026: The Hershey Company launched REESE'S PIECES with Chocolate Cookie nationwide in the United States. The rollout extends the REESE'S PIECES franchise into a new texture-and-flavor format, supporting incremental merchandising across mass retail and convenience outlets during seasonal and everyday snacking occasions.
- May 2026: Mars, Incorporated announced a GBP 190 million investment in its historic Slough chocolate factory in the United Kingdom to transform the site into a next-generation manufacturing hub by 2028. The program signals continued automation and capability upgrades in core chocolate production, helping strengthen regional supply resilience amid raw-material and logistics volatility.
- May 2024: Ferrero International S.p.A. introduced Tic Tac Chewy, adding a chewy texture extension to the Tic Tac portfolio with Fruit Adventure and Sour Adventure varieties. The launch illustrates major players using format innovation to refresh established brands and capture demand in non-chocolate candy where texture experimentation drives trial.


Research Methodology Framework and Report Scope
Market Definition and Coverage
For this study, the candy market is defined as packaged confectionery sold for direct consumption, covering chocolate candy and non-chocolate candy across mass and premium price points. Values are captured at the point where products are sold through retail and comparable channels.
Scope exclusions: This sizing excludes bakery desserts, ice cream, and non-candy snack categories, even when they are sweetened or positioned for impulse buying.
Segmentation Overview
-
By Product Type
- Chocolate Candy
- Non-chocolate Candy
- Hard-boiled Candies
- Pastilles, Gums, Jellies and Chews
- Toffees, Caramels and Nougat
- Mints
- Other Non-chocolate Candies
-
By Ingredient Type
- Sugar-based Candies
- Sugar-free / Reduced-sugar Candies
-
By Category
- Mass
- Premium
-
By Distribution Channel
- Supermarkets / Hypermarkets
- Convenience Stores
- Specialist Retailers
- Online Retail
- Other Distribution Channels
-
By Geography
-
North America
- United States
- Canada
- Mexico
- Rest of North America
-
Europe
- Germany
- United Kingdom
- France
- Italy
- Spain
- Netherlands
- Sweden
- Poland
- Belgium
- Rest of Europe
-
Asia-Pacific
- China
- India
- Japan
- Australia
- South Korea
- Indonesia
- Thailand
- Singapore
- Rest of Asia-Pacific
-
South America
- Brazil
- Argentina
- Chile
- Colombia
- Peru
- Rest of South America
-
Middle East and Africa
- United Arab Emirates
- South Africa
- Saudi Arabia
- Nigeria
- Egypt
- Morocco
- Turkey
- Rest of Middle East and Africa
-
North America
Data Sources, Market Sizing, and Validation
Desk Research
Desk research was used to build the starting structure of the model and to set realistic guardrails for volumes, pricing, and channel mix. We relied on public sources such as USDA food data, FAOSTAT supply indicators, UN Comtrade trade flows for sugar and cocoa-linked inputs, WTO tariff notes that influence cross-border pricing, and World Bank macro series for currency and consumer spending direction.
To make the market outputs usable for business decisions, we also reviewed company annual reports, investor presentations, and reliable press coverage to understand portfolio mix shifts, pack size trends, and channel expansion (including online). In parallel, a paid company financials and intelligence subscription and an import and export shipment-level database were used selectively to spot-check large player scale and trade patterns where public reporting was too broad. These examples are not exhaustive, and many other sources were also referenced during data collection, validation, and research clarification.
Primary Interviews and Surveys
Primary work focused on converting broad secondary signals into realistic market assumptions, especially where candy definitions and channel boundaries vary by country. We spoke with a mix of manufacturers, ingredient and packaging stakeholders, distributors, and retail-side experts to validate pricing behavior, promo intensity, and the split between chocolate and non-chocolate demand across major regions.
Interview feedback was also used to pressure-test key inputs like premiumization rates, sugar-free adoption, and online retail contribution, and then to check whether the resulting market totals matched what practitioners observe in day-to-day demand patterns in the same regions.
Distribution of primary research fieldwork respondents
| Company type | Respondent position | Region |
|---|---|---|
| Top tier: 28% | CXOs: 14% | APAC: 41% |
| Mid tier: 51% | Functional/Unit leaders: 27% | EMEA: 34% |
| Smaller Players: 21% | Managers: 59% | Americas: 25% |
Market-Sizing & Forecasting
Sizing starts with a top-down build where consumption and retail channel demand are reconstructed by region, then mapped into candy revenues using category mix and price ladders. To keep totals grounded, results are corroborated with selective bottom-up approximations, such as sampled price per kilogram or per pack multiplied by estimated volumes, and distributor and channel checks that help adjust overstatements.
Key model inputs include the chocolate versus non-chocolate split, premium share movement, sugar-free and reduced-sugar penetration, online retail share, and average selling price shifts driven by cocoa and sugar cost direction and promotional intensity. Where a variable is not consistently available for a smaller country, proxy logic is used, such as applying region-level channel shares with an adjustment based on income and modern trade presence.
For forecasting, we primarily use scenario analysis supported by short time-series smoothing on the base variables. Candy demand is stable, but pricing and mix can move quickly with ingredient costs and retailer promotions. Assumptions are reviewed with interview feedback to confirm whether the forward path reflects realistic pricing pass-through and consumer trade-down patterns.
Data Validation & Update Cycle
Outputs are cross-checked against independent signals such as ingredient-linked price movements, trade direction changes, and channel expansion indicators, and then reviewed for outliers at country and regional levels. If a region shows a sudden jump that is not supported by inputs like pricing, volumes, or channel mix, the drivers are reworked and, when needed, experts are re-contacted to confirm what actually changed.
Before sign-off, the model goes through multi-step analyst review so assumptions, conversions, and aggregation logic are consistent and traceable. Reports are refreshed annually, and interim updates are made when material events occur, such as major pricing shocks or large channel disruptions. Right before delivery, a final pass is completed so clients receive the latest updated view.
Mordor Intelligence's Candy Market Size Compared Against Other Published Estimates
Published market sizes for candy can look far apart, even when they appear to be describing the same products. The main reasons are usually differences in what gets counted as candy, how pricing is treated across countries, and whether figures are built from a retail demand view or from a much wider confectionery lens.
The main gap comes from category scope, where Mordor Intelligence treats candy as chocolate and non-chocolate candy sold through defined retail and comparable channels, instead of rolling up the full confectionery universe or adding adjacent sweet snacks that can inflate totals.
Benchmark comparison
| Source | Market Size | Gaps in Research Methodology |
|---|---|---|
| Mordor Intelligence | USD 78.81 B (2026) | |
| Global Consultancy A | USD 263.34 B (2025) | Uses a much broader roll-up that appears to capture a wider confectionery value pool and additional segmentation layers, which can shift the counted revenue base beyond retail candy sales and expand the total significantly. |
| Industry Publisher B | USD 79.15 B (2025) | Differences mainly come from base-year timing and price normalization, since currency conversion year, inflation handling, and channel pricing assumptions can move the value even when product scope looks similar. |
The comparison indicates that the spread is mostly explained by scope width and the year and pricing assumptions used for value conversion. By keeping the counted products and channels explicit, and by tying pricing to observable pack and promotion behavior, the market total is easier to reproduce and to track over time as conditions change.


Key Questions Answered in the Report
What is the projected value of the candy market by 2031?
The candy market is forecast to reach USD 98.66 billion by 2031, reflecting a 4.59% CAGR from 2026.
Which product group is growing fastest within the category?
Pastilles, gums, jellies, and chews lead growth at an 8.30% CAGR through 2031.
How large is the online channel’s contribution to confectionery sales?
While supermarkets hold 39.88% of revenue, online retail is expanding fastest, registering a 6.58% CAGR to 2031.
What factors are fueling Asia-Pacific demand?
Urbanization, middle-class income gains, and modern grocery expansion are driving a 7.06% CAGR for regional candy sales.
Page last updated on:


